The BESPOKE REPORT — 4/8/16
Each week, Bespoke sends clients across all of its subscription levels the Bespoke Report newsletter. If you’re looking for Bespoke’s analysis of current market internals, economic data, earnings beats and misses, individual stock ideas, and more, the Bespoke Report has it all. If you sign up for a subscription between now and Sunday, you’ll receive a 20% discount for the life of your membership! Simply choose one of the offerings below to gain access to some of the best research you’ll find anywhere. Here’s a matrix of the products included with each level of service. Have a great weekend!
Newsletter Annual – $316/yr (20% off)
Newsletter Monthly – $39/mo (20% off)
Premium Annual – $795/yr (20% off)
Premium Monthly – $79/mo (20% off)
Institutional Annual – $1595/yr (20% off)
Institutional Monthly – $155/mo (20% off)
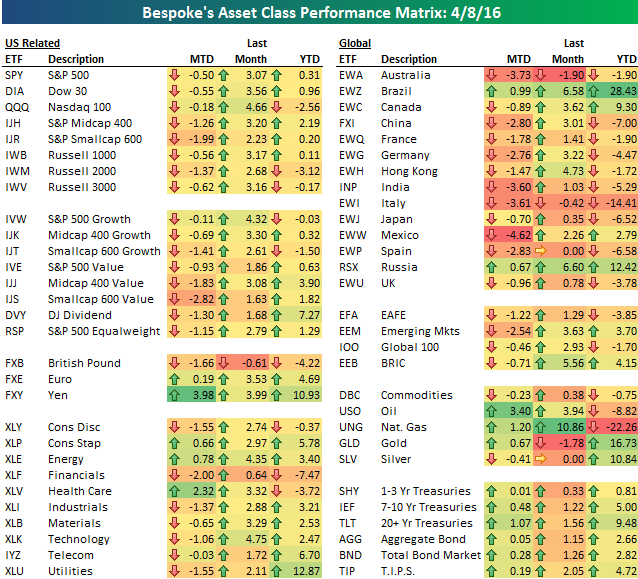
Below is a look at our asset class performance matrix using key ETFs traded on US exchanges. So far, equities have trended slightly lower in April after experiencing huge gains in March. Health Care has bucked the negative trend and gained 2.5% this month, while Financials and Consumer Discretionary have lagged. Oil is now up on the month after a 6% gain to close out the week, and Treasuries have rallied, pushing the yield on the 10-year down to 1.71%.
Bespoke Weekly Chart Book: 4/8/16
ETF Trends: Hedge – 4/8/16
Health Care and Energy Lead the Way
The day isn’t quite over yet, but equities experienced a bit of a hangover this week with the S&P 500 down over 1%. In the chart below we summarize this week’s ten biggest leaders and laggards of the 60+ S&P 500 industries. In terms of winners, it was a good week for Health Care and Energy as six industries from those sectors made the top ten. In addition to these six groups, Construction Materials, Tobacco, Aerospace & Defense, and Beverages all made the list.
While only eight of the top ten industries managed gains of even 1%, all ten of the worst performing industries were down over 3%. If your name had “consumer” in it, this wasn’t the week for you. Diversified Consumer Services was down more than 7%, while Consumer Finance was down 3.17%. In addition to these two, there were plenty of other consumer-facing industries among the week’s biggest losers, including Automobiles, Multiline Retail, and Textiles, Apparel & Luxury Goods. It’s never nice to see a 1% decline on the week, but after the rally we’ve had since the February 11th lows, a bad week is much easier to stomach.

Chart of the Day – Oil Check
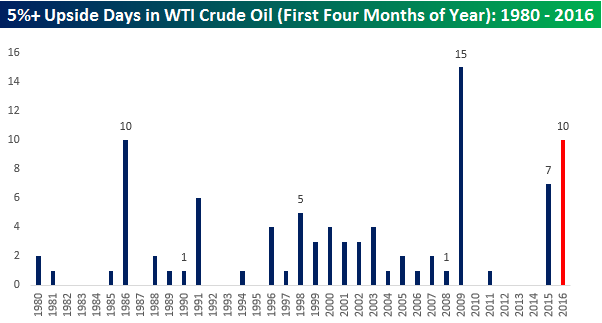 WTI crude oil is currently trading up over 6% in what is the best day for the commodity since its 12.3% rally back on 2/12. Just to highlight how volatile crude oil prices have been so far this year, today’s rally is the tenth one day gain of more than 5% for crude oil this year. The chart to the right shows the number of 5%+ upside days for crude oil in the first four months of a calendar year since 1980. With ten already, this year ranks as the second most. Even with all of these big one-day rallies for crude oil, though, you may be surprised to find that the front month futures price is up just 7% on the year.
To read our Chart of the Day, enter your info below and start a free Bespoke research trial. During your trial, you’ll also receive access to our model stock portfolios, daily market alerts, and weekly Bespoke Report newsletter.
[thrive_leads id=’59052′]
Bespoke Earnings Estimate Revisions: 4/8/16
Dynamic Upgrades/Downgrades: 4/8/16
Tesla (TSLA) Market Cap Closing In on Ford (F), General Motors (GM)
Tesla (TSLA) began the year with a 40% decline from its closing price on the last day of 2015 through February 10th. Since February 10th, however, the stock has rallied 85%! Oil’s rebound and the fact that more than 325,000 people have given the company $1,000 each to pre-order the new Model 3 have both contributed to the stock’s ascent.
Tesla’s market cap is now up to $33.9 billion. Below is a chart comparing Tesla’s market cap to the market caps of two other American car manufacturers — General Motors (GM) and Ford (F). As you can see, both GM and Ford have seen their market caps drift steadily lower over the last two years, and up until the last two months, Tesla’s market cap was drifting lower as well. A lot has changed in just the last few weeks, however, and Tesla’s market cap is now as close as it has ever been to both Ford’s and GM’s.

Below are charts showing the spread between the market caps of Tesla and Ford and Tesla and GM. As mentioned above, both spreads are now as tight as they have ever been. How long until Tesla overtakes them to become America’s largest car manufacturer by market cap?
Start a 14-day no obligation free trial to receive Bespoke’s paid content for the next two weeks.

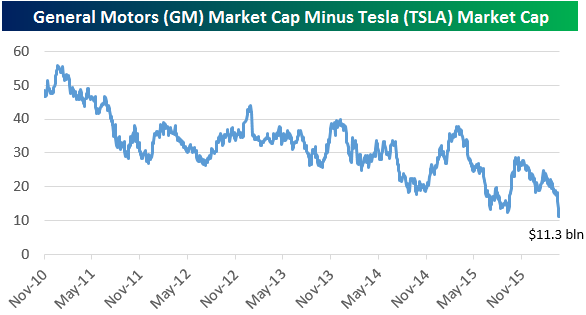
Chart of the Day – Financial Pain
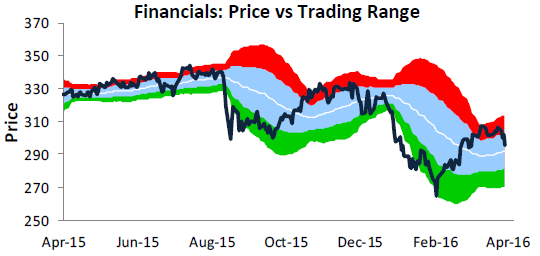 In what was a painful day for bulls on Thursday, the Financial sector had it especially tough as it fell more than any other sector (-1.93%). The chart to the right is from our weekly Sector Snapshots report (available to all Bespoke Premium and Institutional clients), which provides a quick look at where the S&P 500 and each of the ten sectors stand on a variety of different metrics. The chart to the right shows the Financial sector relative to its normal trading range (+/- one standard deviation above and below 50-DMA) in blue. Readings in red are considered overbought, while the green area represents oversold conditions. After nearing extreme overbought levels back in late March and making a lower high last Friday, the Financials sector has declined 3.4%, which is nearly twice the decline of the S&P 500 over that same span.
To read our Chart of the Day, enter your info below and start a free Bespoke research trial. During your trial, you’ll also receive access to our model stock portfolios, daily market alerts, and weekly Bespoke Report newsletter.
[thrive_leads id=’59052′]