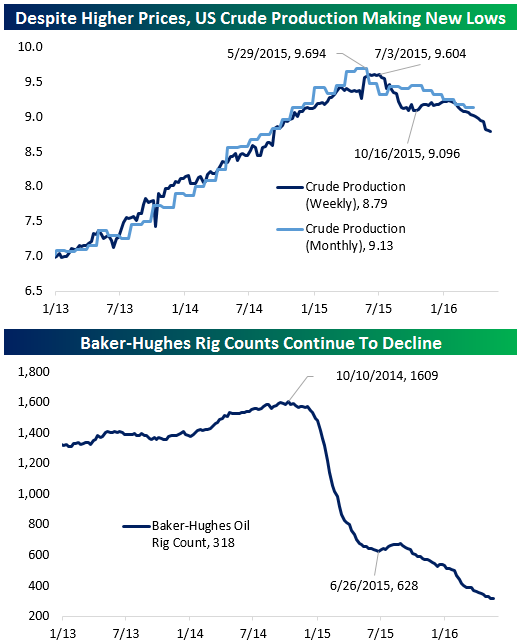
Rig Counts Flat After 8 Weeks of Declines
As we noted at the end of April, rig counts in the US have not yet ticked up despite a steady rally in crude oil prices. As we outlined in that earlier post, we consider it unlikely that US production will rise materially without a rise in drilling. The primary measure of drilling activity, Baker-Hughes’ weekly report on the number of rigs active in the United States, came out earlier this afternoon. That figure was flat at 318 this week, the first without a decline in 8 weeks. Could this be the bottom? We have no way to know, but production data has continued to decline as we would expect given the rig count activity data; it fell to a new local low of 8.79mm barrels per day in data reported by the EIA Wednesday morning. That suggests more reliable monthly estimates of output will also continue to decline in coming months.
Bespoke Earnings Estimate Revisions: 5/20/16
Tale of Two Retailers: Consumer Pulse Update
In the past few months, we’ve introduced a product called Consumer Pulse that uses survey data from thousands of consumers to identify actionable investment ideas. In the past, we’ve highlighted trends in Apple and Amazon, and today we have another example of how useful this product can be for making investment decisions. Earlier this month, Consumer Pulse subscribers got an update that we had rotated out of Target (TGT) and into Wal-Mart (WMT) based on results from the April survey. Now that both companies have reported Q1 and we’ve seen the thesis play out, we wanted to highlight what we learned through Pulse:
Recent Results: Target reported on 5/18. Q1 earnings actually beat estimates while revenue was a little lower than analyst expectations. However, based on a soft outlook for Q2 and very cautious commentary from management, shares were off by as much as 11% post the earnings release. Bricks and mortar retailers traded off alongside Target on Wednesday as the market prepared for Wal-Mart to release earnings the following day. When Wal-Mart finally did release on Thursday 5/19, WMT holders got a nice surprise as the troubles at Target were nowhere to be found in Wal-Mart.
Survey Says: While the divergence in the fortunes in Wal-Mart and Target caught many market commentators off sides, we were able to observe this trend through our survey data weeks in advance. Among the many trends we follow in our Pulse surveys is store traffic as reported by actual consumers. Based on our most recent surveys, we noticed a clear negative change in Target traffic relative to Wal-Mart and other discount retailers. In fact during the earnings call, Target’s management noted the traffic decline in April, which is exactly what our survey data reflects.

Bespoke subscribers (and now non-subscribers too!) can purchase our Consumer Pulse survey analysis for just $365/year or $39.99/month (including a 30-day free trial). We strongly encourage you to give our Consumer Pulse subscription a try!
As a non-member, you can purchase Consumer Pulse below as a stand-alone product, or subscribe to one of our other memberships and get a big discount on Consumer Pulse. Click here to learn more about the product.
Annual — Bespoke Consumer Pulse — $365/Year w/ 1-Month Free Trial
Monthly — Bespoke Consumer Pulse — $39.99/Month w/ 1-Month Free Trial
ETF Trends: US Indices & Styles – 5/19/16
Below is a list of the best and worst performing ETFs across all asset classes over the last week. Biotech continues to outperform, while new highs in oil earlier this week have helped boost Energy-related ETFs including gaudy returns for MLPs. Semiconductors have also put in a decent run with Banks and the US dollar. The worst performers are in LatAm with Brazil getting pounded lower. Other EM assets, REITs, and metals ETFs have fared poorly as well.

Bespoke provides Bespoke Premium and Bespoke Institutional members with a daily ETF Trends report that highlights proprietary trend and timing scores for more than 200 widely followed ETFs across all asset classes. If you’re an ETF investor, this daily report is perfect. Sign up below to access today’s ETF Trends report.
See Bespoke’s full daily ETF Trends report by starting a no-obligation free trial to our premium research. Click here to sign up with just your name and email address.
Bespoke’s Sector Snapshot: 5/19/16
We’ve just released our weekly Sector Snapshot report (see a sample here) for Bespoke Premium and Bespoke Institutional members. Please log-in here to view the report if you’re already a member. If you’re not yet a subscriber and would like to see the report, please start a 14-day trial to Bespoke Premium now.
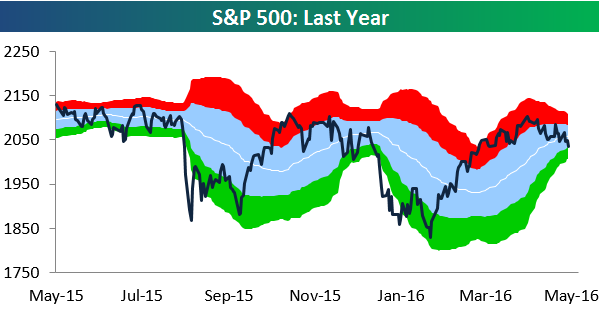
Below is our trading range chart for the S&P 500 that’s always included in the Sector Snapshot. The green area in the chart represents oversold territory for the index, and as you can see, we hit oversold levels today just barely for the first time since mid-February.
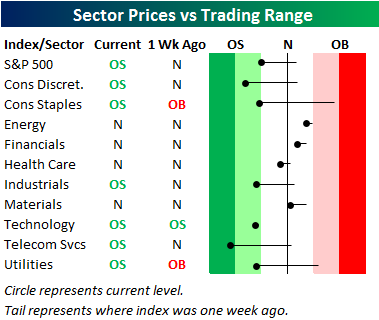
Below our chart of the S&P 500, we provide our trading range screen for the ten S&P 500 sectors. For each sector, the dot represents where it’s currently trading, while the tail end represents where it was trading one week ago. The black vertical “N” line represents each sector’s 50-day moving average. Last week at this time, two of ten sectors were overbought while just one was oversold. As of today, six sectors are oversold while none are overbought. Just three sectors remain above their 50-day moving averages — Energy, Financials, and Materials. These are the three sectors that had been performing the worst coming into 2016, and yet now they’re the sectors keeping the market afloat.
To see our full Sector Snapshot with additional commentary plus six pages of charts that include analysis of valuations, breadth, technicals, and relative strength, start a 14-day free trial to our Bespoke Premium package now. Here’s a breakdown of the products you’ll receive.
B.I.G. Tips – May Following the Script
the Bespoke 50 — 5/19/16
Philly Fed Back Down to Negative Territory
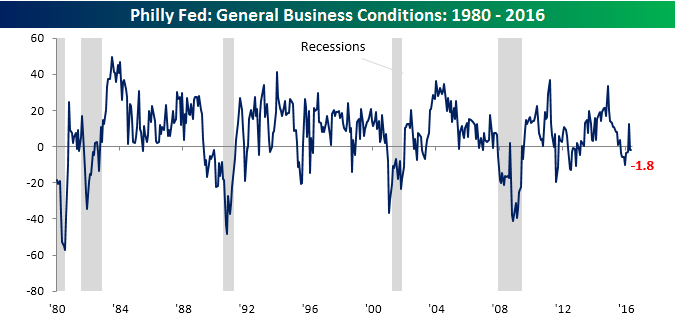
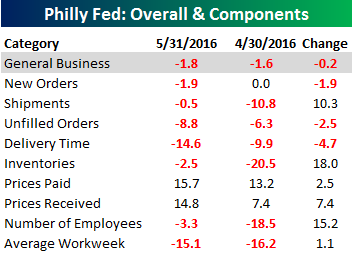 Like its New York sibling, today’s report on manufacturing in the Philadelphia region weakened modestly this month and came in weaker than expected. While economists were expecting a positive reading of 3.0, the actual reading remained sub-zero at -1.8. The headline reading saw a nice bounce in March, but the last two months have seen all of that given back (chart below). The table to the right breaks down this month’s report by each of its subcomponents. Even though General Business Conditions showed a modest decline this month, the majority of components actually increased with the biggest jumps coming in Inventories, Number of Employees, and Shipments. On the downside, the only declines were in Delivery Times, Unfilled Orders, and New Orders.
Worst Performing S&P 500 Stocks on Earnings
Yesterday we highlighted the best performing S&P 500 stocks on earnings so far this season (through Tuesday), and below we provide the opposite list — the worst performing S&P 500 stocks on earnings. The stocks featured below all fell more than 6% on their earnings reaction days (the first trading day following earnings). Eleven stocks in the S&P experienced one-day drops of 10% or more in response to their earnings reports, with Endo International (ENDP) dropping the most at -39.19%. That’s nearly double the next closest stock on the downside, which is Stericycle (SRCL) at -21.5%. Seagate Tech (STX) ranks third worst with a drop of 19.07%, followed by Macy’s (M) and Nordstrom (JWN), which round out the top five. Market-darling Netflix (NFLX) is also on the list of biggest losers with a decline of 12.97% on its earnings reaction day following its April 18th release. Other notables on the list of earnings season losers this quarter include Kohl’s (KSS), First Solar (FSLR), Priceline (PCLN), Microsoft (MSFT), and Apple (AAPL).
