ETF Trends: Hedge – 8/31/17
End of an Era for Jobless Claims?
Summer may be ending, but that means you can take advantage of our Labor Day Special and receive a month of full access to any one of our research services for just $1 and then 20% off for the life of the subscription!
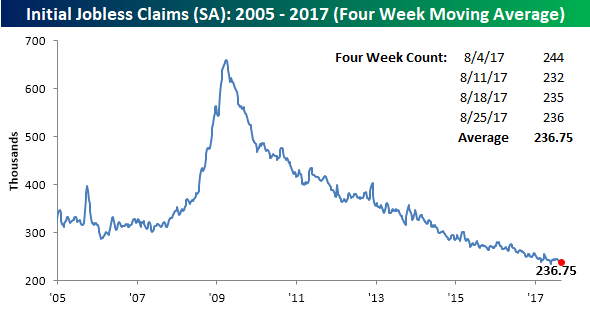
Jobless claims once again came in at impressive levels this week, rising from 235K up to 236K compared to expectations for a reading of 237K. How impressive are the current low levels of jobless claims? Here are a few examples. For starters, this week’s reading was the 130th straight weekly print where claims came in below 300K. It was the 13th straight week where claims were at or below 250K, and the third straight week where claims were below 240K. All of these streaks are simply amazing. All good things must come to an end, though, and because of the impacts from Hurricane Harvey, you can expect that in the next couple of weeks, claims will definitely be rising back above 250K and most like back above 300K as well.

With this week’s sub-240K print, the four-week moving average for jobless claims almost made a new cycle low, falling from 238K down to 236.75K. That’s just 1.25K above the multi-decade low of 235.5K from mid-May. Again, though, because claims are likely to rise in the coming weeks, that low from May is more than likely safe…for now.
On a non-seasonally adjusted (NSA) basis, claims were also strong, coming in at just 196K. For the current week of the year, that is 96K below the average for the current week of the year dating back to 2000. To find a year where claims were lower for the current week, you have to go back to 1973.
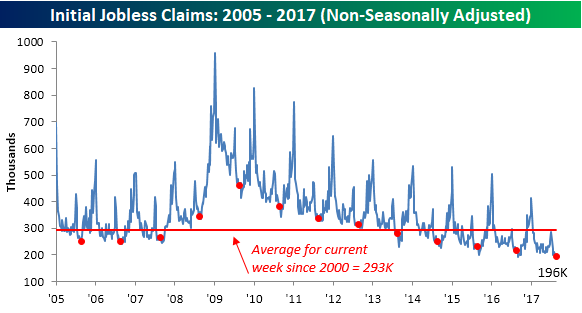
Chart of the Day: Comfortably Polarized
Running of the Bears
Summer may be ending, but that means you can take advantage of our Labor Day Special and receive a month of full access to any one of our research services for just $1 and then 20% off for the life of the subscription!
There still may technically be three weeks left in summer, but with Labor Day weekend fast approaching, the summer season is starting to wind down. As they look forward to the last four months of 2017, individual investors are in an extremely unoptimistic mood. According to the weekly survey from AAII, bullish sentiment declined from 28.1% down to 25.0%. That’s the lowest reading since mid-May and before that late October. Sure, the market has been a bit more volatile lately, but the fact that sentiment has shifted so far south from what was already a pretty depressed range seems a bit overdone.
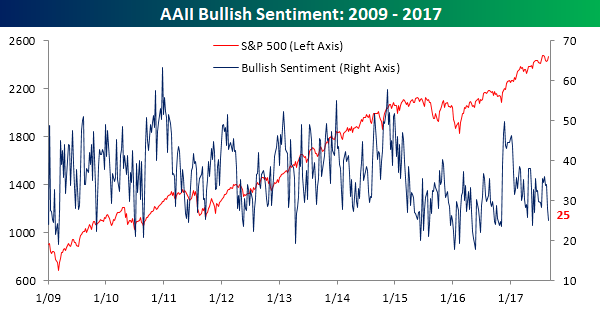
Along with low levels of bullish sentiment, bearish sentiment remains elevated. In this week’s survey, bearish sentiment increased from 38.29% up to 39.89%, which is the highest weekly reading since early March. Before that, you have to go all the way back to the early 2016 lows to find a week where bearish sentiment was higher.

Neutral sentiment also ticked higher this week, rising from 33.61% up to 35.11%. That’s actually down from recent highs, and while it’s nice to see that investors are at least taking more of a stand, the position they are increasingly choosing is bearish.

S&P 500 Back Above 50-DMA; Breadth Not Quite Caught Up
Summer may be ending, but that means you can take advantage of our Labor Day Special and receive a month of full access to any one of our research services for just $1 and then 20% off for the life of the subscription!
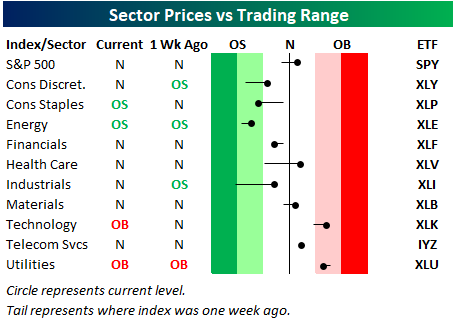
As shown in our sector trading range screen below, the S&P 500 has re-taken its 50-day moving average as we get set to begin the last trading day of August. (For reference, the black, vertical “N” line represents each sector’s 50-day moving average. The dot represents where each sector is currently trading, while the tail end represents where it was trading one week ago.)
While the S&P is back above its 50-day, some key cyclical sectors remain below their 50-days. These include Consumer Discretionary, Energy, Financials, and Industrials. Fortunately, both Health Care and Technology — the two largest sectors — are solidly back above their 50-days
Below is an updated snapshot of a key breadth measure we track — the percentage of stocks trading above their 50-day moving averages. While the S&P 500 is back above its 50-day moving average on a price basis, as shown below, less than 50% of the stocks in the index are trading above their 50-days. This is a slightly negative breadth divergence.
The most defensive sector of the market — Utilities — currently has the strongest breadth, while Technology ranks second at 66%. If it weren’t for Tech’s massive outperformance this year, the market would be in a much different — darker — place.
On the downside, Energy has the weakest breadth with just 25% of stocks above their 50-days. The Financial sector remains weak as well at 36%.

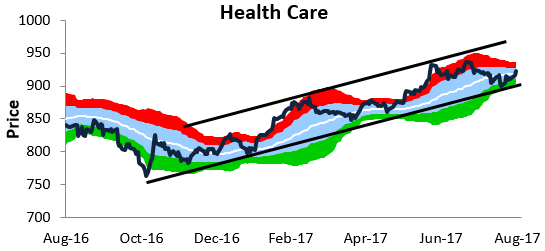
As mentioned above, both Tech and Health Care are trading back above their 50-day moving averages. These two sectors currently have the most attractive chart patterns in our view. Tech is in the midst of another breakout, while Health Care is swinging higher within a long-term uptrend channel.

On another note, Tech’s weighting in the S&P 500 is now all the way up to 23.5%, while Health Care has just moved into second place with a weighting of 14.5%. The Financial sector has slipped into third with a weighting of 14.3%.

Don’t forget to take advantage of our Labor Day Special!
the Bespoke 50 — 8/31/17
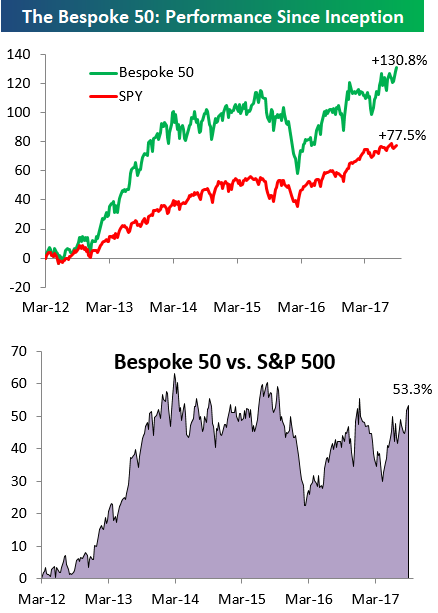
Every Thursday, Bespoke publishes its “Bespoke 50” list of top growth stocks in the Russell 3,000. Our “Bespoke 50” portfolio is made up of the 50 stocks that fit a proprietary growth screen that we created a number of years ago. Since inception in early 2012, the “Bespoke 50” has beaten the S&P 500 by 53.3 percentage points. Through today, the “Bespoke 50” is up 130.8% since inception versus the S&P 500’s gain of 77.5%. Always remember, though, that past performance is no guarantee of future returns.
To view our “Bespoke 50” list of top growth stocks, sign up for Bespoke Premium ($99/month) at this checkout page and get your first month free. This is a great deal!
B.I.G. Tips – September 2017 Seasonality
The Closer — US Growth & More Harvey Fallout — 8/30/17
Log-in here if you’re a member with access to the Closer.
Looking for deeper insight on global markets and economics? In tonight’s Closer sent to Bespoke Institutional clients, we review energy markets including EIA petroleum market information updated today and market prices. We also discuss today’s GDP report and the economic implications of Hurricane Harvey.

The Closer is one of our most popular reports, and you can sign up for a free trial below to see it!
See today’s post-market Closer and everything else Bespoke publishes by starting a no-obligation 14-day free trial to our research platform!
Chart of the Day — Tech Sector Valuation
Bespoke Consumer Pulse Report — August 2017
Bespoke’s Consumer Pulse Report is an analysis of a huge consumer survey that we run each month. Our goal with this survey is to track trends across the economic and financial landscape in the US. Using the results from our proprietary monthly survey, we dissect and analyze all of the data and publish the Consumer Pulse Report, which we sell access to on a subscription basis. Sign up for a 30-day free trial to our Bespoke Consumer Pulse subscription service here. With a trial, you’ll get coverage of consumer electronics, social media, streaming media, retail, autos, and much more. The report also has numerous proprietary US economic data points that are extremely timely and useful for investors.
