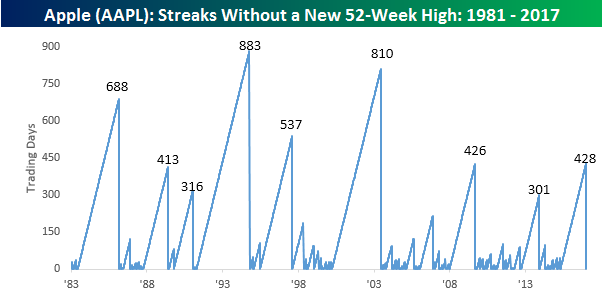
Each day with our Morning Lineup, we include charts of each stock in the Russell 1000 hitting 52-week highs and lows in the prior day’s session. Back on Monday, one stock showed up on the list of new highs that hasn’t been on the list in quite some time. That stock was Apple (AAPL), and it did so just in time to celebrate the 10th anniversary of the iPhone. Even as the S&P 500 has hit multiple new all-time highs in the last several weeks, AAPL had been one stock that was conspicuously absent from the run to new highs. In fact, Monday’s new 52-week high for AAPL ended a streak of 428 trading days where the stock failed to hit a new one-year high. As shown in the chart below, that ranks as the ninth streak of a year or longer, the longest streak without a new high since 2003, and the fifth-longest streak since 1981.
So now that AAPL is back on the party bus, is the recent new high a sign of good things to come? In today’s Chart of the Day sent to Bespoke subscribers, we looked at each prior period where AAPL went a year or longer without hitting a 52-week high and then calculated how the stock performed in the period after the streak ended. See today’s Chart of the Day by starting a 14-day free trial to Bespoke’s premium research below.