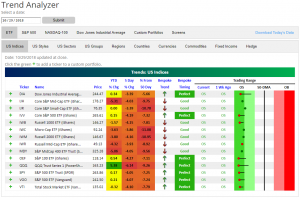
Trend Analyzer – 10/30/2018 – Seeing Red
As lower closes have become more or less the norm lately, the major US Index ETFs from our Trend Analyzer continue to look worse and worse. Every one of the members of this group is still deeply oversold. More concerning is that half of these are now in downtrends after declining all of October. Once again those fairing the worst are predominantly comprised of small to mid-caps. Up until this point, the other members of this group had held up relatively well. Even though they have been declining this month, they had not gone under levels from the start of the year. This does not hold as true anymore. An increasing number have either gone negative on the year or are close to it. The Nasdaq (QQQ) is the only one up more than 1% YTD. Furthermore, QQQ is a far cry from where it had been just one week ago. This time last week it had seen YTD gains of 12.28%, but since that time, QQQ has fallen 6.14%, cutting these gains by more than half to 5.38% YTD.
Morning Lineup – Another Gap Higher
The S&P 500 is looking to open higher again this morning following some crazy late-day trading yesterday. It may sound hard to believe, but today’s positive open will be the 11th time in 22 trading days this month that equities opened the day higher. Even though this has been one of the worst Octobers on record and the worst month in years, stocks have had positive opens on half of the trading days this month. The problem, as we all know by now, is what happens once that opening bell rings; there have only been six trading days where stocks have finished the day higher than they open.
For the full recap of all the major overnight developments around the globe, check out the full Morning Lineup.
When it comes to financial markets, the last few weeks provide a great example of how quickly gains can vanish. The chart below is from page two of our Morning Lineup, and it shows the relative strength of the S&P 500 vs the US Treasury Long Bond Future over the last year. When the line is rising it indicates outperformance from equities and vice versa.
It was only a month ago that the performance of equities was leaving treasuries in the dust, but in the span of less than one month, equities have given up more than half of their outperformance relative to Treasuries. Less than a month!

Start a two-week free trial to Bespoke Premium to see today’s full Morning Lineup report. You’ll receive it in your inbox each morning an hour before the open to get your trading day started.

The Closer — EEM New Lows, Sector Dispersion, PCE, Manufacturing, Capex — 10/29/18
Log-in here if you’re a member with access to the Closer.
Looking for deeper insight on markets? In tonight’s Closer sent to Bespoke Institutional clients, we dive into how Tech is dragging down the market, or maybe more accurately how it isn’t holding the market up like it used to. We also take a look at some very bearish stats related to breadth today, the decline in EEM, and economic analysis in the form of personal income and spending, the last piece of data for our Five Fed Manufacturing index in October, and the outlook for capex spending.

See today’s post-market Closer and everything else Bespoke publishes by starting a 14-day free trial to Bespoke Institutional today!
B.I.G. Tips – Last Two Days of BAD Months
Wire to Wire Selling
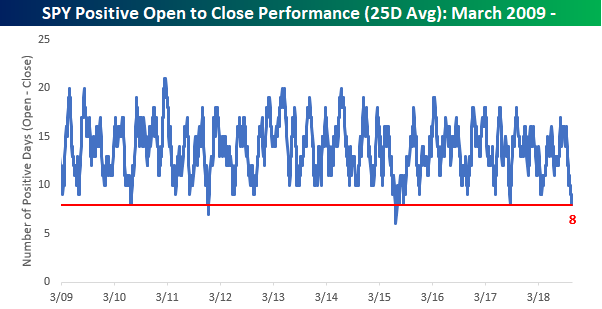
We’ve highlighted this trend a number of times and most recently this morning as well as in last Friday’s Bespoke Report, but the hours from 9:30 AM to 4:00 PM Eastern just haven’t been friendly to the bulls. Over the last 25 trading days, the S&P 500 tracking ETF (SPY) has closed higher than its opening price on just 8 trading days. The chart below shows the historical rolling 25-day total of days where SPY finished a trading day higher than its opening price going back to 2009. During that span, there have only been a handful of periods where we saw similar amounts of selling pressure over a five-week period and only two periods where there was even more relentless selling.
The two periods where the rolling 25-day total fell even lower were in December 2011 and July 2015, while the only two other periods of similar selling pressure were in July 2010 and August 2017. In three of these four prior periods, the S&P 500 was quick to regain its upward trend, but in July 2011, it was another six months before equities finally bottomed and started to rally again.

Clicks to Bricks?
“Rumors of my death have been greatly exaggerated.” — Mark Twain
Traditional brick and mortar retailers are soaring today with the average stock in our Death by Amazon index up 2.76% on the day. As shown below, around half of these retailers are up 3-5% on the day with just a handful in the red.
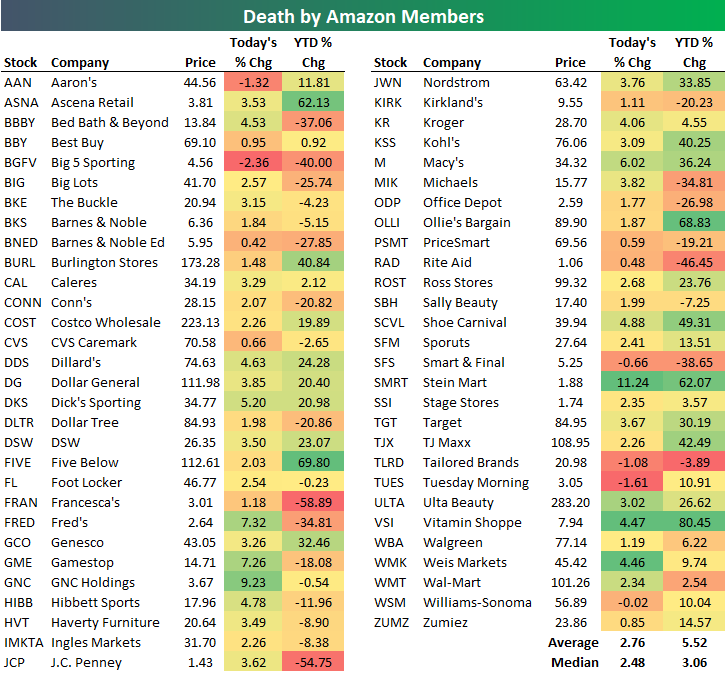
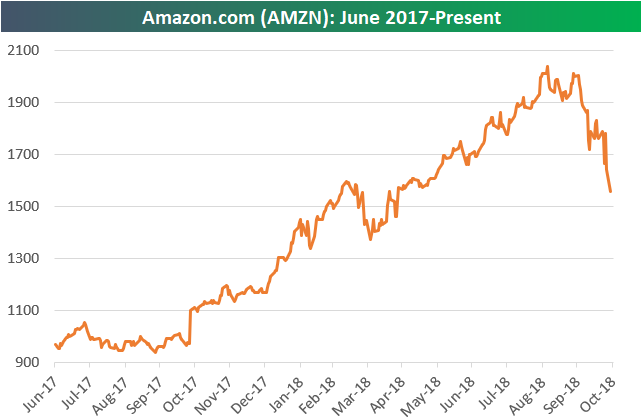
As brick-and-mortar retailers see buying, Amazon.com (AMZN) has seen another wave of selling today with a drop of more than 4.5% as of mid-afternoon. This is on the heels of AMZN’s 7.82% drop on Friday after the company missed revenue estimates and lowered guidance for the second quarter in a row.
The chart for AMZN is really breaking down. After trading in a tight uptrend channel from October 2017 through August 2018, the stock is currently in free-fall in what appears to be a straight path towards $1,500/share. What’s remarkable is that even after the stock’s 23.6% decline from its highs, it’s still up 34% year-to-date!
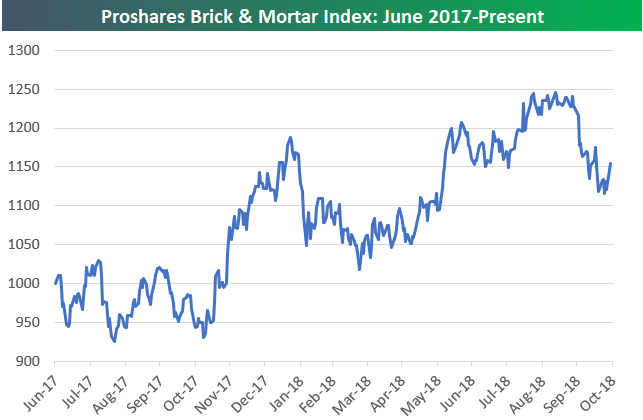
The chart for the Proshares Brick & Mortar index (which was created years after we formed the Death by Amazon index) has fallen a bit from its highs, but it still looks much more constructive than AMZN’s chart at this point, especially with today’s big bounce.
Since the Proshares Brick & Mortar index began back in June 2017, AMZN still holds a commanding lead on it. AMZN is up 61% versus a gain of 15.5% for Brick & Mortar. However, the fact that Brick & Mortar is in the green at all over the last 16 months is the real story. From mid-2015 through mid-2017, traditional retailers most at risk of online were slammed, but they’ve actually been performing quite well recently.
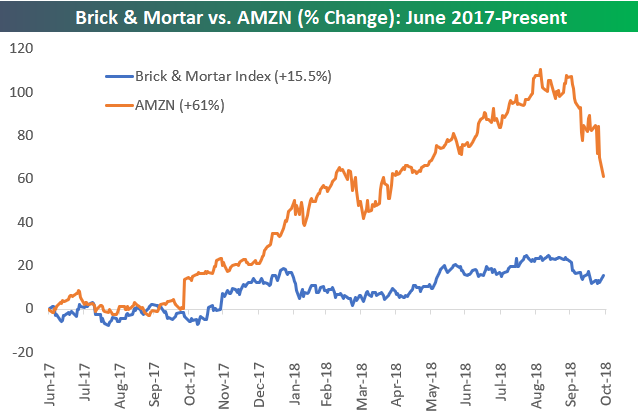
Chart of the Day: Semi Sell-Off Only Semi-Complete?
Bottom Line Fine, Top Line Decline
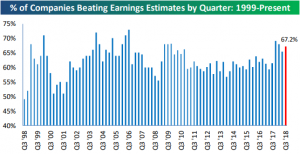
So far this earnings season, 67.2% of companies have beaten bottom-line consensus EPS estimates. As shown in the chart below, earnings beat rates are doing just fine relative to other quarters over the last few years.
While bottom line numbers aren’t raising any red flags this season, revenues certainly appear to have a problem. Only 56% of companies that have reported have beaten top-line revenue estimates. The drop from previous quarters is clear in the chart below. As it stands right now, this season is tracking to be the worst quarter for revenue beat rates since late 2016. There is still time for the revenue beat rate to turn around before mid-November when earnings season ends, but for a market grown accustomed to strong top and bottom line numbers, it is easy to see why investors have been selling early on this season.

As always you can check in on our Interactive Earnings Calendar to see all of the upcoming earnings reports over the next few months.
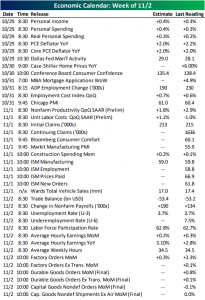
This Week’s Economic Indicators – 10/29/18
There were some significant economic data releases last week including Q3 GDP data, the latest Fed Beige Book, and two more Fed manufacturing activity indexes. The data missed forecasts at basically 2 to 1. There were 15 misses and only 7 beats.
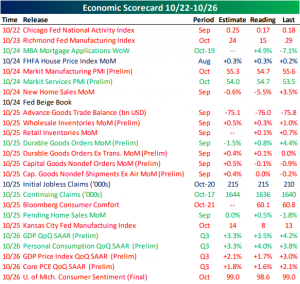
Coming up this week is a much busier slate. This morning personal consumption numbers will release followed by the last input of our Five Fed Manufacturing average with the Dallas Fed’s data. Tuesday will be a lighter day with just Case-Shiller Home Prices and Consumer Confidence. Wednesday is also on the quiet side. Things will pick up at the end of the week with 26 releases over the course of the first two days of November. The most important of these releases will be the Nonfarm Payrolls report on Friday which can swing the Fed into a more hawkish or dovish tone.
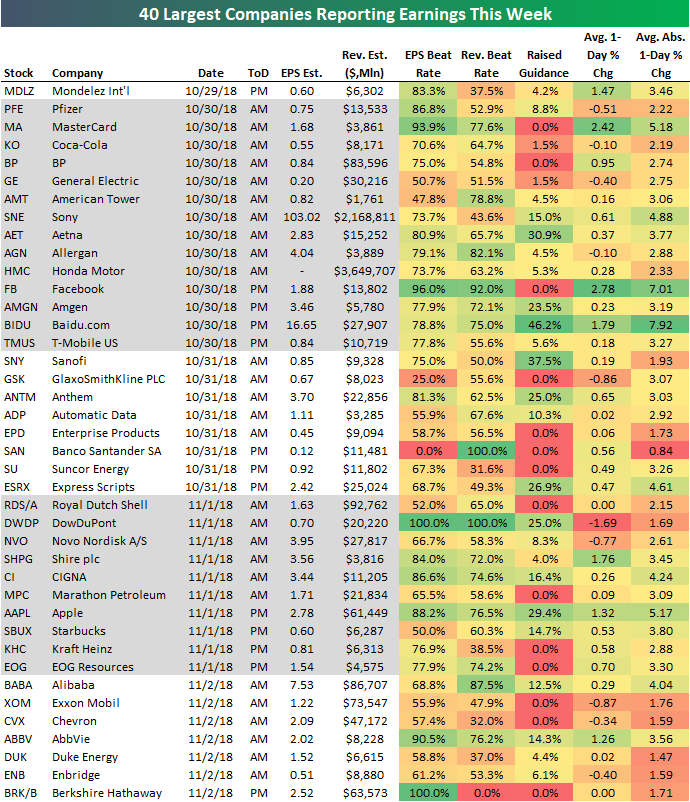
Most Important Earnings to Watch This Week
We’re smack dab in the middle of earnings season right now, and below is a list of the 40 largest companies set to report Q3 numbers this week. For each stock, we include a number of key data points that you won’t find in most earnings calendars. Data points like historical earnings and revenue beat rates, the percentage of the time that the company has raised guidance, and the stock’s average one-day price change in reaction to earnings are all included in the table after pulling them from our popular Earnings Screener tool.
After a slow Monday, we get a number of big reports on Tuesday from the likes of MasterCard (MA), Coca-Cola (KO), General Electric (GE), Facebook (FB), and Baidu (BIDU). Wednesday is relatively slow as well, but Thursday makes up for it with Apple’s (AAPL) release after the close. On Friday, we’ll hear from big oil companies Chevron (CVX) and Exxon Mobil (XOM) as well as the “Amazon of China” — Alibaba (BABA).
Of the stocks on the list, MasterCard (MA), Facebook (FB), and Apple (AAPL) have some of the strongest earnings and revenue beat rates, while Baidu (BIDU) has raised guidance the most. In terms of stock price reaction to earnings, Facebook (FB) and MasterCard (MA) show up again with average one-day gains of more than 2% when they have reported earnings throughout their history. Exxon (XOM), Chevron (CVX), General Electric (GE), and Pfizer (PFE) are four stocks that have historically averaged declines on their earnings reaction days.
Stay on top of everything earnings-related with a Bespoke Institutional membership. Start a two-week free trial to gain access now!