Bespoke CNBC Appearance (6/24)
Bespoke co-founder Paul Hickey appeared on CNBC Squawk Box on Monday (6/24) to discuss our outlook for Emerging markets. To view the segment, click on the image below. Start a two-week free trial to Bespoke Institutional to access our interactive tools and much more.

Citi Economic Surprise Indices: Eurozone Breaks Even
Global economic data has been quite a source of concern for policymakers on both sides of the Atlantic of late, with both the Fed and ECB opening the door to easing in part thanks to the weakness of global data. Ironically, recent Eurozone data has actually been less bad than recent history when measured by Citi’s Economic Surprise indices. Higher economic surprise index readings indicate data coming in stronger than forecast, while negative readings indicate misses. While both the US and global series have been near the bottom of the recent range, the Eurozone data surprise picture is more positive. While still just barely negative, the Eurozone index is at the best level since last summer. That stands in sharp contrast to the US and the global series, where data surprises are relatively low and trending lower. Start a two-week free trial to Bespoke Institutional to access our interactive tools and much more.
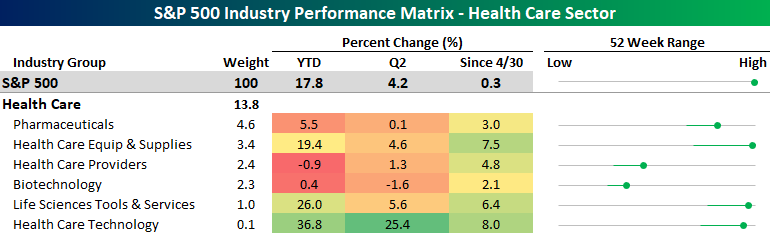
Chart of the Day: Gold Breakout Interest and Returns After Strong Months
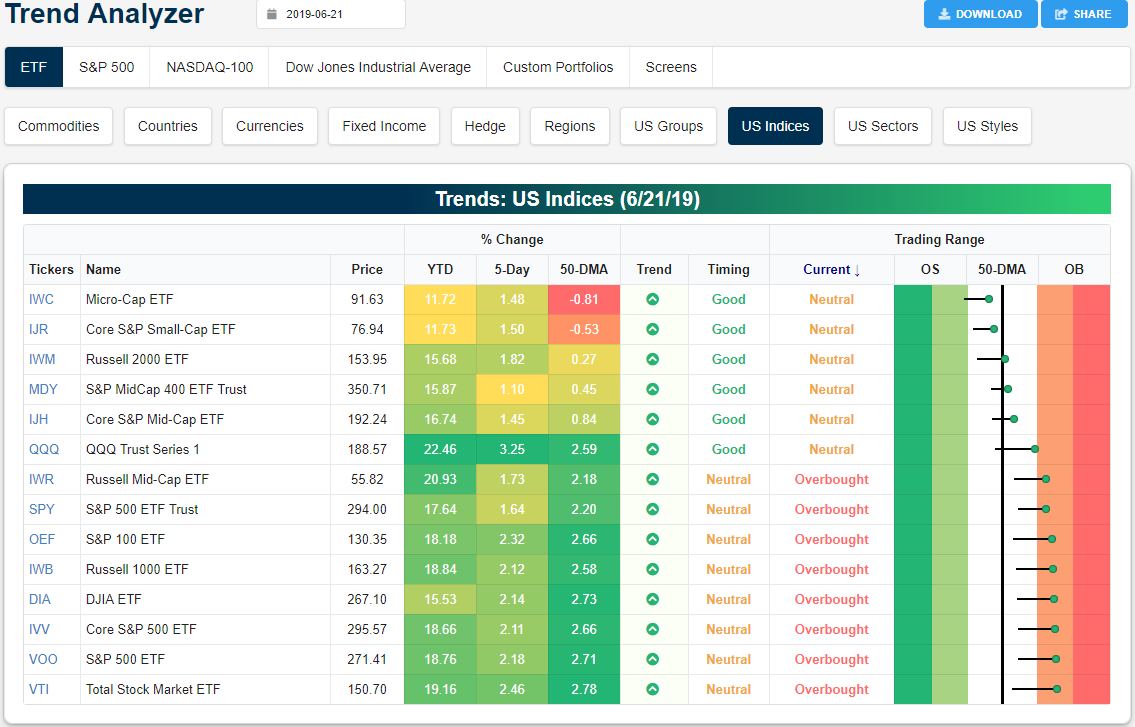
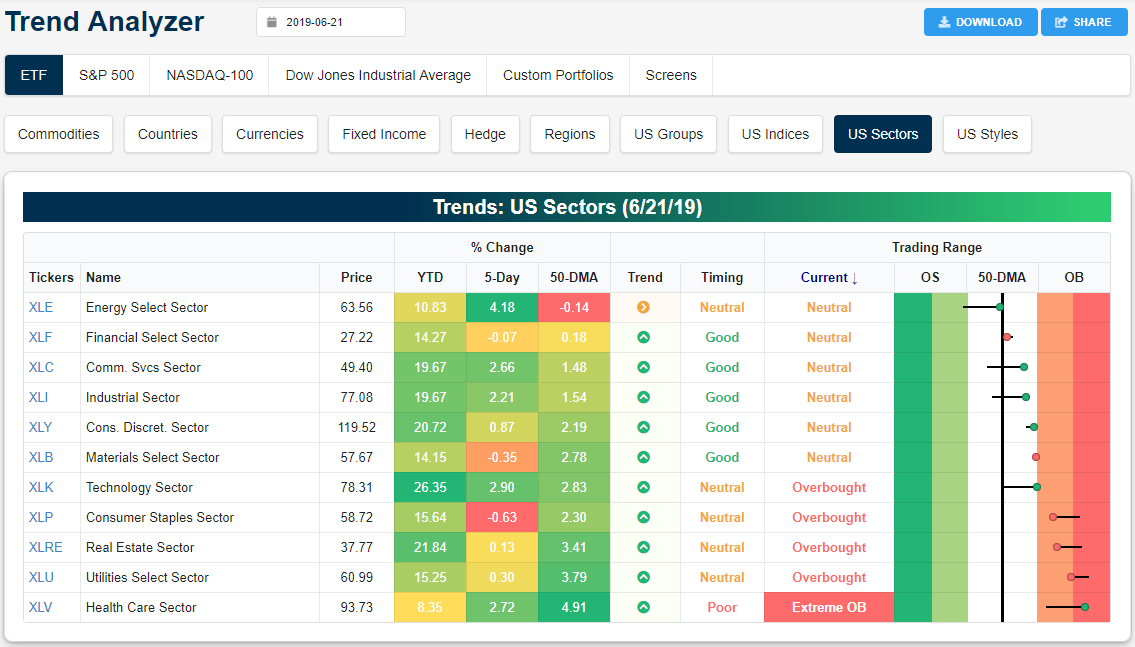
Trend Analyzer – 6/24/19 – Health Care Getting Extended
While the market pressed to new highs last week, conditions for large-cap index ETFs have become firmly overbought. Meanwhile, small and mid-cap major index ETFs lagged behind slightly. The Micro-Cap (IWC) and Core S&P Small Cap ETF (IJR) both remain neutral and currently sit below the 50-DMA. Another small-cap index, the Russell 2000 (IWM), saw slightly stronger performance than the aforementioned two and is just barely above its 50-DMA. Mid-caps are also neutral but sit more firmly above the 50-DMA, although the Russell Mid Cap (IWR) has moved into overbought levels. The Nasdaq (QQQ) was a bit of an outlier last week. In addition to considerably outperforming the other ETFs with a 3.25% gain over the past five days, it is also the only large-cap index to remain neutral after it was below the 50-day only one week ago. But these gains have now led the index to sit on the border of neutral/overbought.
Turning to the individual sector ETFs, Energy (XLE) went on a tear last week rising 4.18%. This lifted XLE off of oversold levels, and despite handily outperforming the other sectors, it still sits just below the 50-DMA. While there are five sectors that are currently overbought, Health Care (XLV) has actually reached extreme levels. While XLE and XLV have been ripping higher, defensives—Real Estate (XLRE), Utilities (XLU), and Consumer Staples (XLP)—have taken a breather after hitting extreme overbought levels last week. Start a two-week free trial to Bespoke Premium to access our Trend Analyzer tool and our unique equity market research.
Bespoke’s Morning Lineup – Two-Minute Warning
Please read today’s Morning Lineup to get caught up on everything you need to know ahead of the new trading week. Start a two-week free trial to Bespoke Premium for access.
Bespoke Morning Lineup – 6/24/19

Bespoke Brunch Reads: 6/23/19
Welcome to Bespoke Brunch Reads — a linkfest of the favorite things we read over the past week. The links are mostly market related, but there are some other interesting subjects covered as well. We hope you enjoy the food for thought as a supplement to the research we provide you during the week.
While you’re here, join Bespoke Premium for 3 months for just $95 with our 2019 Annual Outlook special offer.
Real Estate
Drug Cop Worth $400 Million After Bets on Brooklyn Real Estate by Sophie Alexander and Tom Maloney (Bloomberg)
Greg O’Connell has a heck of an eye. The former cop turned real estate investor spent decades buying up chunks of Red Hook, Brooklyn, and is now sitting on $400mm worth of property in the rapidly gentrifying area. [Link; soft paywall]
Want a House Like This? Prepare for a Bidding War With Investors by Ben Casselman and Conor Dougherty (NYT)
Following the crisis, a vast infrastructure sprung up to facilitate investor purchases of single family homes. Now, that infrastructure is pushing out traditional buyers, especially in neighborhoods that are gentrifying. [Link; soft paywall]
Investors Are Buying More of the U.S. Housing Market Than Ever Before by Laura Kusisto (WSJ)
The flip side of investor interest in housing is the fact that home flippers are upgrading properties, something homeowners may be either ill-equipped to do or unable to finance. [Link; paywall]
Sports
Rays to explore splitting games with Montreal by Jeff Passan (ESPN)
In a non-traditional move, the Tampa Bay franchise is exploring a split between Florida and Quebec. [Link; auto-playing video]
There’s No Good Reason To Believe What The Golden State Warriors’ Doctors Say by Gabe Fernandez (Deadspin)
An investigation into the ethical minefield that team doctors have to navigate, and often don’t even bother trying to think about, when they’re trying to diagnose players and get them back into the game. [Link]
Facebook posts better at predicting diabetes, mental health than demographic info (ScienceDaily)
A UPenn study found that language analysis of Facebook posts can predict psychological and medical conditions, in some cases much better than demographic information alone. [Link]
Bodies In Seats by Casey Newton (The Verge)
Facebook content moderation imposes a horrific cost on workers, with a vendor in Tampa, Florida a particularly egregious example: the office has seen an employee die at his desk, and other workers report psychic tolls from the ocean of violence and child exploitation, often resulting in PTSD. [Link]
Facebook announces Libra cryptocurrency: All you need to know by Josh Constine (TechCrunch)
An overview of the foray the world’s largest social network is taking into the world of blockchain with its participation in the Libra project. [Link]
Facebook’s Libra: blockchain, but without the blocks or chain by Jemima Kelly (FTAV)
A much more skeptical take on Libra, which is not a blockchain, is tied to existing currencies, is not decentralized, and has error-prone smart contracts. All very exciting, and par for the course when it comes to splashy crypto-related roll-outs. [Link; soft paywall]
Aging
Your Professional Decline Is Coming (Much) Sooner Than You Think by Arthur C. Brooks (The Atlantic)
An essay on the psychological burden of moving out of one’s prime, and how that burden can be alleviated. [Link]
State of States
Is West Virginia Constitutional? by Hilary Parkinson (National Archives)
The counter-secession of Appalachian Virginia during the Civil War is debatably legal, although given the extenuating circumstances some grey area is probably understandable. [Link]
Public Health
Meet the New York couple donating millions to the anti-vax movement by Lena H. Sun and Amy Brittain (WaPo)
The story of two wealthy Manhattanites who are the largest funders of vaccine skeptic movements which are helping the spread of diseases once entirely controlled by modern medicine. [Link; soft paywall]
Major study suggests Medicaid work requirements are hurting people without really helping anybody by Dylan Scott (Vox)
An early look at the effects of Arkansas requiring Medicaid recipients to work suggests that thousands of eligible people have been cast off the Medicaid roles despite the fact that they are either employed or qualify for some kind of exemption. Moreover, the uninsured rate has spiked without any observable benefit to employment rates; in fact, despite a 4 percentage point bump in the uninsured rate, employment rates for the group dropped by almost as much. The work requirements have been put on hold by federal court since, after a judge ruled the requirements in that state and Kentucky violated federal law. [Link]
Fed Mandate
The Fed Takes a Second Look at Its Good-News Story on American Jobs by Matthew Boesler (Bloomberg)
The Federal Reserve may be rethinking the way that it approaches its mandate, influenced by persistent shortfalls in labor share of income and a building openness to the idea that inflation pressures are in part determined by class conflict. [Link]
Gastrodiplomacy
The Surprising Reason that There Are So Many Thai Restaurants in America by Myles Karp (Vice)
While there are millions of Thai immigrants in the United States, they certainly seem to punch above their weight when it comes to availability of cuisine. That’s an intentional ploy on the part of the Thai government, with benefits for adventurous American pallets. [Link]
Gold
How 7.4 Tons of Venezuela’s Gold Landed in Africa—and Vanished by Gabriele Steinhauser and Nicholas Bariyo (WSJ)
Aided by a Russian charter flight and a Ugandan refinery, the Maduro regime has been flying gold to Africa and remain solvent. [Link; paywall]
Bubbles
The Greatest Asset Bubble of All Time by Nick Maggiulli (Of Dollars And Data)
An investigation into asset bubbles: new and old, large and small, with all the attendant drama and plenty of charts to go along with the text. [Link]
Español
Is this the birthplace of written Spanish? by Miriam Foley (BBC Travel)
Notes made in the margins of Latin text by monks in 6th-century Rioja help show the evolution of local vulgar Latin into the second-most spoken language in the world. [Link]
Hong Kong
How Hong Kong Got a Million Protesters Out on the Streets by Hannah Dormido, Chloe Whiteaker, Karen Leigh and Cedric Sam (Bloomberg)
A graphic story showing how millions of protestors flooded the streets in protests against a new extradition bill. [Link]
Read Bespoke’s most actionable market research by joining Bespoke Premium today! Get started here.
Have a great weekend!
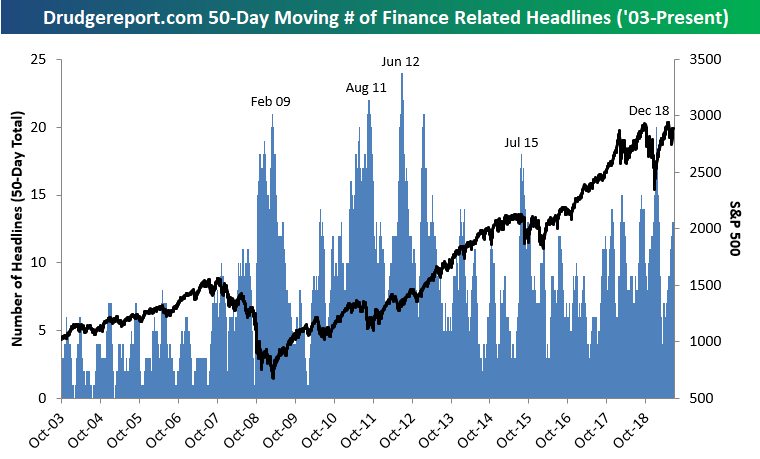
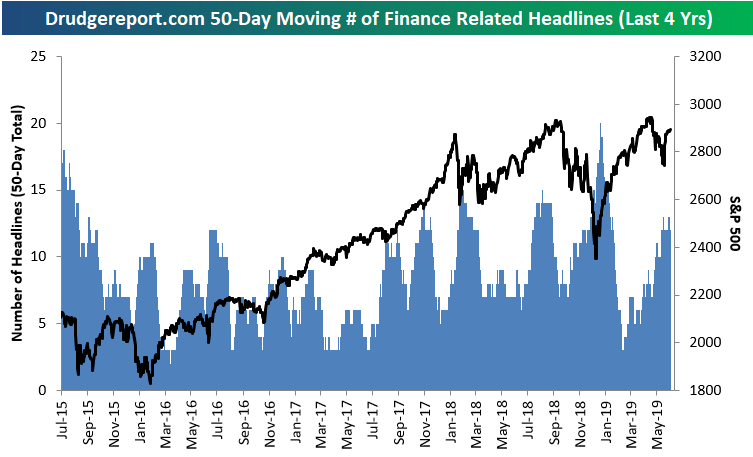
Drudge Headline Indicator Highs and Lows
The Drudge Report, with its 30,000,000 page views per day, is one of the most widely followed news sources on the web. News junkies visit the site on a regular basis to get their daily link fix, while those in the media world — from the major networks and newspapers to independent journalists — check it multiple times a day. While political stories receive the majority of the site’s links, it’s whatever the site’s founder Matt Drudge believes to be the most important topic of the day that gets the main headline at the top of the page.
The Drudge Report is not a financial news site, so whenever a financial news story grabs the Drudge headline, it means that the story has crossed over from just a financial news story to the mainstream. And when a financial news story crosses over into the mainstream media, it means that those that don’t follow the market on a regular basis are suddenly following the market. This usually occurs when the market (or economy, etc.) is going down and not up.
Because of its reach to the masses, we view financial headlines on Drudge as a contrarian indicator. When financial stories dominate the front-page headlines on a regular basis, we’re probably getting close to an inflection point for the The Drudge Report, with its 30,000,000 page views per day, is one of the most widely followed news sources on the web. News junkies visit the site on a regular basis to get their daily link fix, while those in the media world — from the major networks and newspapers to independent journalists — check it multiple times a day. While political stories receive the majority of the site’s links, it’s whatever the site’s founder Matt Drudge believes to be the most important topic of the day that gets the main headline at the top of the page.
The Drudge Report is not a financial news site, so whenever a financial news story grabs the Drudge headline, it means that the story has crossed over from just a financial news story to the mainstream. And when a financial news story crosses over into the mainstream media, it means that those that don’t follow the market on a regular basis are suddenly following the market. This usually occurs when the market (or economy, etc.) is going down and not up.
Because of its reach to the masses, we view financial headlines on Drudge as a contrarian indicator. When financial stories dominate the front-page headlines on a regular basis, we’re probably getting close to an inflection point for the market, whether it’s a bottom or a top. When a large number of negative financial headlines are showing up on Drudge on a regular basis, it suggests that excess negativity is probably priced into the market. Conversely, if a large number of financial headlines are showing up when the market is soaring, it suggests that good news is probably priced in.
In order to quantify this sentiment, we tracked every Drudge headline at 9 AM, noon and 4 PM on daily basis going back to 2003 and tallied the number of stories that were finance related using the Drudge Report’s massive archives service. We essentially wanted to see how often a financial news story was a front-page headline and not just confined to the Money section. (We counted any story that involved the economy or any asset class as a finance related headline.)
Below is a chart showing the number of days in which there was a finance related headline on Drudge over a rolling 50-day period since mid-2003. At our starting point, the market was in the early stages of the 2002-2007 bull market. Unsurprisingly, the number of finance related headlines hit its first peak right around the time that the market made its financial crisis lows in early 2009. The max reading of 21 days out of 50 with financial related headlines on Drudge came on February 27th, 2009, which was just 10 days before the S&P 500’s bear market low on March 9th. The number of financial headlines on Drudge then cratered all the way down to zero as the market and the economy recovered from the bear market, but then it started to pick up steadily once again in early 2010 as the crisis moved from our shores over to Europe.
During 2011’s version of the Euro Crisis and the US debt downgrade, the Drudge Headline Indicator maxed out at a new record high of 22 in mid-August, breaking the high seen during the depths of the US financial crisis. It made a new high again in June 2012 and then went through a multi-year lull as the S&P 500 surged in 2013 and 2014. We didn’t see a spike again until mid-2015 during the Greek debt crisis and the peak of the Chinese equity bubble that burst in the second half of 2015.
Following the mid-2015 spike, financial headlines on Drudge didn’t reach 20 over any 50-day period until this past December when the S&P 500 experienced a 19% correction (just barely missing the 20% decline threshold that would have marked a new bear market). As you can see in the charts, the recent peak for our Drudge reading occurred basically to the day that the correction low was made for the S&P 500 at the end of 2018. Since that market low, financial headlines on Drudge have been much more muted as the stock market has posted double-digit percentage gains through mid-year 2019 where we currently sit. At this point in time, our Drudge reading is neither excessively bearish or bullish, but it’s something we always like to keep a close eye on.
One final observation is that Drudge financial headlines were few and far between prior to the Financial Crisis in 2008 and 2009, but they have shown up much more frequently over the past ten years. The fact that we now see a much higher amount of financial headlines on what is mostly a political website represents a key shift in society, in our opinion, stemming from the collapse we saw in 2008. Everyday citizens now pay more attention to the economy and the markets than they did before, and sentiment on the topic is usually more negative than positive.
The Bespoke Report — An Easy Fed Gets the Bulls Out of Bed
This week’s Bespoke Report newsletter is now available for members. In this week’s report, we cover the Fed’s dovish tilt that was met with new all-time highs for the stock market.
We cover everything you need to know as an investor in our weekly newsletter. To read the Bespoke Report and access everything else Bespoke’s research platform has to offer, start a two-week free trial to one of our three membership levels. You won’t be disappointed!

The Closer: End of Week Charts — 6/21/19
Looking for deeper insight on global markets and economics? In tonight’s Closer sent to Bespoke clients, we recap weekly price action in major asset classes, update economic surprise index data for major economies, chart the weekly Commitment of Traders report from the CFTC, and provide our normal nightly update on ETF performance, volume and price movers, and the Bespoke Market Timing Model. We also take a look at the trend in various developed market FX markets.

The Closer is one of our most popular reports, and you can sign up for a free trial below to see it!
See tonight’s Closer by starting a two-week free trial to Bespoke Institutional now!
Broad Strength in Health Care Sector
In an earlier post, we highlighted the fact that some of the ten best performing S&P 500 Industries between the S&P 500’s highs on 4/30 and 6/20 were from the Health Care sector. It hasn’t just been these four industries that have been strong in the Health Care sector either. The performance snapshot of the sector below shows just how strong the sector has been lately. While all six of the industries within the sector aren’t up YTD or so far in Q2, between the S&P 500’s highs on 4/30 and 6/20, Health Care is the only sector where every industry within the sector has posted positive returns. Not even the industries within the Utilities sector have been this uniformly positive. The best performer of the bunch has been Health Care Technology, which is up 8% since the end of April and has extended its YTD gain to 36.8%. The worst performing industry in the sector has been Biotech which is up 2.1% since 4/30, and while that may not sound like much, it’s still better than more than half of the other industries in the index. Start a two-week free trial to Bespoke Institutional to access our interactive tools and much more.