Equity futures and commodities were weak heading into the 8:30 PPI report and picked up steam to the downside after a much stronger than expected PPI report for the month of October (0.6% vs 0.2%). In fact, it was the strongest report relative to expectations since the initial release of the January 2017 report last February.
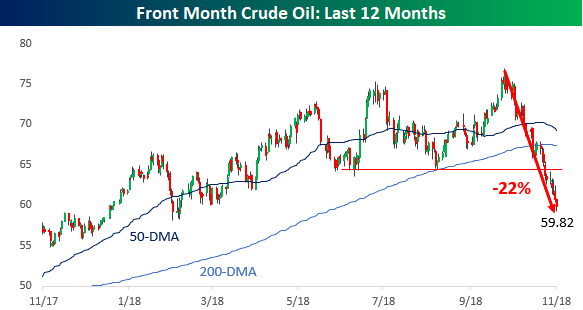
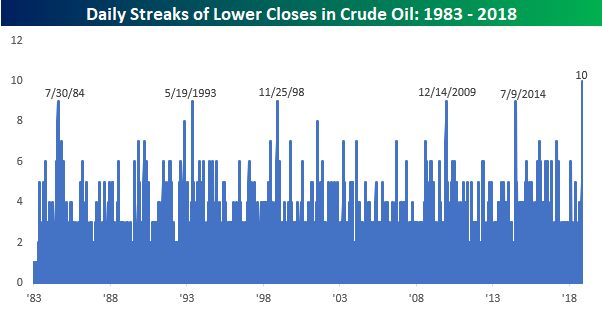
As mentioned above, WTI crude is trading below $60 today and headed deeper into bear market territory with a decline of 22% from the recent peak. As the chart below illustrates, it’s been practically a straight drop lower for crude oil. Recent trading, in fact, has been so one-sided that crude is on pace for its 10th straight day of declines. That’s the longest streak of consecutive declines, not in the last five, ten, or twenty years, but at least 35 years! Going back to 1983, there has never been a streak of more than 9 straight days where crude oil traded down on the day. While increased supplies are putting downward pressure on prices, is this the type of chart you see when the economy is overheating?
Start a two-week free trial to Bespoke Premium to see today’s full Morning Lineup report. You’ll receive it in your inbox each morning an hour before the open to get your trading day started.

