Bespoke’s Sector Snapshot — 7/5/19
The Bespoke 50 Top Growth Stocks
Every Thursday, Bespoke publishes its “Bespoke 50” list of top growth stocks in the Russell 3,000. Our “Bespoke 50” portfolio is made up of the 50 stocks that fit a proprietary growth screen that we created a number of years ago. Since inception in early 2012, the “Bespoke 50” has beaten the S&P 500 by 120.0 percentage points. Through today, the “Bespoke 50” is up 235.5% since inception versus the S&P 500’s gain of 115.6%. Always remember, though, that past performance is no guarantee of future returns. To view our “Bespoke 50” list of top growth stocks, please start a two-week free trial to either Bespoke Premium or Bespoke Institutional.
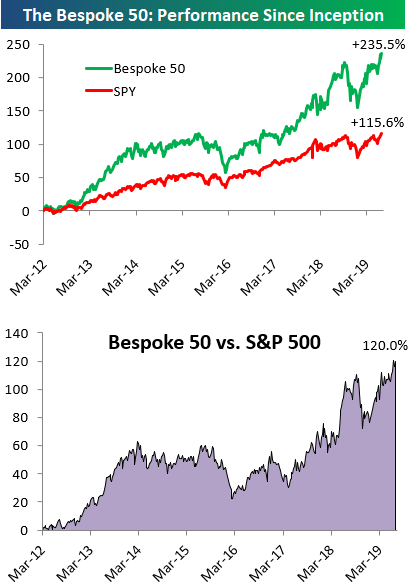
Chart of the Day: Strong Jobs Put Rate Cut Pricing Into Flux
Morning Lineup – Tap. Tap. Tap. Is this Thing On?
Trading desks are sparsely staffed this morning, and if you are reading this either at the office or on your way to work, we feel your pain. Questions we ponder on a day like today are why is the day before July 4th a shortened session, but the Friday after isn’t?
Anyways, the big June payrolls report is right on tap and should go a long way in letting us know if the futures markets have been correct in anticipating at least a 25 bps rate cut at the end of July.
In other news…it’s a summer Friday sandwiched between a holiday on one side and the weekend on another. There really isn’t much.
Read today’s Morning Lineup to get caught up on news and stock specific events ahead of the trading day and everything you may have missed since Wednesday’s close.
Bespoke Morning Lineup – 7/5/19

Believe it or not, today is only the 6th time in the last 45 years that July 5th has fallen on a Friday, but like today, each of the prior Friday, July 5ths also featured Non-Farm Payrolls (NFP) reports. In the two charts below, we have grouped the five prior events (1985, 1991, 1996, 2002, and 2013) based on whether the reported Non-Farm Payrolls reading that day was better or worse than expected.
Overall, market performance has generally been positive on these five days as the S&P 500 has seen an average gain of 0.65% with positive returns four out of five times, and on two of the five days, equities closed early on the day.
Out of the five NFP that fell on Friday, July 5th, three were weaker than expected. As shown in the first chart below, the S&P 500 finished the day higher on all three days with gains ranging from 0.2% all the way up to 3.67% on 7/5/02.

On the two days where NFP were better than expected, returns weren’t as positive. In 2013, the S&P 500 rose 1.02% when NFP came in ahead of forecasts, but in 1996, when the unemployment rate fell a surprising 0.3% percentage points and hourly wages saw their largest m/m percentage increase in 13 years, investors were spooked that the strength would lead to more hawkish rate policy from the FOMC. While a strong report of that magnitude is pretty much out of the question today, a significant beat relative to expectations is unlikely to be met with a positive reaction from the market.

Start a two-week free trial to Bespoke Premium to see today’s full Morning Lineup report. You’ll receive it in your inbox each morning an hour before the open to get your trading day started.
B.I.G. Tips – Chart Checkup
The Closer – Gapped Up To An Island – 7/3/19
Log-in here if you’re a member with access to the Closer.
Looking for deeper insight on markets? In tonight’s Closer sent to Bespoke Institutional clients, we take a look at what today’s surge into an island (low price above all other highs) means for stock prices going forward. We also discuss the ongoing surge in iron ore prices, record interest rate risk in corporate bond markets, today’s economic data, and how Q2 GDP is shaping up.

See today’s post-market Closer and everything else Bespoke publishes by starting a 14-day free trial to Bespoke Institutional today!
Chart of the Day: Avalara (AVLR) No Longer Sideways
Fixed Income Weekly – 7/3/19
Searching for ways to better understand the fixed income space or looking for actionable ideas in this asset class? Bespoke’s Fixed Income Weekly provides an update on rates and credit every Wednesday. We start off with a fresh piece of analysis driven by what’s in the headlines or driving the market in a given week. We then provide charts of how US Treasury futures and rates are trading, before moving on to a summary of recent fixed income ETF performance, short-term interest rates including money market funds, and a trade idea. We summarize changes and recent developments for a variety of yield curves (UST, bund, Eurodollar, US breakeven inflation and Bespoke’s Global Yield Curve) before finishing with a review of recent UST yield curve changes, spread changes for major credit products and international bonds, and 1 year return profiles for a cross section of the fixed income world.
In this week’s report we argue overseas investors are part of the reason for declining UST yields.

Our Fixed Income Weekly helps investors stay on top of fixed income markets and gain new perspective on the developments in interest rates. You can sign up for a Bespoke research trial below to see this week’s report and everything else Bespoke publishes free for the next two weeks!
Click here and start a 14-day free trial to Bespoke Institutional to see our newest Fixed Income Weekly now!
B.I.G. Tips – June Employment Report Preview
With just one day separating the July 4th holiday and the upcoming weekend, you probably figured that Friday would be a throwaway day. Not this time. With the market all but pricing in at least a 25 bps rate cut at the end of the month but many FOMC officials not on the same page (see Mester’s comments from Tuesday), Friday’s employment report will be even more important than normal. You can bet there will be a notable market reaction whether the report is good or bad!
Heading into Friday’s report, economists are expecting an increase in payrolls of 162K, which would be an improvement from May’s much weaker than expected reading of 75K. In the private sector, economists are expecting an increase of 153K, which represents a 63K increase from last month’s weaker reading of 90K. The unemployment rate is expected to remain unchanged at 3.6%. Average hourly earnings are expected to grow at a rate of 0.3% versus last month’s 0.2% reading. Finally, average weekly hours are expected to be unchanged at 34.4.

Ahead of the report, we just published our eleven-page preview of the June jobs report. This report contains a ton of analysis related to how the equity market has historically reacted to the monthly jobs report, as well as how secondary employment-related indicators we track looked in June. We also include a breakdown of how the initial reading for June typically comes in relative to expectations and how that ranks versus other months.
For anyone with more than a passing interest in how equities are impacted by economic data, this June employment report preview is a must-read. To see the report, sign up for a monthly Bespoke Premium membership now!
Claims Healthy Despite Weak ADP
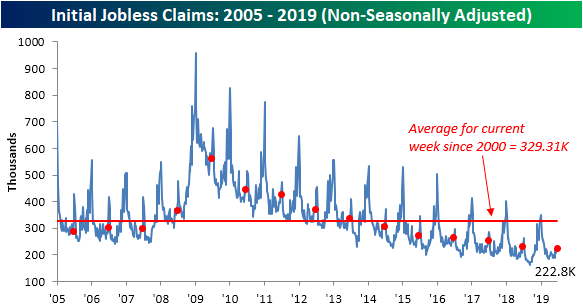
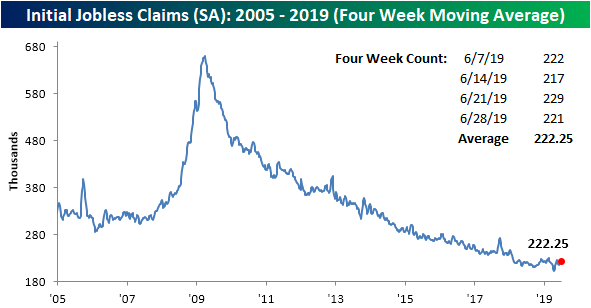
In what is a busy week of labor data, results so far have been mixed. Ahead of Friday’s Nonfarm Payroll Report for June, ADP payroll data released this morning missed forecasts of 140K, coming in at just 102K. While this set the stage for a potentially weaker NFP number on Friday, Initial Jobless Claims (released one day early due to the holiday) came in slightly stronger than forecasts and improved modestly from the previous week. While not making significant moves lower, claims continue to hold at healthy levels. Last week’s original print of 227K was revised up to 229K but this week saw an 8K drop to 221K. Claims were expected to fall to 223K. This stronger than expected print keeps the streaks going as claims have remained below 250K for a record 91 weeks and below 300K for a record 226 weeks.

The less volatile four-week moving average edged 0.5K higher to 222.25K this week. This is as an input of 219K from late May rolled off the average to be replaced by this week’s higher 221K. The moving average has stayed in the upper end of its range from the past several months and has not made any meaningful move lower since April.
Turning to the non-seasonally adjusted (NSA) data, while the current week of the year typically sees an uptick in claims, the NSA number actually fell from 225.8K to 222.8K this week. For the current week of the year, this was the first time that claims fell week over week on an NSA basis since 2013. Headed deeper into the dog days of summer, claims data historically begins to see some seasonal increases so this drop is less likely to be repeated in the coming weeks. Regardless, this week’s number was the lowest reading for the current week of the year of the current cycle for what was all in all a healthy release. Start a two-week free trial to Bespoke Institutional to access our interactive economic indicators monitor and much more.