The Bespoke Report – 10/11/19
This week’s Bespoke Report newsletter is now available for members.
Stocks bounced big late in the week after the details of the Employment Situation Report helped a bid in equities that started Thursday. Big drops in equity markets in response to ISM numbers early in the week were mostly clawed back. So which should matter more, the soft ISM surveys or the hard data on jobs? We give a definitive answer, as well as discussing a range of other economic and market details. To read the Bespoke Report and access everything else Bespoke’s research platform has to offer, start a two-week free trial to one of our three membership levels. You won’t be disappointed!

The Closer: End of Week Charts — 10/11/19
Looking for deeper insight on global markets and economics? In tonight’s Closer sent to Bespoke clients, we recap weekly price action in major asset classes, update economic surprise index data for major economies, chart the weekly Commitment of Traders report from the CFTC, and provide our normal nightly update on ETF performance, volume and price movers, and the Bespoke Market Timing Model. We also take a look at the trend in various developed market FX markets.

The Closer is one of our most popular reports, and you can sign up for a free trial below to see it!
See tonight’s Closer by starting a two-week free trial to Bespoke Institutional now!
The Most Volatile Stocks on Earnings
Looking for action? At the start of each earnings season, we publish our list of the most volatile stocks on earnings. Our Earnings Explorer tool contains a huge database that has every single quarterly earnings report for nearly all US-listed stocks going back to 2001. One part of the database tracks the one-day price reaction that stocks experience following their earnings reports, so users are able to easily track how individual stocks typically react to earnings.
In the table below, we show the stocks expected to report within the next month that have historically been the most volatile in reaction to earnings. To make the list, the company had to have at least 20 quarterly reports (5 years) and also have a current share price of $5 or more.
At the top of the list is Telecom equipment maker Infinera (INFN), which is scheduled to report on October 28th after the close. INFN just barely makes the cut because it trades at $5.20/share, but it has historically averaged a one-day absolute change of 15.16% on its historical earnings reaction days. You can expect a big move when it reports at the end of this month. Consumer review website YELP ranks as the second most volatile stock on earnings with an average one-day move of +/-14.85%. Enphase Energy (ENPH), LendingTree (TREE), and Applied Opto (AAOI) round out the top five with average one-day moves of more than +/-13% on their earnings reaction days. Other notables towards the top of the list include Wayfair (W), Netflix (NFLX), and Twitter (TWTR), which all typically move either up or down more than 12% on earnings.
Of the stocks on the list, Enphase (ENPH) is up by far the most in 2019 with a huge gain of 424%. Other stocks like Stamps.com (STMP), ANGI Homeservices (ANGI), and Green Dot (GDOT) are down more than 50% YTD. Twitter (TWTR), Blucora (BCOR), and Benefitfocus (BNFT) have the highest earnings beat rates at more than 90%. While it has a high beat rate, BNFT has been on a wild ride over the past two years, rallying from $24 up to $60 in 2018 before falling all the way back down to $24 as of today. You can bet a big move is in store when it reports on the 31st. If you haven’t tried it yet, we urge you to give our Earnings Explorer a test ride this earnings season! CLICK HERE to start a two-week free trial to Bespoke Institutional to gain access now!

If you’re just interested in large-cap names, below is a list of the most volatile S&P 500 stocks on earnings. These are stocks set to report over the next month, and as shown, Netflix (NFLX) is at the top of the list with an average one-day move of +/-12.78% on earnings. Twitter (TWTR), Align Tech (ALGN), TripAdvisor (TRIP), and Akamai (AKAM) rank 2nd through 5th in that order, while other notables include Amazon (AMZN), Advanced Micro (AMD), Chipotle (CMG), Facebook (FB), Electronic Arts (EA), and Wynn Resorts (WYNN).
If you own or have interest in owning any of these names, buckle up because they’re likely to experience a big move when they report at some point in the next few weeks!

Key Earnings Reports Over the Next Two Weeks
Our Earnings Calendar is part of our Earnings Explorer tool. The calendar shows the upcoming earnings report dates for US-listed companies over the next month, and investors use it as an easy way to monitor the names they’re most interested in. We provide quite a bit of information for each company listed in the calendar, including EPS and sales estimates, its historical beat rates, and its average share price performance on its earnings reaction day. If you ever want to know how a stock typically trades in reaction to its earnings report, this is the place to go.
The Q3 2019 earnings reporting period finally kicks off next week when most of the big banks are set to report. But the biggest weeks for earnings will come in the back half of October and the first couple weeks of November. As shown in the chart below, the week of October 28th through November 1st is the busiest of them all when we’ll see hundreds of companies report each day.

Below is a list pulled from our Earnings Calendar of the key earnings reports to watch next week (based on market cap). There are no key reports to speak of on Monday the 14th due to Columbus Day, but on Tuesday we’ll hear from Citigroup (C), Goldman (GS), JP Morgan (JPM), Wells Fargo (WFC), Johnson & Johnson (JNJ), and UnitedHealth (UNH) all before the open. On Wednesday, we’ll get results from Bank of America (BAC) in the morning and then IBM and Netflix (NFLX) after the close, while on Thursday we’ll hear from Morgan Stanley (MS), which will be the last of the major banks and brokers to report next week. American Express (AXP), Coca-Cola (KO), and Schlumberger (SLB) will finish off the week with reports on Friday morning.
Of the key stocks reporting next week, Goldman (GS), Johnson & Johnson (JNJ), and UnitedHealth (UNH) beat EPS estimates the most often at more than 90% of the time. In terms of price reactions, Intuitive Surgical (ISRG) — which reports on Thursday afternoon — has historically reacted the most positively to earnings with an average one-day gain of 3.24%. Bank of America (BAC) has the weakest price reaction to earnings with an average one-day drop of 0.95%.
In terms of earnings volatility, Netflix (NFLX) takes the cake with an average absolute one-day change of 12.78% on its earnings reaction day.

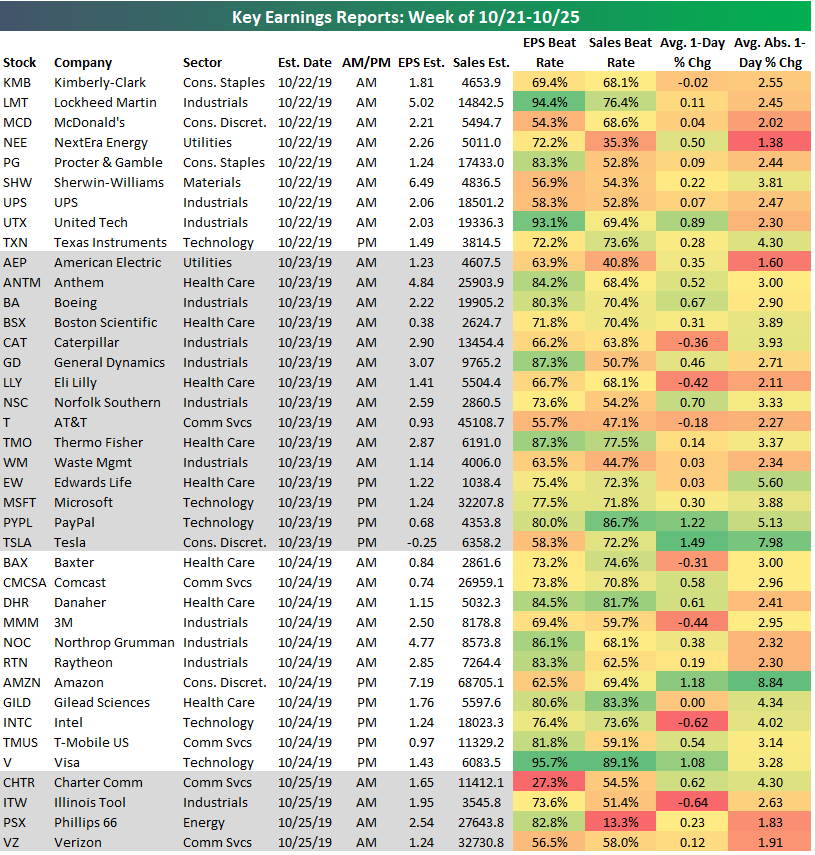
The following week (10/21-10/25) is when we’ll really be in the heart of the Q3 reporting period. A large number of Dow 30 stocks will report that week, including big blue chips like McDonald’s (MCD), United Tech (UTX), Procter & Gamble (PG), Boeing (BA), Caterpillar (CAT), Intel (INTC), and Microsoft (MSFT). The most important report of the week will come on Thursday the 24th when Amazon (AMZN) announces after the close. AMZN is currently expected to announce earnings of $7.19/share and revenues of $68.7 billion for the quarter. AMZN doesn’t have an abnormally high EPS beat rate at just 62.5%, but it is typically a very volatile name as its average one-day move on earnings has historically been nearly +/-10%. Just think, a 10% move for AMZN is a $174 swing in either direction based on its current share price.
We’ll certainly have more in-depth analysis of earnings reports in the days and weeks ahead, and you can get the most from our earnings work with a Bespoke Premium or Bespoke Institutional membership. CLICK HERE to start a two-week free trial today!
Next Week’s Economic Indicators – 10/11/19
It was a disappointing week for US economic data as two-thirds of releases came in weaker than expected or than the prior period. Consumer Credit data for the month of August was the only major release on Monday, exceeding expectations, but declining from July’s level. Inflation data took the spotlight this week with the release of PPI, CPI, and export and import prices. Core CPI was inline with the previous month and the import price index’s decline (year over year) was smaller than forecasted, but other readings on inflation were weaker. Likewise, labor data had its share of disappointments as the JOLTS report showed a third consecutive decline in openings, hourly earnings growth slowed, and continuing claims ticked higher. Initial Jobless Claims provided some relief though, coming in at 210K compared to 220K expected and 219K last week. While small business optimism was weaker—NFIB’s index fell to 101.8 from 103.1—consumer sentiment readings from Bloomberg and the University of Michigan both rose with the latter exceeding expectations.

Looking ahead to next week, the calendar is slightly busier with 22 releases on the docket in addition to earnings beginning to ramp up as a total of 115 companies report. There are no scheduled economic releases Monday due to Columbus Day, so next week’s data begins on Tuesday with Empire Manufacturing which is forecasted to fall from 2.0 to 0.5. Other manufacturing gauges, including the Philadelphia Fed’s index and industrial production, are also expected to fall. Retail Sales is scheduled for Wednesday and are expected to rise 0.3%. On Thursday, Housing Starts and Permit data are both expected to show moderation. The leading index is scheduled to round out the week on Friday. Start a two-week free trial to Bespoke Institutional to access our interactive economic indicators monitor and much more.
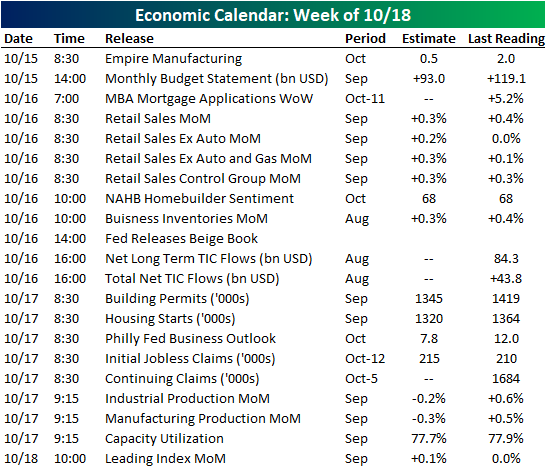
Chart of the Day: S&P 1%+ Higher Opens
Bespoke Morning Lineup – 10/11/19
See what’s driving market performance around the world in today’s Morning Lineup. Bespoke’s Morning Lineup is the best way to start your trading day. Read it now by starting a two-week free trial to Bespoke Premium. CLICK HERE to learn more and start your free trial.

Hitting the Seasonal Sweet Spot
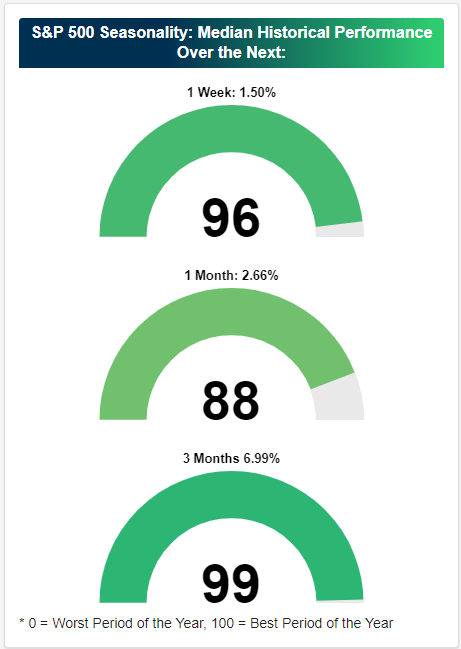
On Tuesday we highlighted that the S&P 500 was about to enter a more bullish period of the year from a seasonal perspective, and as the last few days have passed, the seasonal tailwinds have only gotten stronger. Bespoke Premium subscribers have access to our Stock Seasonality tool. When users visit the Seasonality tool, the first thing shown is the historical performance of the S&P 500 over the next week, month, and three months based on the last 10 years of trading. While seasonality is of course not a be-all, end-all investment strategy, we do think it’s helpful to use as one of many inputs.
As shown below, the S&P 500 has historically done extremely well in the weeks and months ahead based on the calendar year. Over the next week, the S&P has seen a median gain of 1.50%, which is better than 96% of all one-week periods of the calendar. Over the next month, the median gain for the S&P has been +2.66% (better than 88% of all one-month periods), while the next three months has seen a massive median gain of 6.99%. The next three months (October 11th through January 10th) on the calendar have seen the S&P perform better than 99% of all other three-month periods. Start a two-week free trial to Bespoke Premium to access our interactive investor tools and actionable research reports.
The Closer – Market Recap, Steepening Curve, CPI Summary – 10/10/19
Log-in here if you’re a member with access to the Closer.
Looking for deeper insight on markets? In tonight’s Closer sent to Bespoke Institutional clients, despite the strong performance across assets today, we make note of the brutal performance of the Russell 2000 as well as the ridesharing stocks. We then take a look at some factors in the steepening of yields including today’s 30 year bond reopening and the recent bill rally. We finish with a review of today’s CPI release.

See today’s post-market Closer and everything else Bespoke publishes by starting a 14-day free trial to Bespoke Institutional today!
IPOs – Where Good Money Goes to Die
For an equity market that has hit all-time highs on multiple occasions during this year, one would think that investors would be salivating over IPOs for a chance to ‘get in from the beginning’ and bidding them higher in the process. The reality, though, is that IPOs have been one of the more challenging areas of the market to make money. The first chart below shows the median performance of US-domiciled IPOs (not including special purpose vehicles) from their IPO price so far in 2019 based on the size of their offerings. For each offering range, the number inside of the bar indicates how many IPOs were in that offering range in terms of size. Investors have had an extremely difficult time stomaching big IPOs throughout 2019. Of the eight IPO offerings of $1 billion or more, the median return from the IPO offering price has been a decline of 6.6%. IPOs in this size range include SmileDirect Club (-51%), Lyft (-46%), and Uber (-35%). Not all of these big names have been big losers, though, as both Tradeweb and Pinterest are up over 30% from their IPO price.
While really big offerings have hit the market with a thud this year, more manageable offerings in the range of $100 million up to $1 billion are generally still trading above their offering prices. It isn’t until you get down to the very small, often lower-quality offerings where returns are negative again. As shown, of the 44 IPOs of less than $100 million, the median decline from the offering price has been a decline of 6.2%.

While performance hasn’t been horrible for investors who got in at the IPO price, for those investors who had to wait until the IPO started trading to get in, performance has been atrocious. By this measure, every size offering range is down by a median of at least 10% with offerings of greater than $1 billion down by over 19% and offerings between $500 million and $1 billion down just 10%.

Turning to individual issues, the tables below show the best and worst-performing IPOs relative to their IPO prices. On the downside, the ten worst performing IPOs are all down over 50% from their offering price. Thankfully, most of these IPOs were small non-household Health Care names that most investors probably didn’t get sucked into, but for those that did, it has been a rough road.

It hasn’t been all bad news for IPOs this year, though, as there have been some winners. The table below lists the ten best performing IPOs from their offering prices. Topping the list is fake meat company Beyond Meat (BTND) which has seen a gain of 471% from its IPO price in May. Other names that may be familiar to readers are Zoom Video (+104%) and Crowdstrike (+92%). While these IPOs have done very well, we would note that performance hasn’t been nearly as strong for investors who couldn’t get in at the IPO price. While the average gain of these ten names from the IPO price has been 136%, based on the performance where each stock first opened for trading, the average gain is half that at 68%. Start a two-week free trial to Bespoke Institutional to access all of our research and interactive tools.
