Morning Lineup – Notable Earnings Misses
There’s a negative tone to the futures market this morning after some notable earnings disappointments since yesterday’s close. First, Intel (INTC) reported after the close yesterday and issued disappointing guidance, sending shares down 8%. It’s not often that INTC trades down that much in reaction to earnings. Using our Earnings Explorer tool, we found only six other quarters since 2001 where the stock gapped down 8%+ on an earnings reaction day. INTC’s weakness is also casting a pall on the entire semiconductor sector, which had been leading the market. Another notable earnings miss to note is Exxon Mobil (XOM), which literally just reported weaker than expected earnings, missing the consensus EPS forecast of 69 cents by 14 cents and also reporting revenues shy of expectations.
While INTC and XOM were two notable misses, the overall tone of earnings since yesterday’s close has been pretty positive. Of the 125+ companies that have reported, 65% have exceeded EPS forecasts while 53% have managed to exceed revenue estimates. In terms of guidance, 8 companies raised forecasts going forward while only 5 lowered the bar.
We’ve just published today’s Morning Lineup featuring all the news and market indicators you need to know ahead of the trading day. To view the full Morning Lineup, start a two-week free trial to Bespoke Premium.

Each Thursday afternoon in our Sector Snapshot report, we provided up to date charts of S&P 500 sectors looking at each sector’s trading range, percentage of stocks above their 50-day moving average, ten-day A/D line, relative strength, and P/E ratio. In looking through the relative strength charts yesterday, one interesting trend that stood out was the relationship between the Health Care and Technology sector. Looking at the chart below, it’s pretty easy to see that just about all of the rotation out of the Health Care sector that began towards the end of last year went right into Technology.

Start a two-week free trial to Bespoke Premium to see today’s full Morning Lineup report. You’ll receive it in your inbox each morning an hour before the open to get your trading day started.
The Closer — Distributions, Argentina, Global Trade, Home Vacancy, Durable Goods — 4/25/19
Log-in here if you’re a member with access to the Closer.
Looking for deeper insight on markets? In tonight’s Closer sent to Bespoke Institutional clients, we discuss the distribution of EPS growth rates and forward multiples for S&P 500 stocks. We then delve deep into Argentina, which has seen asset prices decline including its Peso falling to new lows today while CDS spreads price in a high chance of long-term debt default; we provide some context to these declines. Moving onto economic data, monthly global trade volumes and industrial production released today once again showing weakness. In US data, we show quarterly homeownership and rental vacancy numbers and durable goods.

See today’s post-market Closer and everything else Bespoke publishes by starting a 14-day free trial to Bespoke Institutional today!
Neutral Sentiment Hits Multi-Year High
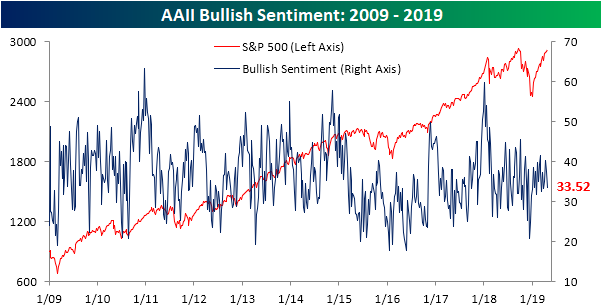
Since the Q4 2018 sell-off, bullish sentiment as seen through AAII’s weekly survey has remained relatively stable off of its lows established in December. For most of the year, it has remained in the 30’s briefly pushing above 40% a couple of times. This week it came in on the lower end of this range with 33.52% of investors reporting bullish sentiment, down from 37.56% last week. While this is at the lower end of the recent range, it by no means at any sort of extreme on a longer-term perspective. This is a bit of a divergence from sentiment seen through the Investor Intelligence survey, which recently saw bullish sentiment reach its highest levels since mid-October. Bearish sentiment readings in the same survey are at their lowest since the same time last year and more closely resembling the AAII survey. Start a two-week free trial to Bespoke Premium to access our interactive economic indicators monitor and much more.
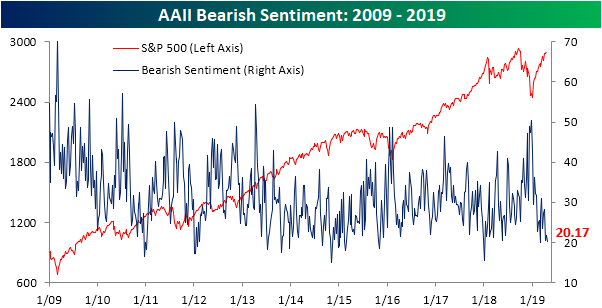
Expanding further on bearish sentiment, it remains very low as the market reached a new all-time high in the past week. Only 20.17% of investors responded as bearish this week. That is the second lowest reading of the year; the one lower occurrence being back in late February when it read 20%. Somewhat similar to bullish sentiment, this is well below the historic average for bearish sentiment (30.31%). But unlike bullish sentiment, the percentage of bears is currently sitting at a bit of an extreme; just over one standard deviation below that historic average.
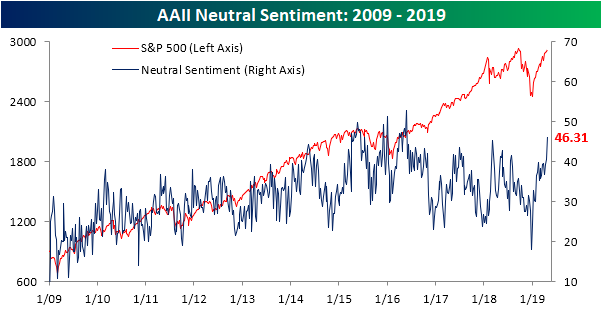
While bearish sentiment is right around lows again, neutral sentiment has continued to surge. 46.31% of investors are reporting to have a neutral sentiment towards the stock market; the highest level since May of 2016. This is the second week in a row that neutral sentiment also came in over one standard deviation above the long term average. Since the beginning of the survey in 1987, this is only the 13th time that neutral sentiment came in high by historical standards as bearish has simultaneously come in low by historical standards.
Fund Flows and Sentiment Levels
As we do in most Wednesday night Closers, last night we highlighted weekly ICI data on mutual fund flows in addition to ETF flows. Flows for domestic mutual fund flows have been extremely weak lately showing modestly bearish sentiment from retail traders. But as the major indices have approached new all-time highs, ETF investors have become more aggressive on the bullish side. ETF flows are showing the opposite of mutual fund flows, with inflows at the highest since the very start of 2019 across international and domestic funds combined and the strongest since early 2018 for domestic funds only. Altogether, investors are certainly buying into the rally though not by an extreme degree yet, as shown in the charts below. Start a two-week free trial to Bespoke Premium to access our interactive economic indicators monitor and much more.
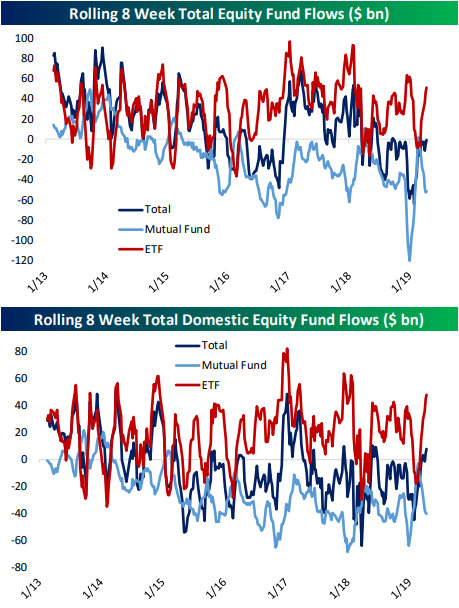
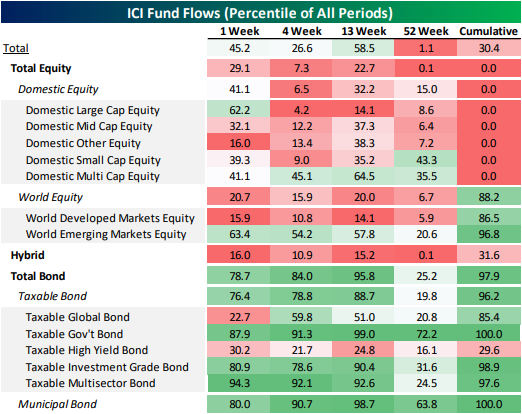
Overall, domestic non-institutional investors who are captured by fund flows like these appear to be pretty optimistic about the outlook. Domestic equity inflows were only this large right at the end of 2016 and 2018, immediately following the US election and presaging the volatility product blow-up at the end of 2018. In the tables below, we show mutual fund flows by type including the percentile of all periods and forward returns for similar scenarios. As shown, equity mutual funds inflows have been very weak while bond funds have seen massive inflows. Looking forward, when flows have seen similar readings the S&P 500 has a slight positive bias in the following month though there are some mixed results.
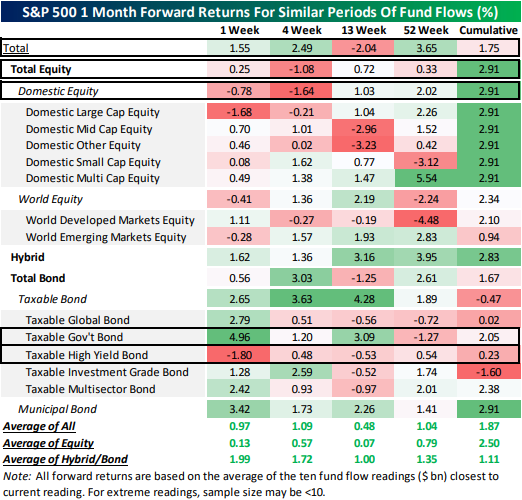
With mutual fund flows and ETF flows somewhat conflicting with a bit of a positive bias, tones out of other indicators are confirmed. As we mentioned in an earlier post, neutral sentiment (investors reporting no anticipated change over the next six months) as seen through the weekly AAII survey has been very elevated since the 2018 sell-off and typically has been the most popular opinion among investors in this time. At its current level, it is over one standard deviation above the historical average for neutral sentiment. At the same time, bearish sentiment has come in very low at just above 20%, which is just over one standard deviation below the historical average for the percentage of investors reporting as bearish. This was only the 13th time in the history of the data that both neutral and bearish sentiment have simultaneously come in with these sorts of extreme readings. Looking forward, just like with the fund flows, the S&P 500 has a bit of positive bias in performance—though the next week often sees declines—with an average gain of over 1.3% one month out. Overall, between fund flows and sentiment surveys, investors seem to be modestly bullish on the current rally.
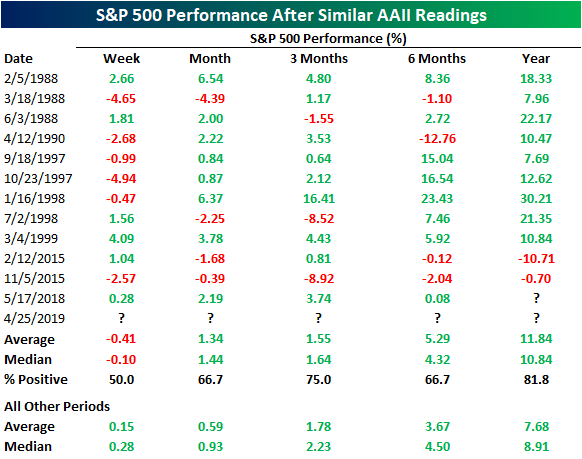
Chart of the Day: Dollar Rip Isn’t Hurting Internationals Yet
Big Miss From Jobless Claims
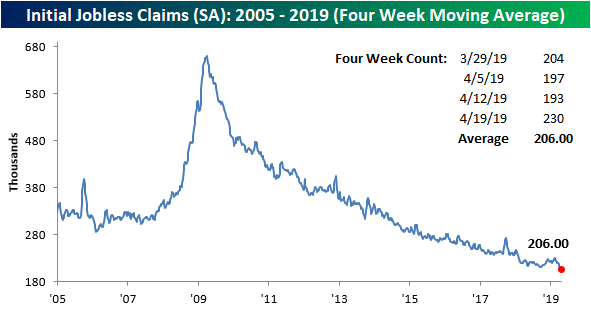
With jobless claims coming in at 50-year lows for the past few weeks, it is pretty surprising to see claims see a significant uptick to 230K this week, up by 37K from last week’s revised reading of 193K. That is the largest week over week increase in claims since September 1, 2017 when claims jumped by 61K. Using our Economic Indicator Database, we also found that this week’s print was the eleventh weakest relative to expectations since the recovery began in June 2009. This kind of jump shakes some of the optimism that the recent lows may have generated, but one week does not make a trend. Initial jobless claims are still at healthy levels with a streak of 67 weeks below 250K and 216 weeks below 300K. Start a two-week free trial to Bespoke Premium to access our interactive economic indicators monitor and much more.

For the four-week moving average, which is a less volatile look at the data, claims picked up slightly but are still right around recent lows. The four-week average is now reading 206K versus 201.5 last week—which was a 52 week low, the lowest level of the cycle, and the lowest since 1969. So again, while the uptick in the week over week numbers was significant, the moving average confirms that it is not any sort of major change in trend.
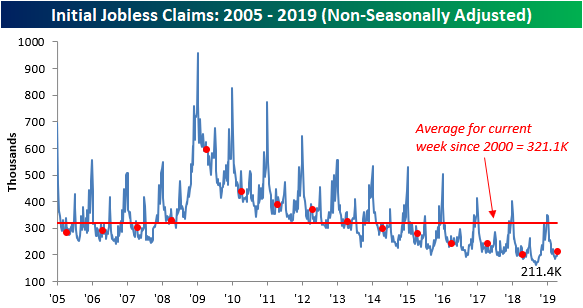
On a non-seasonally adjusted basis, claims rose up to 211.4K. That comes after two weeks straight of the NSA number remaining just above 196K. Over the past several years, the current week of the year has seen a mix of upticks and declines. The same week in 2017 actually saw a very similar movement (an increase of 15.7K) just slightly larger than this week’s 15K change.
MAGA Rolls
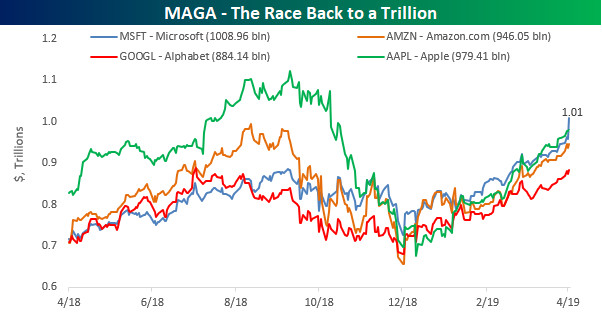
First, it was Apple (AAPL). Then Amazon.com (AMZN) briefly topped the threshold on an intraday basis. Now, it’s Microsoft’s turn. These days, all four of the largest US companies by market cap – the so-called MAGA stocks – are flirting with the trillion-dollar market cap level. With its blowout earnings report on Wednesday night, MSFT is trading up 5% in the pre-market to a record high, pushing the company’s market cap over the trillion dollar mark. Besides MSFT, AAPL and AMZN are both within 10% of getting back above the trillion dollar mark, and with AMZN set to report today (4/25) and AAPL on the docket next week (4/30), that level could come into play for both stocks provided they report strong numbers. The only four of the MAGA stocks trading more than 10% from the trillion level is Alphabet (GOOGL) with a market cap of ‘just’ $884 billion. For reference, behind these four stocks, the next largest company in the US is Facebook (FB), but with a market cap of under $600 billion even after last night’s EPS report, it remains far behind the top four.
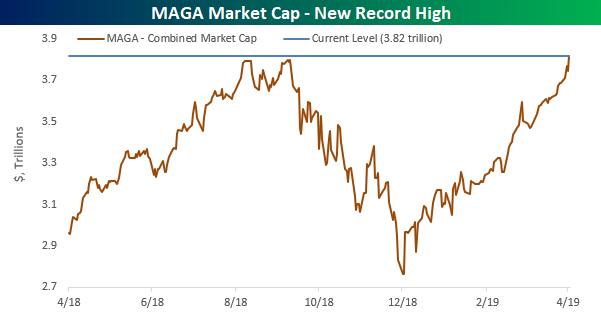
With three of the four MAGA stocks nearing the trillion-dollar level and GOOGL not far behind, these four stocks have become just plain gargantuan. At this morning’s prices, the four stocks have a combined market cap of $3.82 trillion – their highest ever. Start a two-week free trial to Bespoke Institutional to unlock our extremely useful Earnings Explorer tool to stay on top of the latest earnings trends from the MAGA stocks and everyone else!
Morning Lineup – Hamptons Houses Piling Up
100 companies have reported earnings so far this morning, in what is the busiest day of earnings for the reporting period. This also comes on the heels of a busy after-hours session on Wednesday where Microsoft surged and saw its market cap exceed $1 trillion. Facebook (FB) also reported a strong quarter pushing that stock close to $200 per share. This morning, the mood is not as positive as a big earnings miss from 3M (MMM) has that stock trading down over 8% and taking the DJIA futures down with it. In economic data, South Korea reported a surprise contraction in GDP overnight (weakest in ten years).
We’ve just published today’s Morning Lineup featuring all the news and market indicators you need to know ahead of the trading day. To view the full Morning Lineup, start a two-week free trial to Bespoke Premium.
If you are looking for a real-world example of how tax policy can impact the economy, look no further than the Hamptons area of Long Island. With last year’s GOP tax overhaul capping deductions for mortgage interest and property taxes, sales of second homes have been hit hard. According to a Bloomberg article this morning, the number of Hamptons luxury houses with “For Sale” signs in front of them swelled to 869 at the end of the first quarter. That’s nearly triple the number that were listed for sale at the same time last year and is the highest level in at least seven years. While inventories of luxury homes in the Hamptons are ballooning, sales are falling off a cliff as Q1 sales in the region were the lowest for the first three months of the year in at least seven years!
Based on the trends of rising inventories and slowing sales, the article goes on to say that at the current pace it would take 7.5 years to sell the available inventory of luxury homes- another record. The article went on to quote the President of one firm as saying that the market is in a period of ‘transition’. That would be putting it mildly!

Start a two-week free trial to Bespoke Premium to see today’s full Morning Lineup report. You’ll receive it in your inbox each morning an hour before the open to get your trading day started.
The Closer — Earnings Update, Dollar Pop, Fund Flows — 4/24/19
Log-in here if you’re a member with access to the Closer.
Looking for deeper insight on markets? In tonight’s Closer sent to Bespoke Institutional clients, after a busy day of earnings, we provide an update on beat rates so far this earnings season. We also look at small caps beginning to pick up relative to small caps as the dollar gained strength. Next, we provide our weekly update to fund flows, including a look at flows for mutual funds versus ETFs. We finish tonight’s Closer a recap of this week’s EIA petroleum data.
See today’s post-market Closer and everything else Bespoke publishes by starting a 14-day free trial to Bespoke Institutional today!
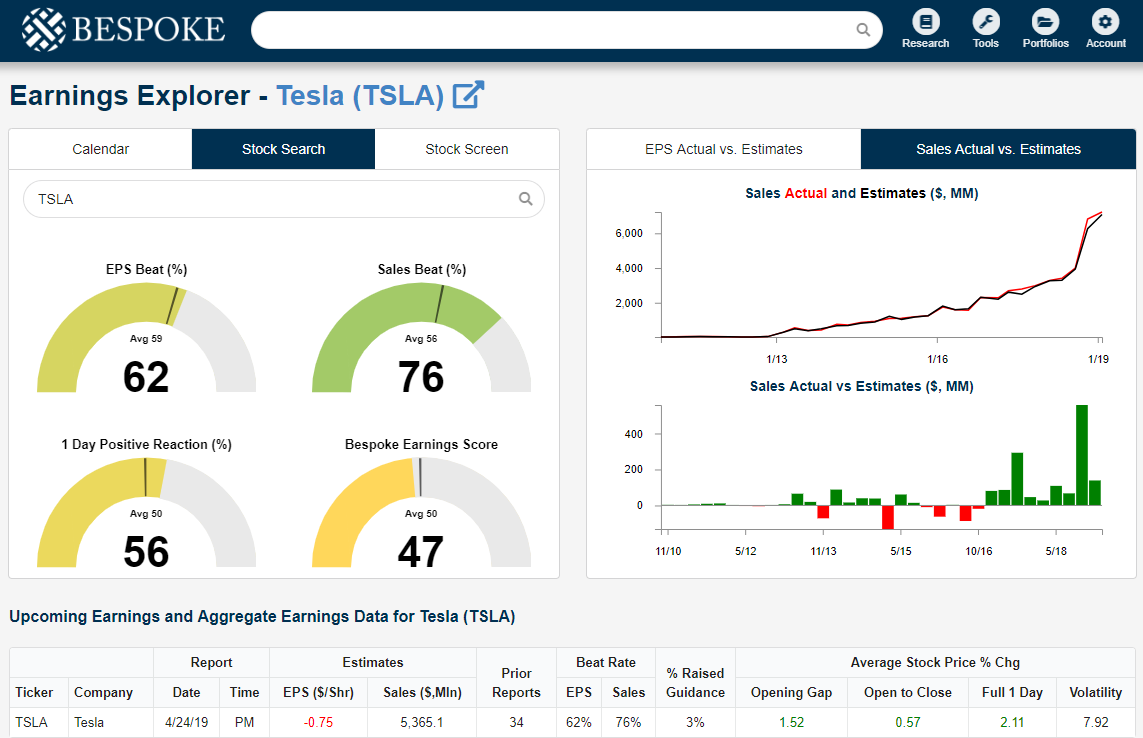
Tesla (TSLA) Earnings After the Close
Below is a snapshot of Tesla (TSLA) in our Earnings Explorer tool that’s available to Bespoke Institutional members. With the company set to report numbers after the close today, we show that TSLA has historically beaten consensus EPS estimates 62% of the time, while it has beaten top-line sales estimates 76% of the time. The chart for TSLA sales since 2010 is pretty much straight up with a huge surge over the last two quarters after the carmaker’s Model 3 went live.
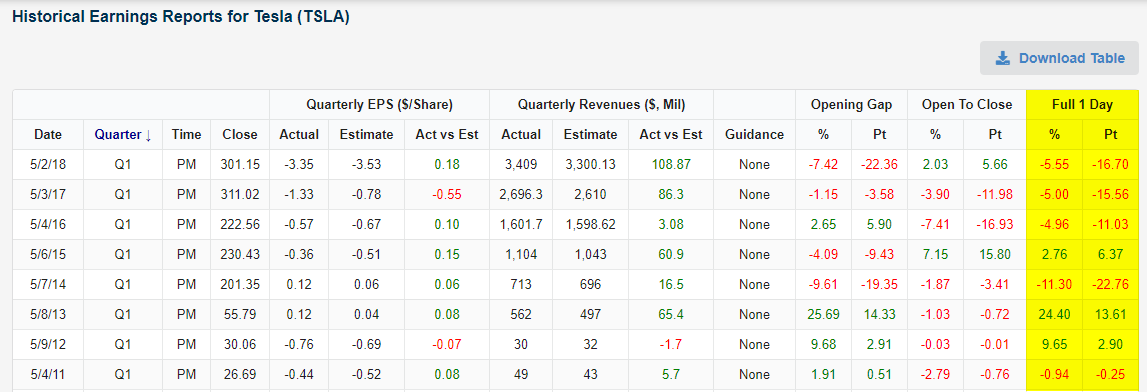
Below is a snapshot of Tesla’s individual quarterly reports over the years. (Subscribers have access to results that go back to 2010 when TSLA IPOd.) While EPS beats have been hit or miss over the past few years, TSLA has beaten sales estimates for nine consecutive quarters. Even still, the stock has only reacted positively to six of its last nine reports. A miss on sales when TSLA reports tonight will likely not be treated kindly by investors.

If we narrow things down to just Tesla’s Q1 earnings reports, we can see that the stock has fallen roughly 5% on each of its last three Q1 reports going back to 2016. TSLA longs would certainly love for the stock to experience a move like it did on its Q1 2013 report. On May 9th, 2013, the stock gained 24.4% in a single day in reaction to an EPS and sales beat.
Start a two-week free trial to Bespoke Institutional to unlock our extremely useful Earnings Explorer tool!