Chart of the Day: Delta (DAL) and Other Air Lines Soar on Earnings
B.I.G. Tips – Next Stop – Earnings Season!
Investors are preoccupied with trade issues and impeachment headlines this week, but earnings season is coming up right around the corner. Whether the earnings headlines provide a welcome break from all the back and forth between the US and China or Republicans and Democrats remains to be seen, but at least it will be a change of pace.
Once again this month, the key trend to watch this earnings season will be how often the term ‘China’ or ‘tariffs’ comes up in quarterly conference calls. Just this morning, the NFIB reported in its Small Business Sentiment report that “Tariffs are adversely affecting many small firms, with 30% reporting negative effects in NFIB’s September survey.”
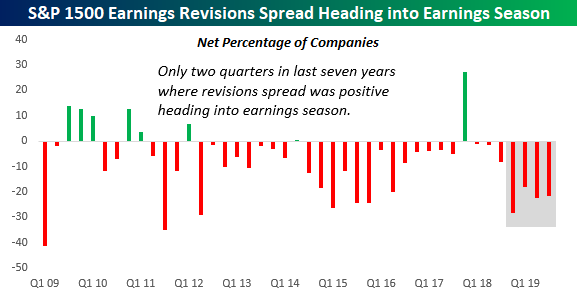
Based on the commentary, current trade policies are obviously making their presence felt. The only question is how much is priced in? Based on recent trends in analyst revisions, analysts have adjusted their forecasts by a decent amount. Over the last four weeks, analyst revisions have come in at a pace of two to one in favor of downside revisions. Analysts have raised EPS forecasts for just 312 companies in the S&P 1500 and lowered EPS forecasts for 634, which works out to a net of negative 322 or 21.5% of the stocks in the index. As shown in the chart below, this continues a trend that we have seen for four quarters now, where analysts have been consistently lowering forecasts in response to the impact of tariffs and other uncertainty related to trade.
We have just published our quarterly preview of the upcoming earnings season and what to expect in terms of the overall market and sector performance based on trends in analyst revisions. To gain access to the full report, start a two-week free trial to our Bespoke Premium package now. Here’s a breakdown of the products you’ll receive.
Bespoke Morning Lineup — 10/8/19
See what’s driving market performance around the world in today’s Morning Lineup. Bespoke’s Morning Lineup is the best way to start your trading day. Read it now by starting a two-week free trial to Bespoke Premium. CLICK HERE to learn more and start your free trial.

The Closer – Sector Performance, FX In 2019, Consumer Credit – 10/7/19
Log-in here if you’re a member with access to the Closer.
Looking for deeper insight on markets? In tonight’s Closer sent to Bespoke Institutional clients, we take a look at the relative performance of various parts of the market including industrials, homebuilders, and semiconductors. We then review how emerging market FX has performed in 2019. We finish with a bit of macroeconomic data including credit data and railroad volumes.

See today’s post-market Closer and everything else Bespoke publishes by starting a 14-day free trial to Bespoke Institutional today!
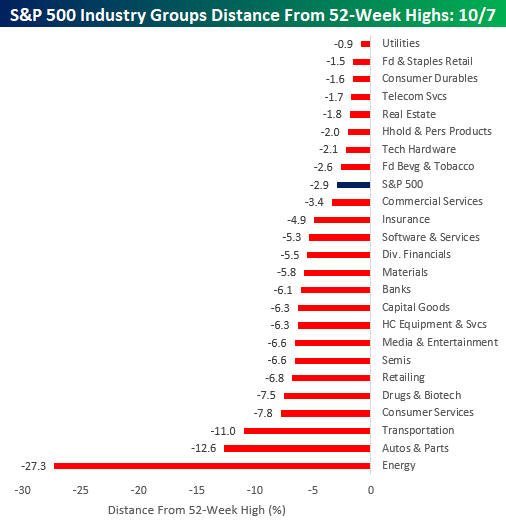
Industry Groups Distance From 52-Week Highs: Defensives on the Offensive
The S&P 500 ended up closing down about 0.50% today but still remains within 3% of its record high in July. The chart below shows where each of the S&P 500’s Industry Groups are trading with respect to their own 52-week highs. While the S&P 500 is less than 3% from its high, the majority of Industry Groups are down at least 5% from their own highs. Leading the way to the downside, Energy has been the clear loser with a decline of 27.3%. Behind Energy, just two other groups (Transportation and Autos & Parts) — which are both cyclical in nature — are down over 10%. In terms of Industry Groups that have held up the best, they are mostly defensive in nature with Utilities, Food & Staples Retail, Consumer Durables, Telecom Services, and Real Estate all trading within 2% of their respective highs. Start a two-week free trial to Bespoke Institutional to access all of our research and our popular interactive Chart Scanner and Trend Analyzer tools.
Apple (AAPL) Back in the “Trillion Dollar” Club, Closing In on Microsoft (MSFT)
After falling nearly 40% from its high point to its low point in the fourth quarter of 2018, Apple (AAPL) has come roaring back in 2019. Earlier today the stock got within one percent of making a new all-time closing high. You can see the action in the five-year chart for Apple below. (Click here to view an interactive chart of AAPL.) Start a two-week free trial to Bespoke Institutional to access all of our research and our popular interactive Chart Scanner and Trend Analyzer tools.

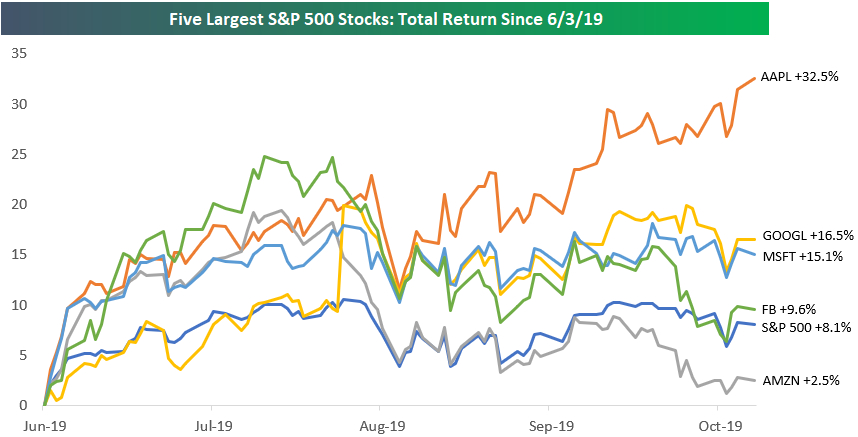
Apple (AAPL) has been the big winner of the mega caps over the last few months. Below is a chart showing the total return of the five largest S&P 500 stocks since the S&P made its most recent closing low on June 3rd. As shown, Apple has gained 32.5%, which is more than double the next biggest winner — Alphabet (GOOGL) at +16.5%. Microsoft (MSFT) is up 15.1%, while Facebook (FB) is up 9.6% and Amazon (AMZN) is up just 2.5%.
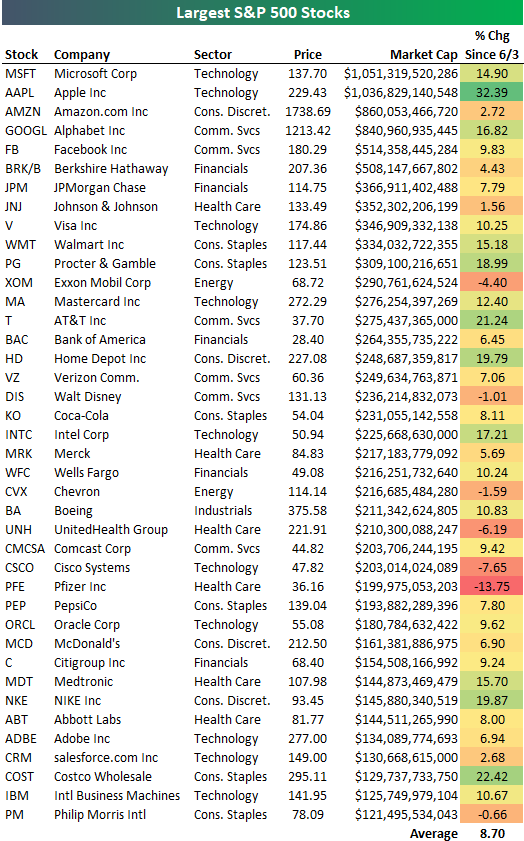
Apple’s (AAPL) recent gains have put the company back in the “trillion dollar market cap” club as well. Right now the club only has two members — MSFT and AAPL. While Microsoft (MSFT) still holds the title of “World’s Largest Company,” Apple is now hot on its heels.
Amazon (AMZN), Alphabet (GOOGL), Facebook (FB) and Berkshire (BRK/B) are the only other companies with market caps above $500 million, and then you have JP Morgan (JPM), Johnson & Johnson (JNJ), Visa (V), and Walmart (WMT) rounding out the top ten.
Dividend Stock Spotlight: Paychex (PAYX)
Stocks got a shot in the arm at the end of last week thanks to the Nonfarm Payrolls report. As we discussed in Friday’s Bespoke Report, although the headline number missed expectations, the report’s data showed strength in other labor market metrics such as the employment-population ratio and wage growth. With its business closely tied to the labor market as a payroll and HR solutions provider, the second-largest payroll accounting firm behind only Automatic Data Processing (ADP), Paychex (PAYX) outperformed on the day with a 2.17% rally. More significantly, this rally helped to lift PAYX out of a downtrend that has been in place since June. It was also the first time that the stock closed in overbought territory (at least one standard deviation above its 50-day moving average) since June.
In addition to the more positive technical set-up, PAYX has an attractive dividend that currently yields 2.98%. That is a much larger yield than other stocks in the Software and Services industry group, averaging 1.7%, and the broader S&P 500. The yield for PAYX’s closest comp, Automatic Data Processing (ADP), is nearly a full percentage point lower at 1.99%. Though they have much smaller market caps, other comparables including Paycom Software (PAYC) and Paylocity (PCTY) do not pay a dividend. In terms of security, PAYX has a long history of paying a dividend going back to 1988 and has paid shareholders for each quarter consecutively over the past five years. The dividend has grown 63% (from $0.38 in 2014 to $0.62 last quarter) in this time. The first two quarters of 2013 did not see a dividend declared but this was the only time this happened in the past three decades. The payout ratio is currently 84.15%, which is somewhat high but in line with the average for the ratio over the past ten years. The next payout is expected to be declared on October 10th at $0.62 per share.

Moving back to technicals, below are price charts of PAYX’s competitors. While PAYX managed to break its downtrend on Friday, none of these did and they’re still well off their recent highs. Start a two-week free trial to Bespoke Institutional to access all of our research including our interactive tools.

Chart of the Day: Is the Smart Money Buying or Selling?
Today’s Chart of the Day is now available for members.
One of the many breadth measures we monitor is the intraday performance of the S&P 500. We can do this by creating an intraday composite chart of the S&P over any time period. Basically this shows the average path that the S&P has taken throughout the trading day over various time frames. The “smart money indicator” suggests that the more thought out institutional money trades at the end of the trading day, while the more reactionary ‘dumb’ money trades at the open. Thus, late-day rallies are weighted positively by the smart money indicator while early morning rallies are weighted negatively. Conversely, early morning weakness is not a negative with the smart money indicator but late-day weakness is.
The S&P is down 2.5% from its July 26th closing high, but the smart money indicator has really been moving over this time period. We highlight the big move in today’s Chart of the Day. To read this report and access everything else Bespoke’s research platform has to offer, start a two-week free trial to Bespoke Premium. You won’t be disappointed!

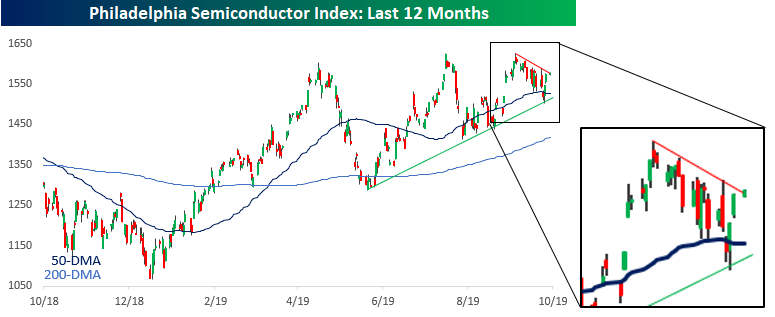
Semis Em-Bull-dened
For much of the last several years, semiconductors have been a leading group of the broader market to both the upside and downside. Therefore, it shouldn’t come as too much of a surprise that the S&P 500 has rallied off its earlier lows after the semis opened the day right around the unchanged level and have rallied from there. The chart of the Philadelphia Semiconductor Index (SOX) over the last year also bodes well for the overall equity market. Since its late May lows, the SOX has carved out a solid uptrend line with a series of higher lows, and while you have to squint closely, it has also made two higher highs relative to its high in April. Also, just today the group is looking like it is close to breaking its short-term downtrend that has been in place since the most recent marginal new high in early September. If that short-term downtrend breaks, the rally in the broader market will likely continue to have legs. Start a two-week free trial to Bespoke Institutional to access all of our research and our popular interactive Chart Scanner and Trend Analyzer tools.
Bespoke’s Morning Lineup – 10/7/19
See what’s driving market performance around the world in today’s Morning Lineup. Bespoke’s Morning Lineup is the best way to start your trading day. Read it now by starting a two-week free trial to Bespoke Premium. CLICK HERE to learn more and start your free trial.