Sentiment Turned Around
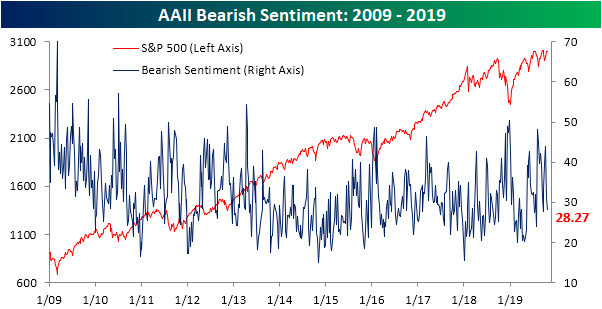
Hard to believe that only two weeks ago, AAII’s reading on market optimism fell to its lowest reading since May of 2016. Since that bottom, bullish sentiment has rebounded to 35.6%. While still below the historical average of 38.08%, the percentage of bullish investors is now at its highest level since the first week of August when it was 38.4%.

Likewise, market pessimism has fallen considerably since its recent peak of 43.96% from October 10th. Now at 28.27%, the percentage reporting as bearish is at its lowest since September 19th. Bearish sentiment is also back below its historical average for the first time since that same week.
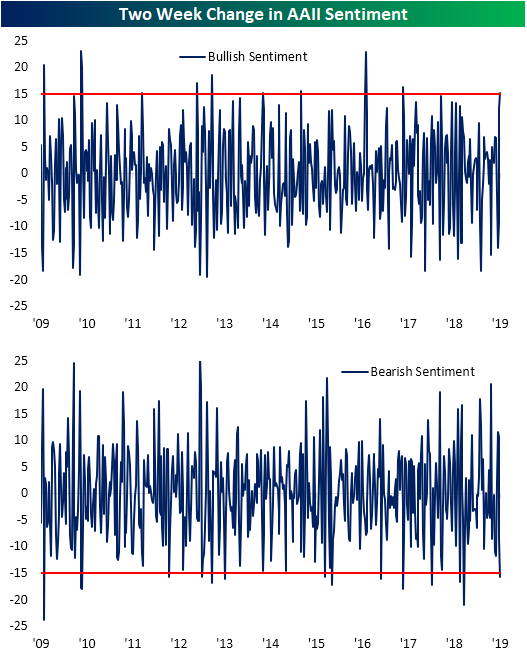
As shown in the charts below, it is not a common occurrence for either bullish or bearish sentiment to rise and fall, respectively, more than 15 percentage points in the span of just two weeks. For bearish sentiment, this was the 60th time that such a move has happened since the start of the survey with this week marking the largest two-week decline since January of this year as the market worked off of its 2018 lows. That time actually saw a larger decline of 20.93 percentage points compared to 15.69 today.
For bullish sentiment, these types of moves have actually been more common with 78 other occurrences throughout history. In spite of this, it has been much longer since the last time such a move has been observed with the last time this happened being a 16.29 percentage point rise in September of 2017. This was also the last time that both bullish and bearish sentiment simultaneously moved over 15 percentage points in two weeks.
In terms of how the market performs following such sentiment changes, the picture is mixed. The median performance of the S&P 500 has seen outperformance following similar instances one month, six months, and one year later, but underperformance over the next week and 3 months. Across each of the past 31 occurrences, the S&P 500 has been higher more than half the time with the most consistent positive performance being one month and one year later; 71% and 74.2% of the time, respectively. The other periods have been positive about 60% of the time. Start a two-week free trial to Bespoke Institutional to access our interactive economic indicators monitor and much more.

Chart of the Day: New Highs For European Stocks
Initial Jobless Claims Back Down
After last week’s reading was revised higher, this week’s reading on jobless claims saw a decline from 218K down to 212K compared to forecasts of 215K. With this reading, jobless claims remain at healthy levels and are well within the range of the past several months. Claims have now spent 241 consecutive weeks at or below 300K and 106 weeks at or below 250K. Both are record streaks.

Turning to the four-week moving average which helps to smooth out some of the week to week fluctuations, a higher print of 215K from September has rolled off of the average to be replaced by this week’s 212K. That has brought the moving average down by 0.75K week over week. While that is a small improvement near term, the overall longer-term trend for claims has yet to see any significant and consistent improvements over the past year. That being said, there has not been any deterioration either as claims have held at strong levels relative to history.
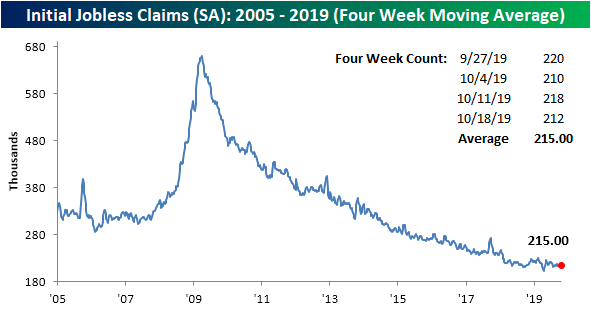
Ironically, the four-week moving average was also down 0.75K year over year with this week marking the first YoY decline in eight weeks. Just to illustrate how strong the downtrend in claims has been over the last decade, that eight-week streak was actually the longest streak of consecutive weeks where the four-week moving average was either unchanged or increasing in the last ten years.

On a non-seasonally adjusted (NSA) basis, claims fell to 186.3K this week from 201.7K last week. This was also a 12.4K decrease from the same week one year ago. Additionally, NSA claims continue to sit well below the average of 300.96K for the current week of the year since 2000. Start a two-week free trial to Bespoke Institutional to access our interactive economic indicators monitor and much more.

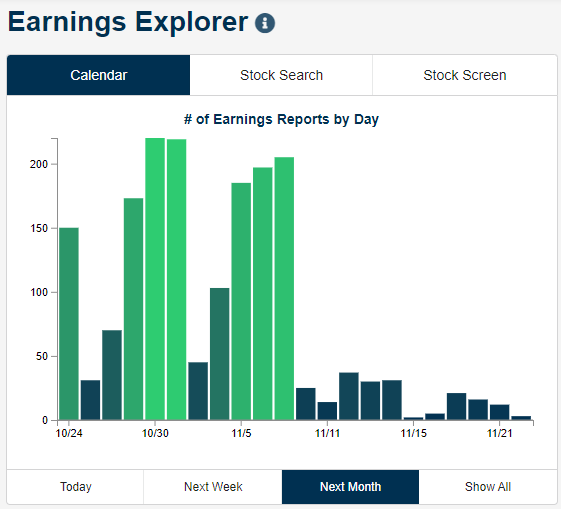
An Early Look at Earnings
We’re now in the thick of the Q3 earnings reporting period with 130 companies reporting since just the close last night. As shown in our Earnings Explorer snapshot below, earnings will be in overdrive for the next two weeks before dying down in mid-November.
Through yesterday’s close, 248 companies had reported so far this season, and 75% of them had beaten consensus bottom-line EPS estimates. However, just 63% of stocks have beaten sales estimates, and more companies have lowered guidance than raised guidance. In terms of stock price reaction to reports this season, so far investors have seen earnings as relatively bullish as the average stock that has reported has gained 0.60% on its earnings reaction day. Below we show another snapshot from our Earnings Explorer featuring the aggregate results of this season’s reports and a list of the stocks that have reacted the most positively to earnings. Four stocks so far have gained more than 20% on their earnings reaction days — PETS, BIIB, APHA, and LLNW.

We provide clients with a beat-rate monitor on our Earnings Explorer page as well. Below is a chart showing the rolling 3-month EPS and sales beat rates for US companies over the last 5 years. After a dip in the EPS beat rate earlier in the year, we’ve seen it steadily increase over the last few months up to its current level of 64.46%. That’s more than five percentage points above the historical average of 59.37%.
In terms of sales, 57.87% of companies have beaten top-line estimates over the last 3 months, which is much closer to the historical average than the bottom-line beat rate. Start a two-week free trial to Bespoke Institutional to begin using our Earnings Explorer and additional investment tools now. If you use this checkout link, you’ll receive a 10% discount on an annual membership if you stick with it past your trial period.

Europe Breaks Its Range
Just like the US equity market, European equities have been stuck in a range for the last several months, bouncing up and down between the top and bottom of a sideways trend channel. While we haven’t quite gotten there for the US market, Europe’s STOXX 600 is actually breaking out to new 52-week highs this morning (although it is still below prior highs from back in early 2018 and then early 2015 as well). Now, if only the US could follow suit.

From the perspective of a US investor, the breakout in European large-cap equities isn’t quite there yet, but it’s darn close. After adjusting for changes in the value of the dollar, the STOXX 600’s 52-week high was back in early July, and even after this morning’s gain, the index is just shy of taking out that prior short-lived peak. It may be hard to see on the large chart, so we have zoomed in on the last few days in the red-bordered inset chart in the lower right. As of this writing, the STOXX 600 is just 0.33% from a 52-week high in dollar-adjusted terms. Start a two-week free trial to Bespoke Premium to sample our most actionable investment research and receive access to all of our interactive tools. If you use this checkout link, you’ll receive a 10% discount on an annual membership if you stick with it past your trial period.

Bespoke’s Morning Lineup – 10/24/19
See what’s driving market performance around the world in today’s Morning Lineup. Bespoke’s Morning Lineup is the best way to start your trading day. Read it now by starting a two-week free trial to Bespoke Premium. CLICK HERE to learn more and start your free trial.

The Closer – Uptrends Occurring, Bye-Bye Mario, Fund Flows, Oil Import Collapse – 10/23/19
Log-in here if you’re a member with access to the Closer.
Looking for deeper insight on markets? In tonight’s Closer sent to Bespoke Institutional clients, we begin with a look across European equity markets which are beginning to break out of downtrends or sideway trends. We also take a glance around the globe at the number of global indices approaching 52-week highs. Turning to economic data we review Eurozone consumer confidence and the departure of ECB’s Mario Draghi. We finish tonight with our weekly update on ICI Fund Flows and EIA petroleum data.

See today’s post-market Closer and everything else Bespoke publishes by starting a 14-day free trial to Bespoke Institutional today!
Apple (AAPL) Cracks FANG
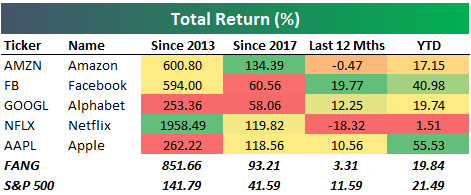
FANG is probably the most well-known acronym in the stock market these days, but if you’ve been following things lately, you know that this trade is no longer what it once was. 2017 was a banner year for the FANG group of Facebook (FB), Amazon (AMZN), Netflix (NFLX), and Alphabet (GOOGL), and the first half of 2018 was just as good. Because of FANG’s stumbles since mid-2018, however, you may be surprised to see that Apple (AAPL) — not an original FANG member — is now outperforming the group since the start of 2017. Apple’s (AAPL) recent gains leave it up 118.6% over this time period versus FANG’s gain of 93.2%. (Both AAPL and FANG have still more than doubled the S&P 500 since the start of 2017.)

Below we compare the performance of Apple (AAPL) vs. FANG and the S&P 500 over three additional time frames. The first chart shows total returns over the last 12 months. Here, we’ve actually seen the S&P 500 outperform both AAPL and FANG, with FANG bringing up the rear at just +3.3%.

Year-to-date, Apple (AAPL) easily crushes both FANG and the S&P 500 with a gain of 55.5%. The S&P 500 is up the second most with a gain of 21.5%, while FANG is up just under 20% (19.8%).

Our final chart reminds you that there’s a reason why “FANG” became a thing. If we go back to 2013, which was the first full year that Facebook (FB) traded as a public company, FANG absolutely crushes the S&P and Apple (AAPL). While AAPL and the S&P are up significantly at +262.2% and 141.8%, respectively, the four FANG names have gained a whopping 851.7%.

Below is a table that breaks out the total returns for Apple (AAPL), Amazon (AMZN), Facebook (FB), Alphabet (GOOGL), Netflix (NFLX), FANG, and the S&P 500 over the four time periods shown in the charts above. While Netflix (NFLX) is actually down 18.3% over the last 12 months, it’s the biggest winner of them all since 2013 with a gain of 1,958%. Amazon (AMZN) has been the biggest winner since the start of 2017, while Facebook (FB) is up the most over the last 12 months. Apple (AAPL) only ranks first in the year-to-date column. Start a two-week free trial to Bespoke Premium to sample our most actionable investment research and receive access to all of our interactive tools. If you use this checkout link, you’ll receive a 10% discount on an annual membership if you stick with it past your trial period.
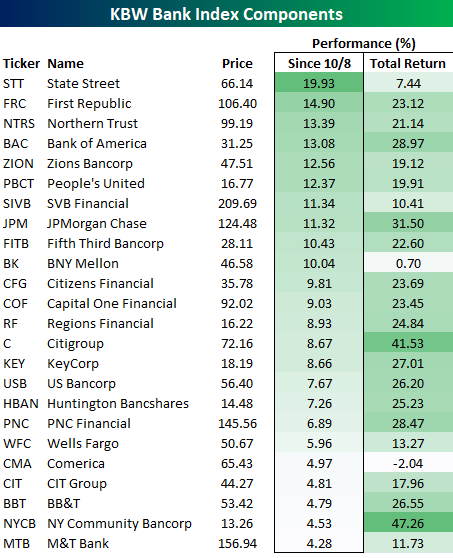
Banks – On To The Next Test
It has been a pretty monumental two weeks for the KBW Bank index. Since the close on 10/8, the index has rallied just under 9% as earnings reports from some of the largest US banks received a warm welcome from Wall Street. The index is now once again testing the top-end of its range, one which it has unsuccessfully tested multiple times in the last year. If you think the repeated tests of 3,000 for the S&P 500 over the last 18 months have been dramatic, the current go around with 103 for the KBW Bank Index has been the sixth such test in the last year! We would also note that prior to last year’s fourth quarter downturn, the same level that has been acting as resistance for the KBW Bank index was previously providing support.
In the case of each prior failed break above 103 for the KBW Bank index, sell-offs of at least 5% (and usually 10%+) followed, but one thing the index has going for it even if the sixth time isn’t the charm is that just yesterday it broke above its downtrend that has been in place since early 2018. The group has passed one test at least! From here, if we do see a pullback, that former downtrend line should provide support.

Turning to the KBW Index’s individual components, the table below lists each of the 24 stocks in the index along with how each one has performed since the index’s recent low on 10/8 and on a YTD basis (sorted by performance since 10/8). In the slightly more than two weeks since the index’s short-term low, every stock in the index is up and up by at least 4%. That’s a pretty broad rally!
Leading the way to the upside, State Street (STT) has rallied nearly 20%, while First Republic (FRC), Northern Trust (NTRS), and Bank of America (BAC) have jumped more than 13%. In the case of STT, the rally of the last two-weeks has also moved the stock into the green on a YTD basis. Start a two-week free trial to Bespoke Premium to sample our most actionable investment research and receive access to all of our interactive tools. If you use this checkout link, you’ll receive a 10% discount on an annual membership if you stick with it past your trial period.
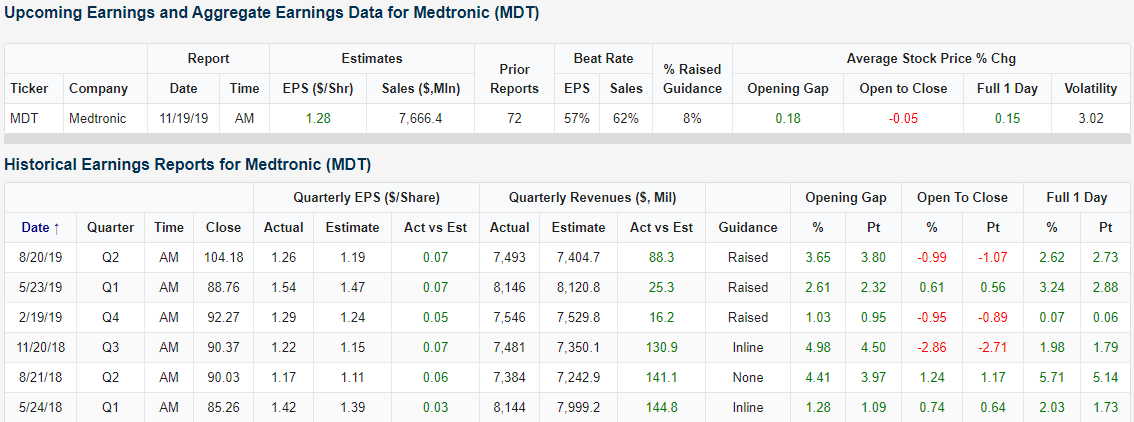
Dividend Stock Spotlight: Medtronic (MDT)
Every Tuesday, we update our Bespoke Stock Scores which ranks each of the stocks in the S&P 1500 based on a fundamental, technical, and sentiment score which are then aggregated for an overall score in order to help investors generate ideas for further analysis. One of the top stocks this week was Health Care Equipment and Services company Medtronic (MDT) with a total score of 77.17 (any total score over 70 is considered to be positive). Given a high fundamental score (over 95), the stock has a solid valuation versus its peers and the technicals are also looking good. Currently, MDT has pulled back to oversold levels within the context of its longer-term uptrend which has also given it a ‘good’ timing score in our Trend Analyzer. Having risen 1.2% in today’s session, the stock has already begun to experience some mean reversion.
Additionally, Medtronic (MDT) is attractive as a dividend stock. MDT currently yields 2.67%, which is larger than the average for not only the broader indices but also S&P 1500 Health Care stocks which average a much smaller yield of just 0.5%. MDT’s dividend is comparable to the yields of some other major players within the sector like Merck (MRK) and Amgen (AMGN). One major difference, though, is that MDT has a longer history of growing its payout. MDT has also now raised its dividend every year for the past 42 years; earning it a spot amongst the Dividend Aristocrats. Although the payout ratio of 83.8% and net debt to EBITDA ratio of 1.76 have room for improvement, they do not point to any considerable concern over the company’s ability to continue this dividend growth going forward.

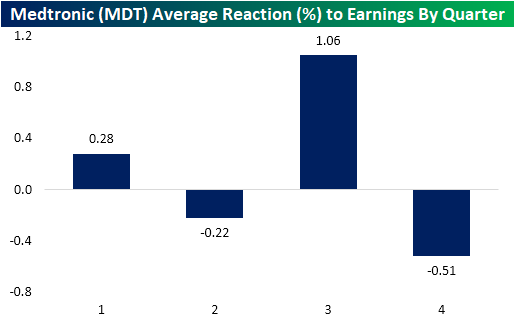
Given we are in the heart of earnings season, Medtronic’s recent earnings history has been another bright spot. Not only has the company reported a triple play in each quarter of 2019, but the stock has seen a positive full day price reaction every quarter since May of 2018 (six consecutive quarters). MDT does not report for another month, but seasonality is on the stock’s side to keep this streak going as the third quarter has historically seen the highest average full-day earnings gain, 1.06%, in response to earnings. Start a two-week free trial to Bespoke Institutional to access our interactive Earnings Explorer, 100 Most Recent Triple Plays, Trend Analyzer, and much more.