Homebuilders Head Higher and Higher
This morning’s release on homebuilder sentiment provided more reinforcement as to just how strong the housing market has been despite – or even thanks – to the pandemic. The NAHB’s Housing Market index rose another 6 points in August to 78, surpassing the pre-pandemic high of 76 from December, and now ties December of 1998’s reading for the highest in the history of the index.
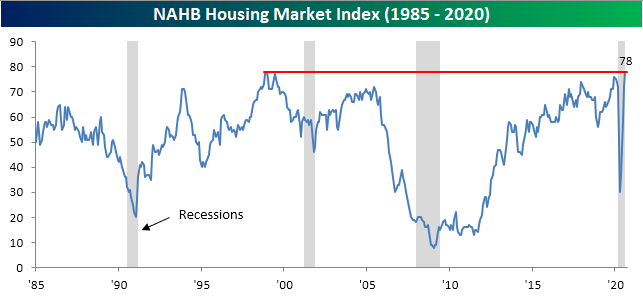
Not only is the index at its joint highest level ever, but the 6 point increase this month was no small move to get there, registering in the top 95% of all monthly changes. Excluding the past few months’ readings, August’s jump was the largest monthly gain since March of 2017. Breadth was also strong with every sub-index and all regions rising month over month; many of those are now at or close to fresh records.

While the headline index is right at its record high, the index for Traffic reached a new record this month surging 9 points to 65, surpassing its prior high of 62 from December of 1993.

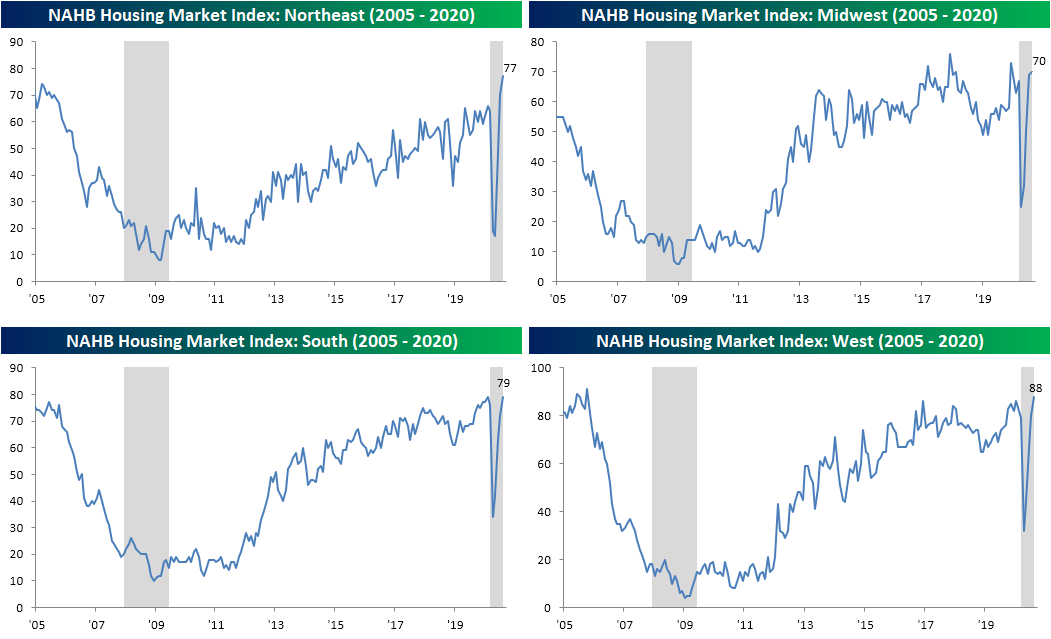
Broken down by the four regions of the country, each one is strong, but the Northeast has seen some the biggest moves in the past few months and is now at a record high. People are fleeing city apartments and looking for homes. Similar to the headline index, the South is also tied for a record. That index rose 7 points to 79 in August to return to its February levels.
With several aspects of the pandemic boosting housing, the homebuilder stocks have continued to surge. Just like homebuilder sentiment, the S&P 500 Homebuilders group is also at an all-time high today. It actually first made a new high last week after taking out the prior high from July of 2005. Start a two-week free trial to Bespoke Institutional to access our interactive economic indicators monitor and much more.

Bad Breadth From the Empire Fed
The first of the regional Fed manufacturing indices for the month of August was released this morning in the form of the Empire State Manufacturing Survey. The headline number reversed lower sequentially for the first time after three straight months of large gains off of the April record low. The index fell 13.5 points—the nineteenth largest of any month on record—to 3.7. That indicates the region’s manufacturing sector still expanded for a second straight month in August, but that was at a slower pace than July. Meanwhile, outlook for six months in the future has continued to decline from the June multi-year high. The future expectations index deteriorated for a second consecutive month with that index declining MoM by 4.1 points to 34.3. Outside the previous two months, that is still the highest level of the index since June of 2018.

Although overall activity still rose in August, the deceleration was notable with the MoM decline in the bottom decile of all monthly changes while breadth was weak. Of the 10 individual components, only three rose in August. Those were the indices for prices paid and received and the number of employees. Breadth was even weaker for the indices for future expectations as not a single one rose in August. In other words, although business concretely improved in August, it was at a slower pace than July while businesses are also less optimistic than they were one month ago.
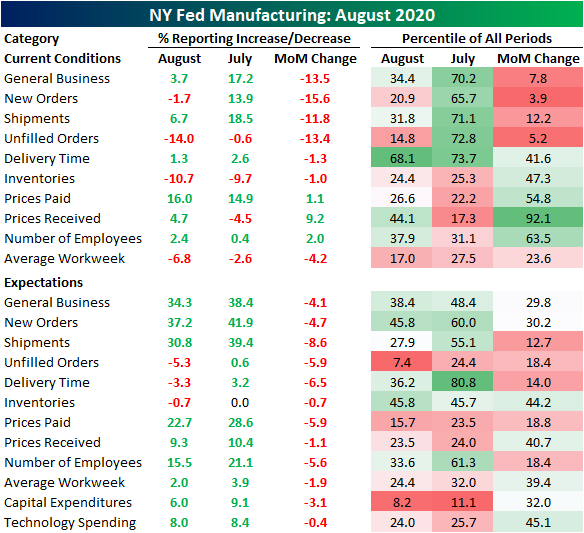
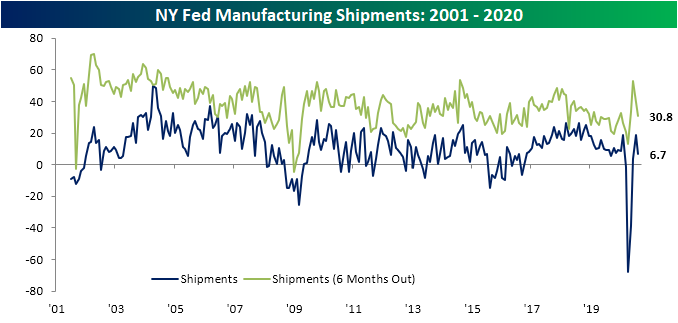
The index which experienced the largest pullback was for New Orders which fell by 15.6 points from an expansionary reading of 13.9 to a contractionary reading of -1.7. Outside of the massive drops in March and April as well as a 17.9 point decline last June, you would have to go back to 2010 to find another larger drop in New Orders. The index for Shipments likewise experienced a significant decline falling from 18.5 to 6.7, but that was only in the 12th percentile of all months (compared to the 3rd percentile for New Orders) and that still leaves that index in expansionary territory. Overall, these readings showed slowed demand in August.

Unlike just about every other category of the report, the indices for unfilled orders and inventories have still yet to show an expansionary reading in the COVID era. This month, both are indicating businesses are continuing to fulfill existing orders and work off the inventory spike from February. For unfilled orders, this month’s 13.4 point decline was in the bottom 5% of monthly moves but did not bring it to any new recent low. Meanwhile, the index for inventories fell to 10.7 which is just short of a multi-year low, slightly above the July 2019 level of 10.9.

In addition to prices (both received and paid), the only other current conditions index in this month’s report to rise was that for the number of employees. That index rose 2 points to 2.4. That is the first back to back expansionary readings since January and February of this year. Although businesses are increasing hiring, work hours continue to fall. The index for average workweek remains in contraction as it has for the prior six months and expectations have also continued to deteriorate. Click here to view Bespoke’s premium membership options for our best research available.
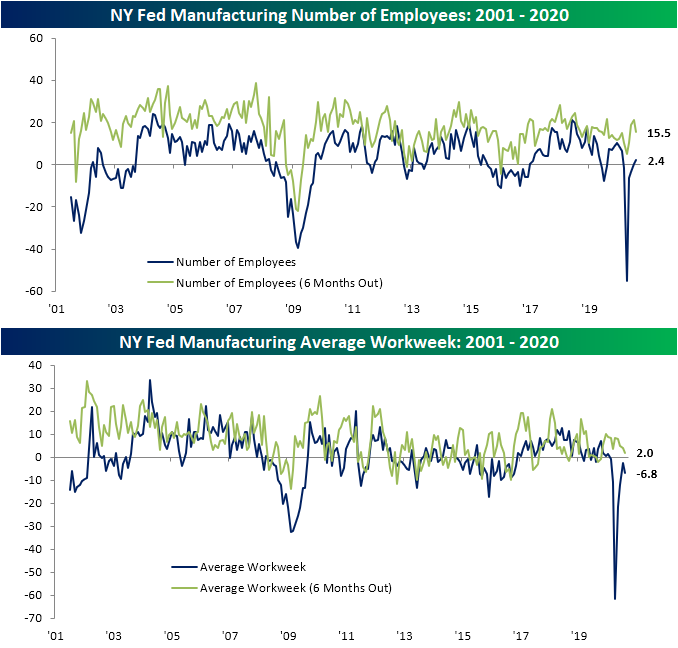
Chart of the Day: Passenger Traffic Taking Off
Bespoke Brunch Reads: 8/16/20
Welcome to Bespoke Brunch Reads — a linkfest of the favorite things we read over the past week. The links are mostly market related, but there are some other interesting subjects covered as well. We hope you enjoy the food for thought as a supplement to the research we provide you during the week.
While you’re here, join Bespoke Premium with a 30-day free trial!
China
The Fortune Global 500 is now more Chinese than American by Alan Murray and David Meyer (Fortune)
Th newly updated Fortune 500 list of the 500 largest companies by revenue has more companies from China and Hong Kong than the US, a first. Back in 1990, when the list was first published, there were no Chinese firms tallied. [Link]
China’s Days as World’s Factory Are Over, IPhone Maker Says by Debby Wu (Bloomberg)
Apple supplier Hon Hai Precision Industry (aka Foxconn) is planning on splitting its supply lines between China and the rest of the world; it’s already shifted about 5% of production capacity outside of mainland China over the past year. [Link]
Business Shifts
The Visa Back to Business Study (Visa)
A long report discussing a survey and internal data from Visa focused on small businesses. Contactless payments, a focus on revenues, and digital commerce driving growth are all key takeaways. [Link; 25 page PDF]
Amazon and Mall Operator Look at Turning Sears, J.C. Penney Stores Into Fulfillment Centers by Esther Fung and Sebastian Herrera (WSJ)
Simon Property Group, the largest mall operator in the US, has been in talks with Amazon to turn anchor spaces that used to be filled with department stores into small distribution hubs that could serve as warehouses for “the everything store”. [Link; paywall]
City Stories
After Chicago Looting and Coronavirus, Businesses Consider Closing Shop by Joe Barrett (WSJ)
Chicago businesses are struggling to manage both the slowdown in traffic driven by COVID and the impact of looting in recent weeks. [Link; paywall]
Retail Chains Abandon Manhattan: ‘It’s Unsustainable’ by Matthew Haag and Patrick McGeehan (NYT)
With foot traffic all but gone, what was once some of the most valuable retail real estate in the country has collapsed into a quagmire of unprofitable stores and empty restaurants. [Link; soft paywall]
City Fiscal Conditions 2020 (National League of Cities)
A brutal report on the outlook for city finances, wrecked by an unprecedented shift in economic activity that has destroyed revenue models based on property and sales taxes alike. [Link; 28 page PDF]
Vaporware
This Investment Burned Almost Everyone by Spencer Jakab (WSJ)
An exchange-traded note that theoretically moves inverse to natural gas sky-rocketed after its issuer (Credit Suisse) halted issuing new shares; the notes traded from $400 to nearly $25,000 before a subsequent retirement of the shares at face value. [Link; paywall]
Software firm MicroStrategy makes a massive bet on Bitcoin with a $250 million purchase by Jeff John Roberts (Fortune)
A small software firm in Virginia has converted its corporate cash holdings into Bitcoin, in some unique blend of risky speculation and publicity stunt. [Link]
COVID
A Cheap, Simple Way to Control the Coronavirus by Laurence J. Kotlikoff and Michael Mina (NYT)
Tests that use a simple piece of paper and the subject’s spit will soon be available and are vastly cheaper than lab-based testing, which opens up the possibility individuals will know much sooner if they’ve been exposed to COVID. [Link; soft paywall]
Futility For Utilities
Amid power outages, CEO of generator maker anticipates ‘massive change’ coming to the grid by Tyler Clifford (CNBC)
With hurricanes and major storms increasingly threatening the aging electrical grid, small generators like those sold by Generac are getting more attractive for consumers that want permanent access to power. [Link]
Sports Lotteries
1986-87 Fleer Basketball Case Sells for Record-Breaking $1.78 Million by Darren Rovell (Action Network)
A 35 year-old case of basketball cards which contains over 400 packs of cards (and likely at least 36 Michael Jordan rookie cards valued at $80,000 or more) has sold for $1.8mm. [Link]
Read Bespoke’s most actionable market research by joining Bespoke Premium today! Get started here.
Have a great weekend!
The Bespoke Report — World Record
This week’s Bespoke Report newsletter is now available for members.
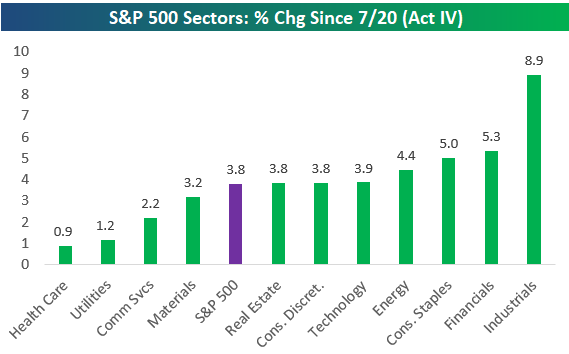
Given the rotation we’ve seen into “re-open” areas of the market since July 20th, we can now confidently say that we’re in the midst of “Act IV” of the current bull market.
Below is our chart of the S&P 500 since last December highlighting what is now a four-act bull. Act I was the strongest and led by Tech, Health Care, and Energy. Act II saw huge gains from “re-open” plays as the first wave of COVID subsided. Act III saw sideways action for the broad market but big gains from Tech/FAANG as COVID cases began to rise again. And finally, Act IV has been led once again by re-open stocks in Industrials, Transports, and Financials, while the Tech sector and “COVID Economy” stocks have taken a breather.
We cover markets and the economy in much more detail in our weekly Bespoke Report newsletter. To read the report and access everything else Bespoke’s research platform has to offer, start a two-week free trial to one of our three membership levels. You won’t be disappointed!


When a Few Basis Points Packs a Punch
US Treasury yields have been on the rise this week with the 10-year yield rising 13 basis points (bps) from 0.56% up to 0.69% after getting as high as 0.72% on Thursday. A 13 bps move higher in interest rates may not seem like a whole lot, but with rates already at such low levels, a small move can have a pretty big impact on the prices of longer-term maturities.

Starting with longer-term US Treasuries, TLT, which measures the performance of maturities greater than 20 years, has declined 3.5% this week. Now, for a growth stock, 3.5% is par for the course, but that kind of move in the Treasury market is no small thing. The latest pullback for TLT also coincides with another failed attempt by the ETF to trade and stay above $170 for more than a day.

The further out the maturity window you go in the fixed income market, the bigger the impact of the move higher in interest rates. The Republic of Austria issued a 100-year bond in 2017, and its movements exemplify the wild moves that small changes in interest rates (from a low base) can have on prices. Just this week, the Austrian 100-year was down over 5%, which is a painful move no matter what type of asset class you are talking about. This week’s move, though, was nothing compared to the stomach-churning swings from earlier this year. When Covid was first hitting the fan, the 100-year rallied 57% in the span of less than two months. That kind of move usually occurs over years rather than days, but in less than a third of that time, all those gains disintegrated in a two-and-a-half week span from early to late March. Easy come, easy go. Ironically enough, despite all the big up and down moves in this bond over the last year, as we type this, the bond’s price is the same now as it was on this same day last year. Start a two-week free trial to Bespoke Institutional to access all of our research and interactive economic tools.

Bespoke Fox Business Appearance (8/13)
Bespoke co-founder Paul Hickey appeared on Fox Business Network’s “Making Money With Charles Payne” on 8/13 to discuss the election and stock splits. To view the segment click on the image below. Start a two-week free trial to Bespoke Institutional for full access to all of our research and interactive tools.

Chart of the Day: Is the Market Pricing In Uncertainty on the Election Outcome?
Near Record Highs Brings Some Bulls Back
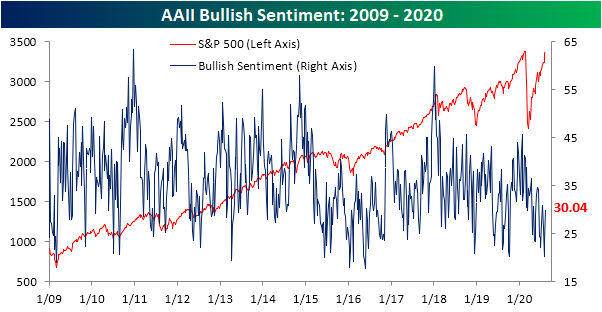
The S&P 500 has pressed ever closer to a new all-time high, but as we noted last week, sentiment remains fairly muted. Historically, when the S&P 500 has been at or within 1% of an all-time high bullish sentiment has sat around an average of 40%. Bearish sentiment, on the other hand, has typically been around 25.5%. With the S&P 500 less than a tenth of a percent away from its February 19th closing high today, bullish sentiment from AAII stands at 30.04%; roughly 10 percentage points away from what could be expected when the S&P 500 is so close to an all-time high. Although bullish sentiment is lower than might be normal for where the S&P trades, it did pick up considerably week over week, rising 6.75 percentage points in what was the largest single weekly increase since March 5th when it rose by 8.31 percentage points. Even after that increase, though, bullish sentiment was higher less than a month ago (July 16th).
Again, historically bearish sentiment has only been just over 25% when the S&P 500 is close to all-time highs. That is far from the case today as 42.12% of respondents in AAII’s survey reported as bearish. Conversely to bullish sentiment, though, bearish sentiment fell 5.48 percentage points. That was the largest week over week decline since May 21st’s 5.59 percentage point decline, leaving bearish sentiment at its lowest level since June 11th.

Those moves in bullish and bearish sentiments led the bull-bear spread to be cut in half, rising from -24.31 to -12.08. That is the most the spread has climbed in a single week since February when it rose from -1.35 to 14.93. Despite that large move, the spread still favors bears as the record streak of negative readings lives on. The bull-bear spread is now at its highest reading since June 11th.

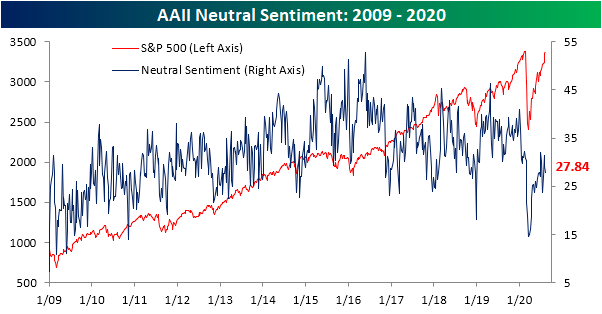
Meanwhile, neutral sentiment was slightly lower, dropping 1.27 percentage points to 27.84%. That only leaves it at its lowest level since July 23rd. Start a two-week free trial to Bespoke Institutional to access our interactive economic indicators monitor and much more.
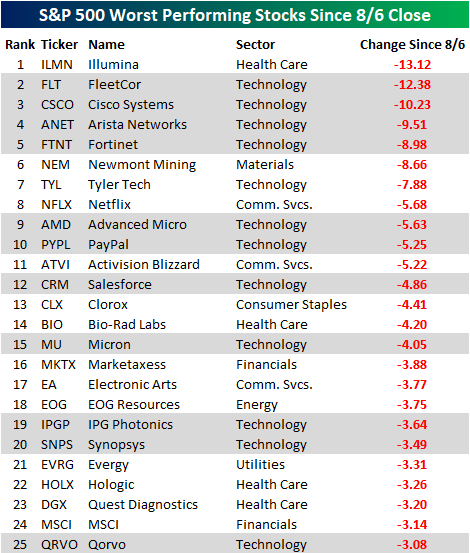
The Strangest Top 25 List In Some Time
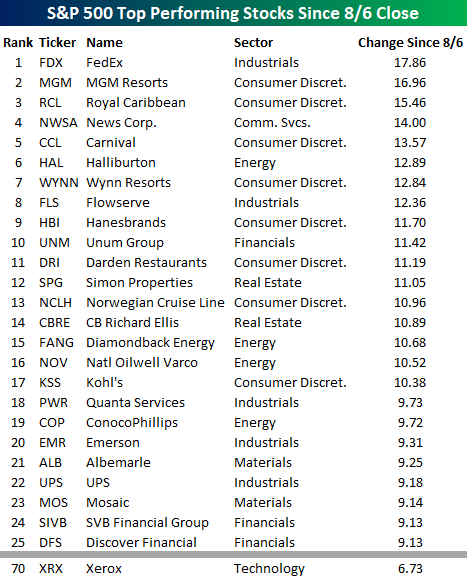
Look closely at the list of the top 25 performing S&P 500 stocks since last Thursday’s close and tell us what’s wrong with it? Do you see it? Keep looking, you’ll figure it out. Yup. That’s it! Not a single one of the 25 best performing stocks over the last week is from the Technology sector. In looking through the list of names, it’s littered with stocks that were left for dead at varying points in the last several months. FedEx (FDX) is up nearly 18%. Casinos and cruise ships have been collecting dust and rust for the last five months, but the stocks of MGM and Royal Caribbean (RCL) are the second and third best-performing stocks in the S&P 500 over the last week.
Not only are there no stocks from the Technology sector in the top 25, but there aren’t even any in the top 50. To find a Tech sector stock on the list, you have to go all the way down to spot number 70 where Xerox (XRX) sits with its gain of 6.73%. Yeah. We were surprised too. Not only is XRX still a public company, but it’s considered a tech stock.
If you want to find a lot of stocks from the Technology sector, they are on the list of the 25 worst performers since last Thursday. Of the 25 names listed below, 12 are from the Technology sector. Not only that, but even many of the non-tech stocks listed like Illumina (ILMN), Netflix (NFLX), Activision Blizzard (ATVI), Marketaxess (MKTX), Electronic Arts (EA), and Hologic (HOLX) have very high tech characteristics behind their businesses. Like what you see? Start a two-week free trial to Bespoke Institutional for full access to our research and interactive tools.