Bespoke CNBC Appearance (9/9)
Bespoke co-founder Paul Hickey appeared on CNBC’s Squawk Box this morning to discuss the outlook for large-cap tech stocks and the broader market. To view the segment, please click on the image below. Click here to view Bespoke’s premium membership options for the best market analysis available.

September Mean Reversion
In today’s Morning Lineup, we showed an update of our ETF Performance Matrix, which summarized the performance of key ETFs across asset classes on a YTD and MTD basis as well as since the March 23rd low. In looking through the matrix, it’s clear that much of the declines that equities have seen since the start of September have been a reversal of what we saw for equities coming off the March lows through now. As noted, the Nasdaq has been underperforming small caps this month, value has been outperforming growth across all market cap ranges, and international stocks are mostly outperforming US equities. From the March lows through the start of September, though, it was the Nasdaq, growth, and US stocks that were outperforming the small caps, value, and international stocks.
One way to illustrate this relationship is in a scatter plot below comparing the performance of each equity-related ETF in the matrix from the lows on 3/23 (y-axis) versus their performance in September through Tuesday’s close (x-axis). Looking at it this way, there is a pretty clear inverse relationship between performance over these two time periods. As another example, the top ten performing of the 50 equity related ETFs in the matrix so far this September had an average rank of 36 in their performance off the March lows. Conversely, the ten worst performing ETFs in the Matrix so far this month had an average rank of 16 in their performance of the march lows. Every dog has their day, and the ‘dogs’ of the market off the March lows have been holding up very well on a relative basis so far in September. Click here to view Bespoke’s premium membership options for the best market analysis available.

Chart of the Day: Nasdaq Falls 10% But Still Above 50-DMA
Remarkably, the Nasdaq 100 managed to fall 10%+ over the last three trading days and still close above its 50-day moving average! This data point highlights just how extended into overbought territory that the index was leading up to its recent drop. The only other times the index has seen a 3-day drop of 10%+ and still closed above its 50-DMA were on January 6th, 2000 and May 30th, 2001. Following the January 2000 occurrence, the index bounced back sharply over the next month (+21.6%), but ultimately peaked in March of that year and went on to enter an extended bear market. The May 2001 occurrence also saw a big bounce-back of 7% over the next week, but that was right in the middle of the bear market and the index rolled over by 14% over the next three months.

As shown below, the Nasdaq 100 has closed above its 50-day moving average for the last 103 trading days. There have only been nine prior streaks of 100+ days above the 50-DMA in the index’s history dating back to 1985. The 50-DMA will eventually break and the streak will come to an end, and in today’s Chart of the Day, we highlight how the Nasdaq performed in the days and weeks following the break below support at the 50-DMA. We also highlight how the index performed in the days and weeks following prior three-day drops of 10%+. If you’re wondering what history has shown following past moves that are similar to what we’ve just seen for the Nasdaq, today’s Chart of the Day is a helpful read. You can access the report with a two-week free trial to any of our three premium membership levels. CLICK HERE to start your free trial now.

What’s Worrying Small Businesses?
In an earlier post, we detailed the results of the August report on small business optimism from the NFIB. Additionally, the monthly report surveys respondents on what are their biggest concerns. As shown below, Quality of Labor was unchanged as the biggest concern in August with 21% of businesses reporting as such. Cost of Labor, on the other hand, is less of a concern with only 9% reporting this as their biggest problem. Although it is in the middle of the road compared to other issues, that is elevated relative to the rest of history with that reading in the upper 5% of all readings. Behind Quality of Labor, Taxes are the next biggest issue for businesses at 17%. In the same vein, Government Red Tape and Requirements were also lower falling 3 percentage points to 11% in August. Finally, Poor Sales ranks as the third largest concern, rising 2 percentage points to 15%. That snapped a streak of three straight months of improvements in this reading and runs contrary to many other data points that have pointed to a continued turnaround in demand.


Overall, labor and government-related concerns on a combined basis account for more than half of businesses’ biggest issues. For costs or quality of labor, the 30% combined reading has been on the rise for three straight months now, but is still off the peak of 36% from late last year. Overall, that can actually be taken as a fairly positive sign for the labor market as it indicates that jobs are at least available. Click here to view Bespoke’s premium membership options for our best research available.

Optimism From the Little Guys
Early this morning the NFIB released the results of small business optimism for the month of August. The headline index rose 1.4 points to 100.2. That was better than expectations of 99.0 which would have been only slightly higher than July’s reading of 98.8. That indicates overall improved sentiment for small businesses in August though it remains far lower than levels from prior to the pandemic.
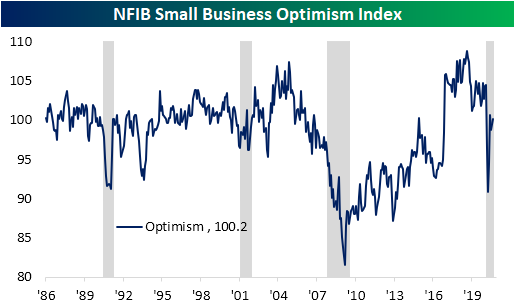
Of the ten individual components of the optimism index, most rose in August. Only two, Expectations for the Economy to Improve and Expectations for Real Sales to be Higher, fell while Plans to Make Capital Outlays was unchanged. The index that saw the biggest jump was for Actual Earnings Changes which rose 7 points to -25. That was the most that the index has risen in a single month since November of last year, but it still leaves it at the low end of the past decade’s range.
There is still a historically low level for expectations of future sales to be higher. That index was one of the two to fall in August as it is at its lowest level since October of 2016. Despite what appears like weak demand expectations, the net percent of owners viewing current inventories as too low stands at 3% which is in the 99th percentile of all readings. The current reading of 3 is the highest since February of 1997. As such, a higher share of businesses plan to increase inventories.
The indices covering employment were another strong point of this month’s survey. On a net basis, 21% of owners plan to increase employment which is up from 18 last month and stands in the top 5% of all readings. That index is currently right back to where it was before the pandemic began. Similarly, businesses are increasingly reporting job openings are hard to fill. That index rose another 3 points to 33 and is in the upper decile of historical readings. While improved and strong versus history, that index is much more muted relative to pre-pandemic levels than the index for Plans to Increase Employment.


Although they are not necessarily inputs into the headline number for the optimism index, some of the indices for actual changes shed some additional light on the picture for small businesses. For example, the index for Actual Sales Changes rose this month to -15 from -28 in July. That is tied with December of 1986 for the third-largest one month increase on record and the first back to back months with sequentially higher readings since November. While this still means that more businesses are reporting lower than higher sales, it also indicates that sales are continuing to turn around a bit. Meanwhile, fewer and fewer businesses are making capital expenditures. That index fell to 47 which means only 47% of businesses reported capital outlays in the last six months. That’s the lowest level since December of 2010. On the other side of the production function, labor also fell in August. The index for Actual Employment Changes fell 1 point to -12. Unlike for Capital Expenditures, though, that is not a fresh low.

There is also an interesting divergence in readings on credit conditions. As conditions remain accommodative, the index for Availability of Loans is at its joint highest reading on record (this index only goes back to 2004). Despite this, only 24% of owners reported borrowing on a regular basis. That is a record low reading.Click here to view Bespoke’s premium membership options for our best research available.
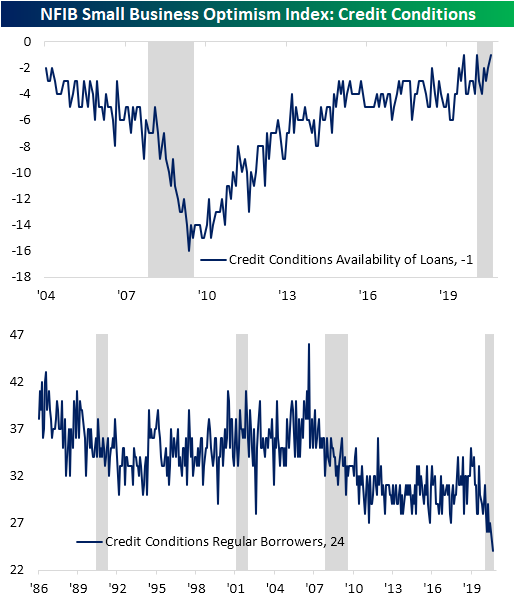
Chart of the Day: QQQ Gaps Down
Bespoke Brunch Reads: 9/6/20
Welcome to Bespoke Brunch Reads — a linkfest of the favorite things we read over the past week. The links are mostly market related, but there are some other interesting subjects covered as well. We hope you enjoy the food for thought as a supplement to the research we provide you during the week.
While you’re here, join Bespoke Premium with a 30-day free trial!
Elections
What if Facebook Is the Real ‘Silent Majority’? by Kevin Roose (NYT)
Political polling and betting markets show a pretty clear advantage for former Vice President Joe Biden in November, but Facebook is the heartland for conservative enthusiasm around Donald Trump. [Link; soft paywall]
U.S. Election Priced as Worst Event Risk in VIX Futures History by Michael P. Regan (Bloomberg)
The VIX futures curve is badly kinked around October’s contract, which is tied to options covering the period of the US election. [Link; soft paywall]
Exclusive: Dem group warns of apparent Trump Election Day landslide by Margaret Talev (Axios)
Leaving the slightly hyperbolic headline aside, there is a very real possibility that mail-in/absentee voting creates big differences between in-person results and the actual vote totals come election day. [Link]
Trump’s popularity slips in latest Military Times poll — and more troops say they’ll vote for Biden by Leo Shane III (Military Times)
In 2016, Military Times polling showed a 46-37 positive favorability for the President, but today that has more than flipped with a 50-38 unfavorable tilt among uniformed service members; respondents report they plan to vote 41-37 for Biden versus 41-21 advantage for President Trump in October 2016. [Link]
Generation Generalities
When It Comes to Gen Z’s Brand Preferences, the Most Important Influencers Are Their Parents by Alyssa Meyers (Morning Consult)
A recent poll shows that the youngest group of Americans are the most likely to take cues on preferred brands across a range of products from their parents. [Link]
It’s time to dispel the biggest myth about millennials by Myles Udland (Business Insider)
An oldie but a goodie from Myles Udland (now at Yahoo! Finance) arguing that Millennials’ preferences were not some sort of landmark departure from the prior American way of life but in fact just the same old story. [Link]
Dystopia
Targeted by Kathleen McGrory and Neil Bedi (Tampa Bay Times)
A detailed investigation of the Pasco County, Florida approach to crime prevention which involved invasive intelligence gathering, aggressive harassment of citizens picked out on an ad hoc basis, and general disregard for civil rights that created more crime than it prevented. [Link]
Amazon Drivers Are Hanging Smartphones in Trees to Get More Work by Spencer Soper (Bloomberg)
Drivers are competing to get orders from Whole Foods’ delivery service by hanging phones in trees near the distribution center which then pass on requests to their devices. [Link; soft paywall]
Learning At Home
Mom’s Hilarious Video Sums Up How Confusing This School Year Is For Everyone by Carolina Bologna (Huffpost)
Faced with massive frustration over the patchwork backdrop of remote and in-person learning, a mom parodied the painful experience of learning online. [Link]
Parents on TikTok mock people with disabilities for the ‘New Teacher Challenge.’ These women are reclaiming their images by Scottie Andrew and Kat Jennings (CNN)
A social media trend that sets up disabled people as the boogeyman and teaches their children to fear those same disabled people is a painful example of how what may seem innocuous fun can be deeply hurtful. [Link]
Hot Back-to-School Items During Coronavirus Are Tents, Webcams by Austen Hufford (WSJ)
Protective products, keyboards, webcams, and tents are all in huge demand as schools struggle to prevent the return of students from creating COVID hotspots. [Link; paywall]
Whales
SoftBank unmasked as ‘Nasdaq whale’ that stoked tech rally by Kana Inagaki, Katie Martin, Robert Smith and Robin Wigglesworth (FT)
In addition to buying the underlying stocks, SoftBank has reportedly bid up the call options of many of its US tech investments in an effort to push up investments even faster; that behavior may explain some of the massive tech rally we’ve seen in recent months. [Link; paywall]
Buffett’s 1977 Letter Hints at Why He Likes Japan Trading Houses by Stephen Stapczynski (Bloomberg)
Recent Berkshire Hathaway purchases in five Japanese conglomerates are in large part explained by his long-term focus on understandable, long-term, and competently run operations which are not extremely expensive. [Link; soft paywall]
Moving
New Yorkers Flee for Florida and Texas as Mobility Surges by Steve Matthews and Alexandre Tanzi (Bloomberg)
While mobility across state lines has sagged in recent years, 2020 is seeing a surge in movement from New York and New Jersey to warmer climates like Florida, Texas, and the rest of the Sunbelt. [Link; soft paywall]
Pandemic Purchases
In a Pandemic, Boats Are No Longer a Bad Investment by Alex Lauer (Inside Hook)
Loaded with operating costs and depreciation, boats have long been viewed as a great way to do away with large quantities of cash. But new and used boat sales have exploded during the pandemic as people look for ways to be outdoors and have some fun without getting on a plane or staying in a hotel. [Link]
Who Profits From Amateurism? Rent-Sharing in Modern College Sports by Craig Garthwaite, Jordan Keener, Matthew J. Notowidigdo, and Nicole F. Ozminkowski (NBER)
New research suggests that college sports effectively transfers resources away from black and lower income students and towards students who are white and higher income. This will not surprise many who have spent time close to college athletics departments. [Link]
Amazon Air
Amazon wins FAA approval for Prime Air drone delivery fleet by Annie Palmer (CNBC)
Drone delivery is now permitted to move forward for Amazon, who joins UPS and Google gaining approval for its automated airborne delivery fleet. [Link]
Read Bespoke’s most actionable market research by joining Bespoke Premium today! Get started here.
Have a great weekend!
The Bespoke Report — Laboring Into Labor Day
This week’s Bespoke Report newsletter is now available for members.
The Nasdaq 100 was more than 30% above its 200-day moving average on Wednesday, which was the most extended it has been above its 200-day since the Dot Com boom of the late 1990s. Even after a big two-day pullback to close out the week, the Nasdaq 100 remains 22% above its 200-day. You know an index is extended when a bear market decline of 20% wouldn’t even put it below its 200-day!

In this week’s Bespoke Report, we analyze the market’s drop over the last two days and try to determine whether it’s the start of a longer-lasting correction or simply a blip within a long-term uptrend.
We also take a look at this week’s big economic releases, including Friday’s better-than-expected Nonfarm Payrolls report and the monthly ISM manufacturing and services readings for August.
We close the report with a deep dive into each of our Bespoke Model Portfolio holdings. If you want to know why we like each of the stocks in our most popular growth portfolio, this week’s report provides a detailed look.
To read this week’s Bespoke Report newsletter and access everything else Bespoke’s research platform has to offer, start a two-week free trial to one of our three membership levels. You won’t be disappointed!

Airports Getting a Little More Crowded
Recent economic data has been making a habit of surprising to the upside as the pace of recovery from the pandemic lows has consistently surprised most economists. While improved, the picture isn’t perfect. This morning’s non-farm payrolls report, which was better than expected at the headline level, showed a concerning increase in the number of permanent job losses (people looking for work that left their prior job on an involuntary basis). Also, looking at more real-time indicators of activity like TSA passenger throughput at the country’s airports appears to have leveled off after rising off the lows in May and June. This begs the question, has the low hanging fruit been fully harvested?
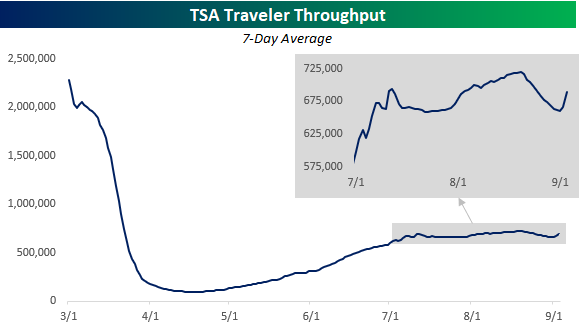
In some ways, the answer to this question is yes. In March and April, pretty much everything shut down. As awareness of the virus and how to deal with it grew, though, businesses that were little impacted have resumed operations. While those businesses have resumed activity, there are still a number of businesses such as ones in the travel, leisure, beauty, and hospitality sectors that remain weak in part because the demand hasn’t returned but also because government orders prohibit them from re-opening in full or even at all. As concerns from the public start to ease and restrictions are lifted, these sectors should also start to improve.
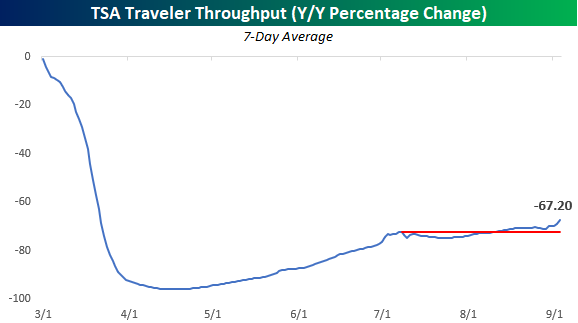
While the pace of the recovery has slowed, it doesn’t yet appear to be rolling over. Take the passenger data in the chart above. While it appears to have stalled out in the last two months, part of the decline is the result of seasonal factors. The chart below takes the same data as the chart above but compares the throughput levels to where they were a year ago and shows the y/y percentage change. On this basis, passenger traffic is still down an eye-popping 67% compared to a year ago, but yesterday’s level was actually the highest reading since late March and has actually been accelerating to the upside. It’s possible that where Labor Day falls on the calendar this year could be impacting the y/y change, so we’ll have to see where things shake out in the next week, but even with that caveat, the pace of air traffic looks better on a y/y basis than on an absolute basis. Like what you see? Try out a Bespoke subscription to receive our weekly Bespoke Report in your inbox this evening. Click here to start a two-week free trial now!
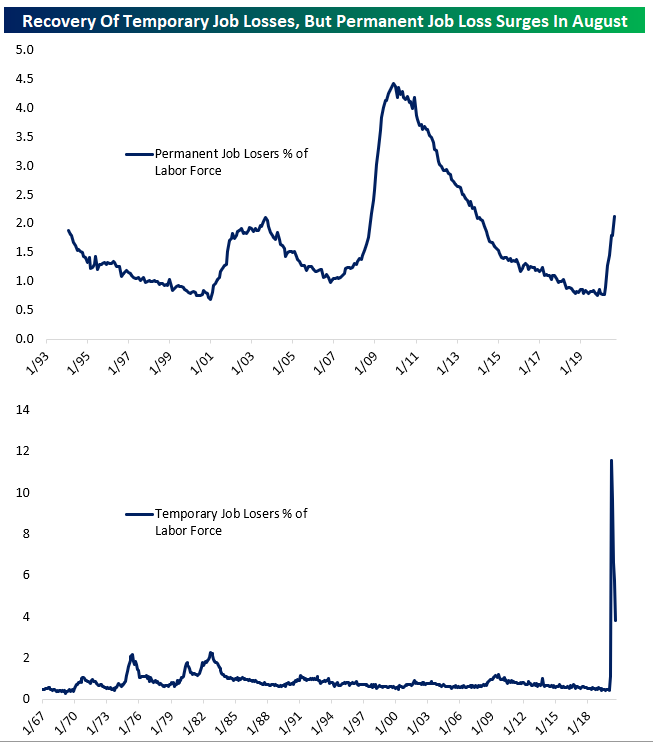
Under The Surface, The Labor Market Weakened In August
Headline statistics from the Bureau of Labor Statistics Employment Situation Report on Friday morning showed further labor market recovery from COVID. But under the surface, August had significant labor market deterioration. While payrolls beat, the unemployment rate fell faster than expected, wages were stronger than expected, and hours worked rose against expectations, the number of Americans who are on permanent layoff (involuntarily unemployed and looking for work) rose by more than 500,000, and their share of the overall labor force is now the same as during the peak of the early-2000s recession.
While the huge drop in temporarily laid-off workers that has been ongoing for several months continued, widening of permanent job loss suggests that the labor market is still deteriorating as businesses close, reduce output, or are forced from re-opening thanks to the ongoing economic impact of COVID. While the headline numbers were welcome, it’s important to understand that they don’t tell the full story. Please note both charts below show data for all periods it is available. For more on the jobs report, try out a Bespoke subscription to receive our weekly Bespoke Report in your inbox this evening. Click here to start a two-week free trial.