2021 Outlook – Economic Indicators
Our 2021 Bespoke Report market outlook is the most important piece of research that Bespoke publishes each year. We’ve been publishing our annual outlook piece since the formation of Bespoke in 2007, and it gets better every year! In this year’s edition, we’ll be covering every important topic you can think of that will impact financial markets in 2021.
The 2021 Bespoke Report contains sections like Economic Cycles, The Fed, Sector Technicals and Weightings, Stock Market Sentiment, Stock Market Seasonality, Housing, Commodities, and more. We’ll also be publishing a list of our favorite stocks and asset classes for 2021 and beyond.
We’ll be releasing individual sections of the report to subscribers until the full publication is completed by year-end. Today we have published the “Economic Indicators” section of the 2021 Bespoke Report, which recaps trends and levels of different US economic indicators and what they say about the health of the US economy.
To view this section immediately and all other sections, become a member with our 2021 Annual Outlook Special!

IPO Craze
It has been a big week for IPOs with DoorDash (DASH) and Airbnb (ABNB) both hitting the secondary market. These two stocks saw massive first-day gains of 86% and 113%, respectively. Generally speaking with the two aforementioned stocks as a case study, recent IPOs have been welcomed with open arms. As a result, the IPO ETF (IPO) has seen a sizeable rally having gained over 30% since the low at the end of October. While neither DoorDash nor Airbnb are current holdings of this ETF, this week saw some volatility with a 3% drop on the day of DoorDash’s debut and a 2.5% rally yesterday when Airbnb debuted. IPO currently sits just off its highs after the past month and a half’s rally, but that is at some of the most overbought levels of the past five years as shown in the second chart below.


Relative to the S&P 500 (SPY), IPOs have seen massive outperformance since the bear market lows. In the chart below we show the performance of the Renaissance IPO ETF (IPO) versus the S&P 500 (SPY) over the past five years. From 2016 through the pandemic lows in March, these two tracked each other very closely, but IPO has skyrocketed versus SPY over the last nine months. Click here to view Bespoke’s premium membership options for our best research available.

Bespoke’s Morning Lineup – 12/11/20 – No Deals Yet
See what’s driving market performance around the world in today’s Morning Lineup. Bespoke’s Morning Lineup is the best way to start your trading day. Read it now by starting a two-week free trial to Bespoke Premium. CLICK HERE to learn more and start your free trial.
“Diplomacy is the art of telling people to go to hell in such a way that they ask for directions.” – Winston Churchill
Lawmakers on both sides of the Atlantic are in intense discussions, but the involved parties in both sets of talks have yet to reach an agreement. Over in the UK, negotiators in the UK and EU have been at a stalemate and European Commission President Von Der Leyden says no deal is the most likely outcome of current talks. Closer to home in the US, lawmakers in Washington haven’t quite told each other to go to hell, but they still can’t agree on the terms of a new round of fiscal relief.
Futures are lower heading into the last trading session of the week as all of the major averages with the exception of the Russell 2000 are set to finish the week lower. Don’t tell that the this week’s latest round of IPOs, though. As noted in today’s Morning Lineup, they’ve been on fire lately.
Be sure to check out today’s Morning Lineup for updates on the latest market news and events, a recap of recent IPO performance, an update on the latest national and international COVID trends, and much more.

After yesterday’s rally in the Nasdaq, we wanted to provide a quick update on its intraday performance over the last three weeks. Even after yesterday’s rebound, the Nasdaq remains well below the uptrend it broke earlier this week. Looking forward, that level is likely to act as short term resistance on any bounce.

Similar to the Nasdaq, the S&P 500 also broke its uptrend earlier this week, but not to quite the same degree as the Nasdaq. Like the Nasdaq, though, that former uptrend line is likely to act as a short-term speed bump on any bounce.

Lastly, while most investors wouldn’t touch long-term treasuries at this point, they’ve actually performed quite well over the last few trading days and will likely break this short-term downtrend in today’s trading.

Meet the Nasdaq 100’s Post-Election Leaders
The Nasdaq 100 finally made a new high on Tuesday before pulling back yesterday, but in the run-up to new highs in the post-election rally, it hasn’t been the same old crew of stocks pushing the index higher. While the Nasdaq 100 is up about 12.5% since the election, thirteen stocks are up by more than twice the amount of the index itself. Leading the way higher, Moderna (MRNA) is up over 100% after positive news regarding its vaccine. After MRNA, shares of Pinduoduo (PDD), a Chinese e-commerce play, have rallied more the 50%, rising from $97.72 up to $154.00. Tesla (TSLA) rounds out the top three with a gain of 47% in just the last five weeks. The next two stocks on the list – Applied Materials (AMAT) and Micron (MU) – can hardly be considered emerging stocks. In addition to those two stocks from the semiconductor sector, three others from the sector made the cut (LRCX. MCHP, and QCOM) as chips have been red-hot.
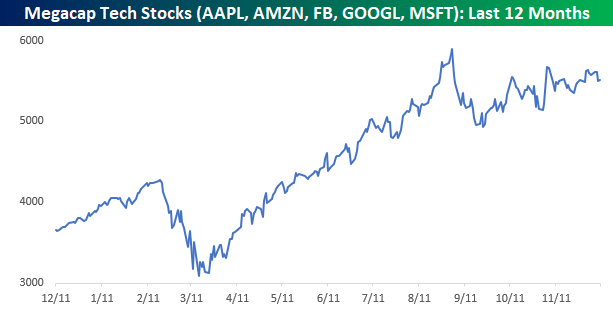
At the bottom of the table, we have also included the performance of the five mega-cap stocks of the Nasdaq 100. While all five stocks outperformed for much of 2020, not a single one of them is outperforming the Nasdaq 100 since Election Day, and only Apple (AAPL) is anywhere close to matching the performance of the index itself.

The chart below shows the performance of an equally-weighted basket of the five mega-cap stocks over the last year. From 9/2 to 9/23, this basket of stocks pulled back more than 16%, and while it has been steadily grinding higher in the eleven weeks since that low, up until this point, the prior highs from September haven’t even come into play. Click here to view Bespoke’s premium membership options and a free trial to our best research available.
Sentiment Still Overwhelmingly Bullish
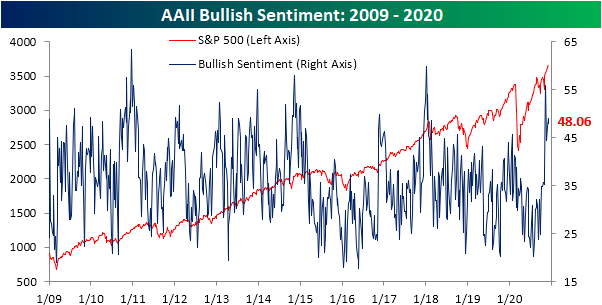
For the third week in a row, just under half of the respondents to the weekly AAII sentiment survey reported as bullish. This week’s bullish sentiment reading came in at 48.06%, which was down just slightly from 49.07% last week. While lower in the past week, bullish sentiment remains elevated in the top decile of readings over the past decade. Granted, it is also still below the high of 55.84% from November 12th. Similarly, the Investor Intelligence survey of equity newsletter writers also saw bullish sentiment drop slightly, falling from 64.7% to 64.4%. But again just like the AAII survey, that is a historically elevated level in the top 3% of all readings since 1963.

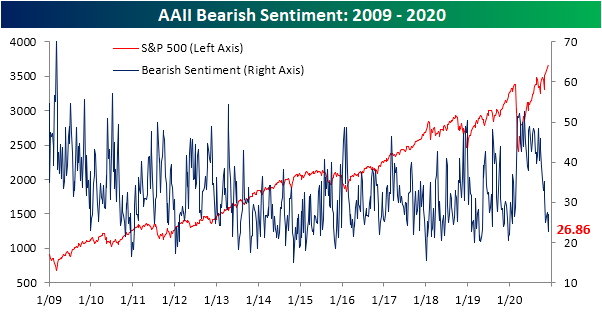
With bullish sentiment lower, a higher percentage of investors reported as bearish. Whereas last week saw bearish sentiment fall to 22.66%, the lowest level since the first week of 2020, this week bearish sentiment rose 4.2 percentage points to 26.86%. That is still below the reading of 27.47% from the last week of November and at the low end of the past few years’ range. In terms of bearish sentiment, the Investors Intelligence survey is again echoing these results. This survey saw bearish sentiment rise 0.1 percentage points to 16.8%.

Overall, sentiment remains heavily in favor of bulls. As shown below, for both the AAII and Investors Intelligence surveys, the bull-bear spreads are at historically high levels.Click here to view Bespoke’s premium membership options for our best research available.


Chart of the Day: Quanta Services (PWR)
Claims Back on the Rise
Over the past few weeks, initial jobless claims have seen a subtle drift higher though last week saw a return back towards the lows of the pandemic. This week the rise in claims resumed. Claims were expected to rise once again from 712K up to 725K, but the increase was far larger than expected with an increase to 853K. Last week’s print was also revised up by 4K to 716K. Back above 850K, this week’s initial jobless claims number was the highest since the week of September 18th. Meanwhile, the week over week increase of 137K was even more notable. Topping the 133K increase from mid-August, it was the largest uptick since the 3.56 million spike back in the last week of March.
Taking a deeper dive into the numbers, a week over week increase in claims could be observed across a vast majority of the nation as the only states and territories to report declines were Alabama, Louisiana, Kentucky, Michigan, Oregon, and the Virgin Islands. The states that reported the largest increases include some of the most populous like California (+47.454K), Illinois (+31.468K), Texas (+19.871K), and New York (+17.528K). Again, they are some of the most populated states, but these four together accounted for more than half of the nation’s overall increase.

On a non-seasonally adjusted basis, the number was even higher at 947.5K. As we have been highlighting over the past couple of months, a seasonal drift higher is the norm for this time of year. For example, historically, the current week of the year (49th week) has seen claims rise WoW 81.5% of the time with the average size of that increase 82.15K, but this week’s increase was far larger at 229K. That brings claims to the highest level since the final week of July while the WoW uptick was the largest since the massive increases in March.

With the addition of the Pandemic Unemployment Assistance (PUA) program, on a combined basis, claims are still at their highest level since the week of September 18th, totaling 1.375 million this week versus 1.443 million back in September. Both regular state claims and PUA claims experienced significant upticks. For PUA claims, the 139.38K increase week over week was the largest increase since a 140.19K climb during the last week of August. In other words, the significant rise in claims this week has been geographically broad and across multiple programs.

Given continuing claims are lagged an additional week, that surge in initial claims is unrepresented in the most recent continuing claims print. Despite this, the number for regular state claims for the final week of November nonetheless was disappointing. Seasonally adjusted continuing claims rose to 5.757 million from 5.52 million. That was also worse than the expected decline to 5.21 million. While higher, continuing claims are not at any sort of multi-month high like initial claims. This week’s print of 5.757 million is actually still below the 6+ million levels from just two weeks prior. So while claims disappointed, they were still at healthier levels than the past several months.

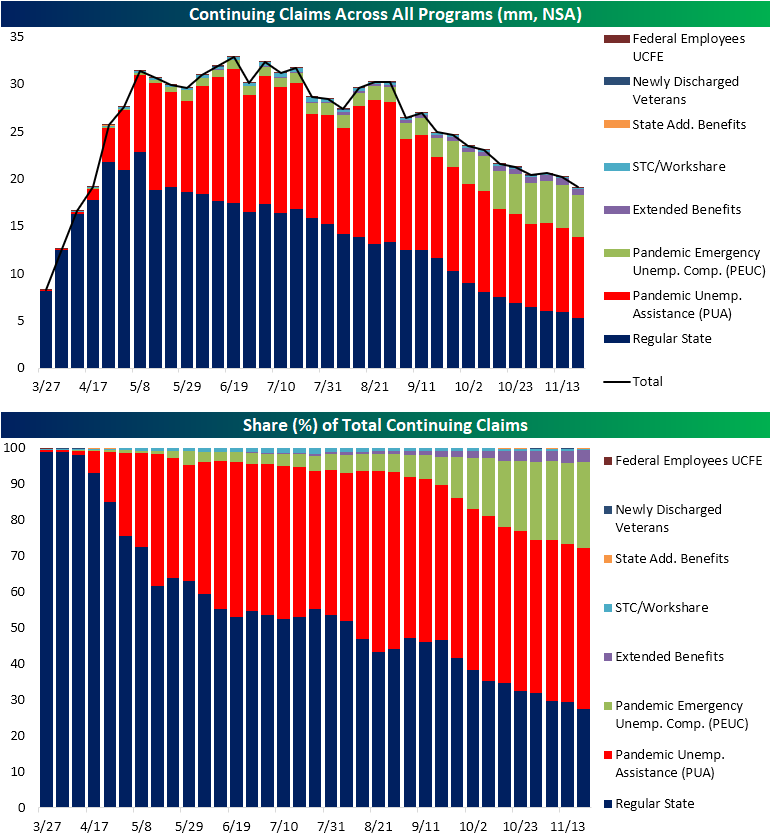
Including continuing claims across all programs adds yet another week’s lag to the data meaning the most recent data is through the week of November 20th and again would not reflect the most recent uptick in initial claims. For the first time since the early days of the pandemic (the week of April 17th), claims across all programs fell below 20 million. Regular state claims (-683K) and PUA claims (-313.7K) drove the bulk of the decline, but every other program also fell. Programs for extensions like PEUC claims and Extended Benefits both improved on the week, but were still above levels from the week prior. As a result of the moves, extension programs’ share of total continuing claims continued to rise through the week of November 20th. PEUC and Extended Benefits together accounted for 27% of total continuing claims, a pandemic high. Click here to view Bespoke’s premium membership options for our best research available.
Bespoke’s Morning Lineup – 12/10/20 – Tech Trouble
See what’s driving market performance around the world in today’s Morning Lineup. Bespoke’s Morning Lineup is the best way to start your trading day. Read it now by starting a two-week free trial to Bespoke Premium. CLICK HERE to learn more and start your free trial.
A fool and his money are soon parted.” – Thomas Tusser
After a disappointing reversal yesterday, Technology and the Nasdaq are under moderate pressure this morning as shares of Airbnb (ABNB) are set to start trading today. In economic news, initial jobless claims came in higher than expected (853k vs 725K estimate) while continuing claims also topped forecasts coming in at 5.75 million versus forecasts for a level of 5.21 million. In inflation news, CPI topped forecasts as both headline and core CPI came in at 0.2% versus forecasts for an increase of 0.1% in both indices. All in, not a good slate of economic data.
Be sure to check out today’s Morning Lineup for updates on the latest market news and events, global central bank moves, an update on the latest national and international COVID trends, and much more.
As mentioned above, investors/traders with a focus on the Technology sector and Nasdaq woke up today still feeling a bit apprehensive about current prices. As illustrated in the intraday chart for the Nasdaq, that index broke its short-term uptrend that had been in place since the days prior to Thanksgiving. If the selling for the Nasdaq continues in the days ahead, look for support to come into play right around the 12,000 level (~3% below current levels).

While the Nasdaq broke a short-term uptrend, small caps continued to hold their trend. In the case of the Russell 2000, that index actually saw a modest bounce late in the day Wednesday as it traded down to its December uptrend line. If that uptrend breaks, look for support to come in around 1,850 (again around 3% below current levels).

Varied Sector Performance By Market Cap
It’s been quite a ride for small-cap stocks this year. The chart below shows the relative strength of the Russell 2000 (small caps) versus the S&P 500 (large caps) since the start of 2018. Heading into the pandemic, underperformance on the part of small caps was nothing new, but just as the pandemic accelerated a lot of trends already in place, it also exacerbated the underperformance of the small caps. From the S&P 500’s high on 2/19, small caps cratered on both an absolute and relative basis. By March 18th, the Russell 2000 bottomed in terms of its performance relative to the S&P 500, but the downside move which lasted only a month took a lot longer in the opposite direction as it wasn’t until eight months later that the relative strength of the Russell 2000 versus the S&P 500 rebounded back to its level from 2/19. Since erasing all of its post-2/19 losses, though, small caps have continued to outperform.

In terms of the sectors driving the rally in small caps, there have been some big moves, and it hasn’t necessarily been the same sectors that have performed the best in the large-cap space. The table below shows the performance of S&P 500 and Russell 2000 sectors since the Russell 2000’s relative strength versus the S&P 500 bottomed on 3/18. First of all, the only small-cap sector which has outperformed its large-cap peer is Communication Services, whereas Consumer Discretionary, Energy, and Health Care have all outperformed their large-cap peers by more than 75 percentage points.
Starting with the sectors whose performance ranks have been similar in both indices, Consumer Discretionary has been the top-performing sector regardless of market cap while Utilities has been the worst-performing sector in both the S&P 500 and Russell 2000. Other sectors that have similar performance ranks within both market cap groups are Industrials, Materials, and Real Estate. In terms of the differences between market caps, the three that stand out the most are Communication Services (6th best in S&P 500, 10th best in Russell 2000), Health Care (8th S&P 500, 4th in Russell 2000), and Consumer Staples (10th in S&P 500 and 7th in Russell 2000). When it comes to sector allocation, market cap is often overlooked, but within the small and large-cap spaces, sector leadership often varies widely. Start a two-week free trial to Bespoke Institutional for instant access to all of our research and interactive tools.

Pandemic Potables: How Americans Are Drinking Away COVID
It’s been quite a year for at-home drinkers. BEA data shows that alcohol sales at home have surged, with all categories up mid-double digits annualized YTD through October. While alcohol sales at restaurants and bars are down 14% YTD, consumers have been making up for it by quaffing vast quantities at home. Spirits sales are up 22.5%, wine sales are up 19.8%, and beer is up 17.7% (all annualized, YTD). This analysis was first published last night in Bespoke’s end-of-day note, The Closer. Click here to start a free trial to Bespoke Institutional and receive our daily Morning Lineup for the next two weeks, featuring more commentary and data on macro markets.

Typically, American spending on alcohol outside the home is almost 45% of total, but this year it’s in the mid-30% range thanks to COVID. Another notable shift is the preference for sprits: they’re at the joint-highest share of at-home alcohol spend in recent memory. Wine share of spend hasn’t moved that much, while take-home beer spending hit a new low this year as Americans favor the harder stuff or grape juice over brews.
