Bullish Sentiment Back Above 50% But Is That A Good Thing?
With the NASDAQ has put in a lower high and the Russell 2,000 touched the technical definition of a correction intraday today, sentiment has turned the other cheek. The AAII’s reading on bullish sentiment rose two percentage points moving back above 50% this week. Bullish sentiment is now at its highest level since the week of November 12th.

Since the AAII survey began in the late 1980s, there are plenty of instances (191 weeks) in which bullish sentiment has come in above 50%. As shown below, generally higher readings on bullish sentiment have resulted in weaker returns than when sentiment holds a more pessimistic outlook.
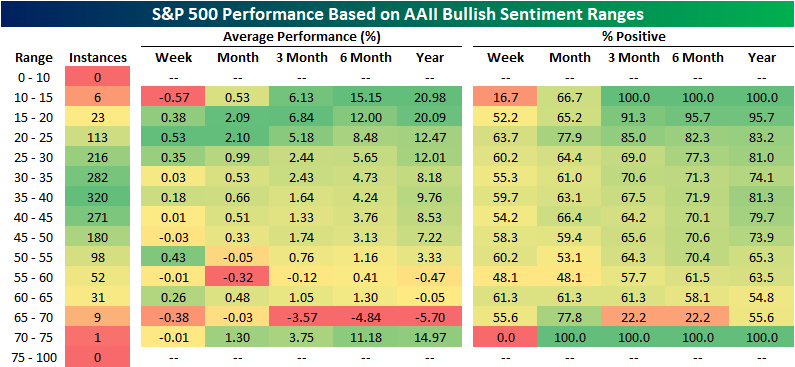
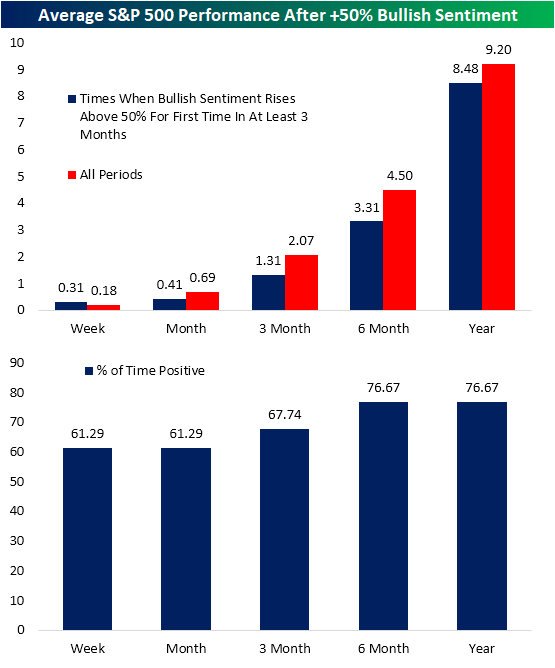
Given this, in the charts below we show the average performance of the S&P 500 in the weeks and months after bullish sentiment comes in above 50% for the first time in at least 3 months. Across those 31 past instances, while the index is frequently higher with positive returns better than three-quarters of the time six and twelve months later, the size of those gains are smaller than the norm. Only the one-week period has managed outperformance versus all periods with a 31 bps gain rather than the 18 bps gain for all other periods.
While a higher number of respondents reported as bullish, only 20.6% reported as bearish. That is the lowest level for bearish sentiment since December 2019 when it was only 0.1 percentage points lower than it is now. That is also the first time that less than a quarter of respondents have reported as bearish for three consecutive weeks since another three-week streak ending in the first week of 2020.

Given the high level in bullish sentiment and low level of bearish sentiment, the bull-bear spread rose back above 30 for the first time since the week of November 12th when it stood slightly higher at 30.97.

While both bullish and bearish sentiment are at notable levels, there was not a very large change in the percentage of respondents reporting as neutral. That reading rose only 1 percentage point to 28.5%. That leaves it right in the middle of its recent range. As recently as the first week of March this reading stood several percentage points higher at 34.4% whereas it is nearly equally as far away from its lows from early January.Start a two-week free trial to Bespoke Institutional to access our interactive economic indicators monitor and much more.

Claims Come In At A New Low for the Pandemic
It took almost a year, but seasonally adjusted initial jobless claims have finally moved back below their pre-pandemic record level of 695K set in October 1982. At the lowest level in a year, this week’s print came in below expectations of 730K at 684K. That was a 97K decrease from last week’s upwardly revised level of 781K and the largest week over week decline since the week of February 19th when claims fell by just 1K more. We would also note that in this week’s release the BLS announced this will be the last week before revisions to the seasonal factors are made meaning next week the series will likely look slightly different as a result of those revisions.

On a non-seasonally adjusted basis, claims likewise improved dramatically. Regular state initial claims fell by just over 100K to 656.8K this week. Not only is that the lowest level for regular state claims in a year, but it was also the third-lowest reading on record for the Pandemic Unemployment Assistance (PUA) Program. The only lower weekly readings in PUA claims occurred in the very first week that they were introduced (April 17th, 2020) and the first week of 2021 when there were some lapses due to the signing of the spending bill. On a combined basis, total initial jobless claims between the two programs fell back below 1 million for the first time of the pandemic. As for the individual states that drove those declines, California, Illinois, and Ohio (which is an unwind of some very elevated levels for the state recently) saw some of the largest declines across both regular state and PUA programs. In regards to just the PUA programs, Indiana and Oregon also were large contributors to that decline.

Continuing claims are lagged one week to initial claims so the most recent print for the week of March 12th would not reflect that big drop in the most recent initial claims data. Nonetheless, seasonally adjusted continuing claims have extended the declines that have consistently come over the past several months. In fact, of the past half-year (26 weeks), there have only been two times that the continuing jobless claims were not lower week over week. This week’s decline marked a tenth consecutive week that claims were lower. Falling to 3.87 million, the current reading is the lowest of the pandemic and is now “only” about 2 million above levels from prior to the start of the pandemic.

Including all auxiliary programs adds an additional week’s lag to the data meaning the most recent data as of the first week of March would again not reflect the big drop in initial claims this week. As of the most recent data for the first week of March, total claims across all programs rose slightly to 18.99 million from 18.253 million at the end of February. That continues to be a somewhat elevated reading relative to the past few months though the recent drops in initial claims could mean that there is certainly potential for improvement on the horizon.
Pandemic Emergency Unemployment Compensation (PEUC) claims were the biggest contributor to that uptick as claims from that program rose 734.69K. While this data predated it, the signing of the American Rescue Plan Act extended this federal program through September after it was supposed to end in mid-March. This program in particular extends benefits once they have expired. That means the increase in continuing claims comes from people who have been long-term unemployed. In fact, of all continuing claims, those from the PEUC program accounted for 29.2% which is a new high for the pandemic. Combined with other extension-type programs like Extended Benefits, that share is also at a new high of almost 35% of all claims. Click here to view Bespoke’s premium membership options for our best research available.


Chart of the Day: Bond Bid All About Balance
Bespoke’s Morning Lineup – 3/25/21 – Hideout in Defensives
See what’s driving market performance around the world in today’s Morning Lineup. Bespoke’s Morning Lineup is the best way to start your trading day. Read it now by starting a two-week free trial to Bespoke Premium. CLICK HERE to learn more and start your free trial.
“Experience is a good school. But the fees are high.” – Heinrich Heine
It’s not looking like a particularly positive day for risk assets extending what has already been a painful week. Equity futures were higher earlier but have given up all of their gains are now firmly in the red. Bitcoin prices have also been on the decline falling by more than 7%. Oil prices are lower and the 10-year yield is unchanged. There’s a lot of economic data and Fed-speak on the calendar today, so be on the lookout for headlines related to these events.
Be sure to check out today’s Morning Lineup for updates on the latest market news and events from the US and around the world, including a discussion of recent confidence surveys from major global economies, the latest US and international COVID trends including our series of charts tracking vaccinations, and much more.

It’s been a rough week in the equity market as all of the major US indices are down by a minimum of 1.5% over the last five trading days. Indices holding up the best have been the Dow and S&P 100, which is comprised of the 100 largest stocks in the market. At the other end of the spectrum, small-cap stocks have been hit hard. The Russell 2000 is down over 8%, and the Micro-Cap Index is down nearly 11%.
Within individual sectors, there hasn’t been much shelter either. Energy has been the leading sector YTD with a gain of over 30%, but it has also declined more than 4% in the last 5-trading days. Along with Energy, Consumer Discretionary and Communication Services haven’t been nearly as strong YTD, but that hasn’t made them immune to weakness as both sectors are down over 3%. The only areas of strength in the last five trading days have been the defensive sectors like Utilities and Consumer Staples which have both managed to rally more than 1%.

Chart of the Day – A First for the Russell 2000
Bespoke’s Morning Lineup – 3/24/21 – Nasdaq Leads Again as Yields Remain Stable
See what’s driving market performance around the world in today’s Morning Lineup. Bespoke’s Morning Lineup is the best way to start your trading day. Read it now by starting a two-week free trial to Bespoke Premium. CLICK HERE to learn more and start your free trial.
“It’s not whether you’re right or wrong that’s important, it’s how much money you make when you’re right and how much you lose when you’re wrong.” – George Soros
Nasdaq futures are leading the way higher this morning as yields stabilize. Crude oil is also rebounding and bitcoin is on the rise as we head into the final week of the quarter.
Be sure to check out today’s Morning Lineup for updates on the latest market news and events from the US and around the world, including a discussion of Intel’s announcement last night, an update on the latest Markit flash PMI readings for the month of March, equity performance in Asian benchmark indices, the latest US and international COVID trends including our series of charts tracking vaccinations, and much more.
Tuesday was a brutal day for the Russell 2000 as it fell more than 3.5% for its worst day in nearly a month. With that decline, the small-cap benchmark also closed below its 50-day moving average for the first time since the end of October.

At 96 trading days, the Russell 2000’s streak of closes above its 50-day moving average was the second streak of more than 90 trading days in the last year and also the longest streak in a decade (March 2011). As shown in the chart below, while streaks of 90 or more trading days have been relatively uncommon in the last decade, prior to that there were numerous streaks lasting much longer than 100 trading days.

Shipments Drive the Richmond Fed Higher
The Richmond Fed’s Manufacturing Activity Index rose to 17 in March after readings of 14 over the prior two months which had been the weakest readings since last July. At 17, this month’s reading was the strongest since December pointing not only to further growth but also an acceleration in the region’s manufacturing activity.

Across sub-indices, almost everything continues to show expansionary readings although there are a few exceptions for things like inventories and availability of skills; neither of which are necessarily bad signs for activity. As for the month-over-month changes, things were perhaps a bit more mixed with five of the eighteen categories lower and another two unchanged. Expectations also generally improved across categories though the actual levels of most of these indices are generally at the lower end of their historic range. In all, the report showed orders continue to grow with inventories being drawn upon at a record pace. Prices (including wages given labor market tightness) are also increasing at a historic rate.
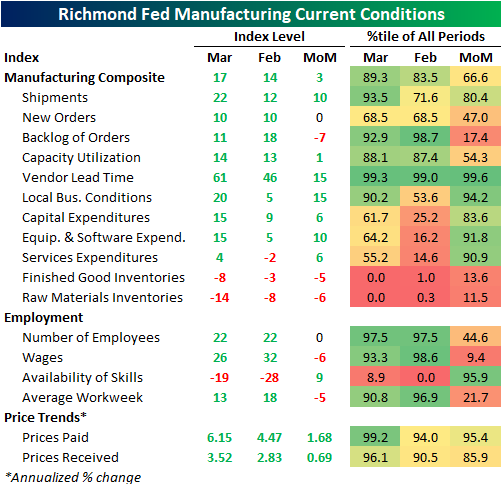

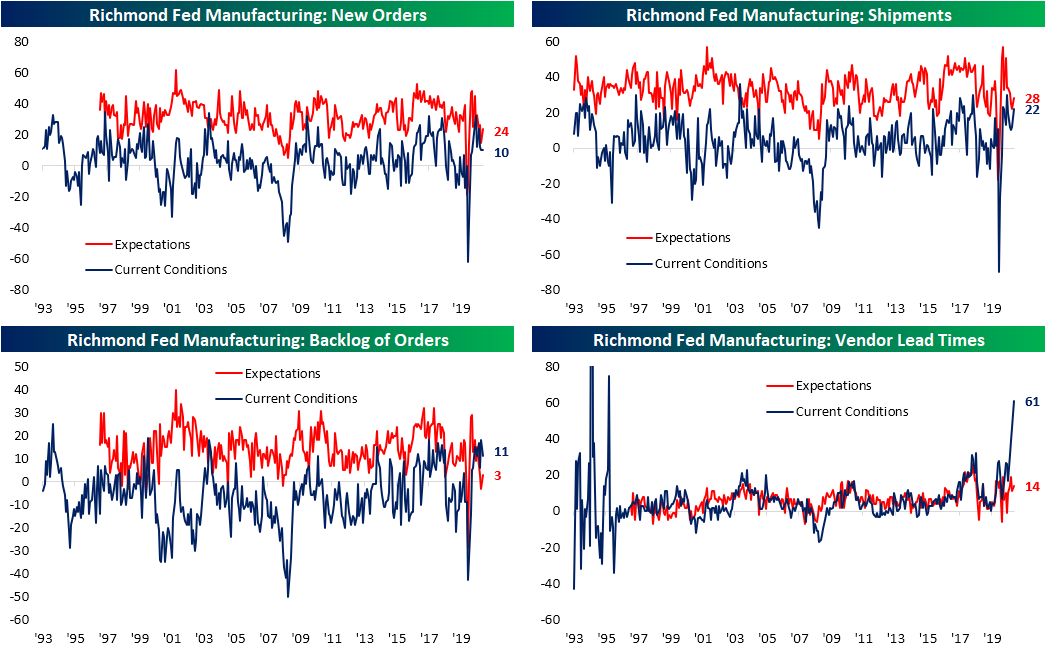
The main driver of the uptick in the headline number (which is a composite of Shipments, New Orders, and Employment) was the increase in Shipments which offset the unchanged readings in the other two components. That index gained 10 points to 22 in March. That was both the biggest one-month gain and the highest level for this index since October and leaves it in the top decile of readings throughout the index’s history. Although Shipments were higher, New Orders remain off their highs from a few months ago going unchanged in March. With Shipments on the rise and new demand steady, the Backlog of Orders decelerated as the index fell 7 points. But even with that decline, the current reading still stands in the top 10% of readings. One surprising point about the uptick in Shipments was that it also coincided with a historically high reading in Vendor Lead Times. Higher readings in this index indicate that it takes longer for products from suppliers to reach their destination. In other words, supplier delays have not yet appeared to slow down manufacturers getting products out the door.
While supplier delays aren’t slowing things down yet, inventories are being drawn upon at a record rate. Both indices for final good and input inventories fell to record lows in March.

Meanwhile, prices for both inputs and receivables continue to accelerate. Prices Paid rose at a 6.15% annualized pace. That is the third-highest reading on record behind October 2018 and June 2008. Expectations for Prices Paid are at the highest point in over a decade and the seventh-highest level on record. Prices Received are rising at a slower clip, 3.52% annualized, but this too is around one of the highest levels in recent years.

As for another input, Wages, there was a six-point decline in the current conditions index in March. Even though that is in the bottom 10% of monthly moves, the index is still at a historically strong level. As the report also continues to show a lack of skilled workers, expectations for Wages were much higher. That index rose to 57 which is the highest level since May 2019. Prior to that, you would need to go back to March and February of 2000 to find as high of a reading. Click here to view Bespoke’s premium membership options for our best research available.

Chart of the Day – Historically Bad Quarter for Long-Term Treasuries
Bespoke’s Morning Lineup – 3/23/21 – Nasdaq Outperforming Again
See what’s driving market performance around the world in today’s Morning Lineup. Bespoke’s Morning Lineup is the best way to start your trading day. Read it now by starting a two-week free trial to Bespoke Premium. CLICK HERE to learn more and start your free trial.
“In a wicked world, relying upon experience from a single domain is not only limiting, it can be disastrous.” – David Epstein – Range
US equity futures are shaping up a lot like Monday where the Nasdaq is leading the way, although unlike yesterday where all three major averages were higher on the day, so far it’s just the Nasdaq. Treasury yields and crude oil are both trading lower to start the day as rising COVID cases in Europe have dampened risk appetite.
In Fed news, Dallas Fed President Robert Kaplan was on CNBC earlier and said he sees inflation for 2021 coming in at a rate of 2.25% to 2.50% but sees the rate of price increases declining again in 2022. Kaplan is only the first of many Fed officials, including Powell, scheduled to speak today, so expect a lot of headlines on that front.
Be sure to check out today’s Morning Lineup for updates on the latest market news and events from the US and around the world, including a discussion of the recent moves in rates, equity performance in Asian benchmark indices, the latest US and international COVID trends including our series of charts tracking vaccinations, and much more.
The Philadelphia Semiconductor Index (SOX) has been in a relatively steady downtrend since its high in early February. Last week the SOX briefly traded and closed above that downtrend but quickly reversed back below. Yesterday, the SOX’s rally to kick off the week not only brought the index back above its 50-DMA and downtrend line, but it was also the first time that the index opened and traded above that downtrend line for the entire trading session. The SOX has still underperformed the broader market by a relatively wide margin over the last month, but if it’s going to get back on track, it has to start somewhere.
