The Bespoke 50 Growth Stocks — 5/19/22
The “Bespoke 50” is a basket of noteworthy growth stocks in the Russell 3,000. To make the list, a stock must have strong earnings growth prospects along with an attractive price chart based on Bespoke’s analysis. The Bespoke 50 is updated weekly on Thursday unless otherwise noted. There were no changes to the list this week.
The Bespoke 50 is available with a Bespoke Premium subscription or a Bespoke Institutional subscription. You can learn more about our subscription offerings at our Membership Options page, or simply start a two-week trial at our sign-up page.

The Bespoke 50 performance chart shown does not represent actual investment results. The Bespoke 50 is updated weekly on Thursday. Performance is based on equally weighting each of the 50 stocks (2% each) and is calculated using each stock’s opening price as of Friday morning each week. Entry prices and exit prices used for stocks that are added or removed from the Bespoke 50 are based on Friday’s opening price. Any potential commissions, brokerage fees, or dividends are not included in the Bespoke 50 performance calculation, but the performance shown is net of a hypothetical annual advisory fee of 0.85%. Performance tracking for the Bespoke 50 and the Russell 3,000 total return index begins on March 5th, 2012 when the Bespoke 50 was first published. Past performance is not a guarantee of future results. The Bespoke 50 is meant to be an idea generator for investors and not a recommendation to buy or sell any specific securities. It is not personalized advice because it in no way takes into account an investor’s individual needs. As always, investors should conduct their own research when buying or selling individual securities. Click here to read our full disclosure on hypothetical performance tracking. Bespoke representatives or wealth management clients may have positions in securities discussed or mentioned in its published content.
End in Sight For Philly Supply Chain Stress?
On the backs of a disappointing Empire Fed earlier this week, the neighboring Philadelphia Federal Reserve Bank’s own reading on its region’s manufacturing economy also came in well below expectations at the headline level. The index for General Business Conditions was anticipated to decline from a healthy reading of 17 to a more modest 15. Instead, it plummeted to a barely positive reading of 2.6. That would point to a significant moderation in activity in the month of May.
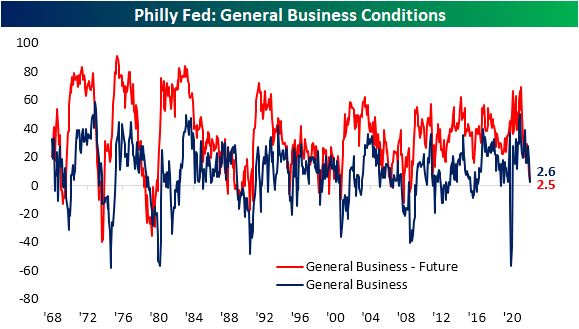
While the headline index fell sharply, the rest of the report was perhaps more mixed. Breadth was certainly weak with only three categories rising month over month (New Orders, Shipments, and Unfilled Orders). As for the indices that declined, on the one hand, some could be perceived as welcome drops with pullbacks in elevated readings of prices and delivery times. On the other hand, the moderation in Number of Employees or CapEx expectations could be taken as a less positive sign for the broader economy.

As shown in the table above, overall most current conditions indices remain historically elevated even after recent declines. Expectations indices meanwhile are generally more depressed with some readings even near record lows. As such, the average normalized distance between the current conditions and expectations categories throughout the report have broken out to the highest level since February 1988 and mid-1975 before that. Put differently, there have rarely been times in which the region’s manufacturers have reported such a dramatic difference between healthy current conditions while also holding a pessimistic outlook.

Taking a closer look at individual categories, New Orders remain well off-peak but ticked higher in May rising 4.3 points to 22.1. There was an even larger jump in expectations, although the level of that index is not nearly as elevated. The modest increase in demand was met with a huge jump in Shipments and Unfilled Orders. With a 16.2 point jump month over month, Shipments are reported to be growing at the fastest rate since the fall of 2020. Given the region’s firms are getting orders out the door at a faster clip, inventories are growing only modestly with that index falling to a barely expansionary 3.2. Additionally, that evidence of improved fulfillment also resulted in a huge drop in expectations for Unfilled Orders. In fact, that index dropped to the lowest level since March 1995. That means the region’s firms expect to work off unfilled orders at a historic rate in the coming months.

The likely reason as to why companies are anticipating such a huge improvement in fulfillment is massive expected declines in lead times. Delivery Times remain elevated but have moderated significantly in the past couple of months. Six-month expectations meanwhile have fallen all the way down to -29.1 which, like unfilled orders expectations, is the lowest level since March 1995.

Another expectations reading that has fallen precipitously in May is CapEx expectations. The reading fell to the worst reading since September 2016 indicating huge moderation in planned investment. Likewise, hiring is expected to slow as has already been observed by the current conditions index. We would note that these readings remain positive, meaning firms are still expecting to take on more hiring and spending on net, but at a more modest rate. Click here to learn more about Bespoke’s premium stock market research service.

Sentiment Little Changed – Still Bearish
Depending on when a respondent reported their answers to the weekly AAII sentiment survey, they could have been justified in giving either bullish or bearish. From last Thursday’s close to Tuesday, the S&P 500 rallied a little more than 4% but anyone reporting yesterday would have reflected the index giving back all of those gains in a single session. Given that back and forth of equities, sentiment remains little changed. Around a quarter of respondents remain in the bullish camp as has now been the case for three weeks in a row. Albeit a historically low reading, it is a major improvement from readings in the mid-teens only one month ago.

Bearish sentiment meanwhile ticked higher and back above 50% this week. As with bullish sentiment, that is an overwhelmingly pessimistic reading even if it is less extreme than last month when it closed in on a 60% reading.

The bull-bear spread in turn was marginally improved rising from -24.7 to -24.4 indicating sentiment stays heavily slated toward pessimism.
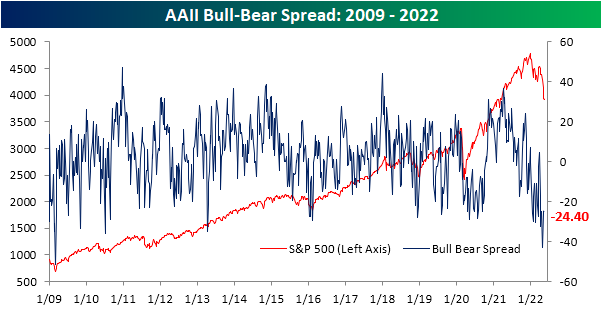
With both bearish and bullish sentiment gaining share this week, the percentage of respondents reporting neutral sentiment fell back below 25% to 23.6%. Click here to learn more about Bespoke’s premium stock market research service.

Chart of the Day: Death By Amazon? More Like Death With Amazon.
Continuing Claims Keep Falling
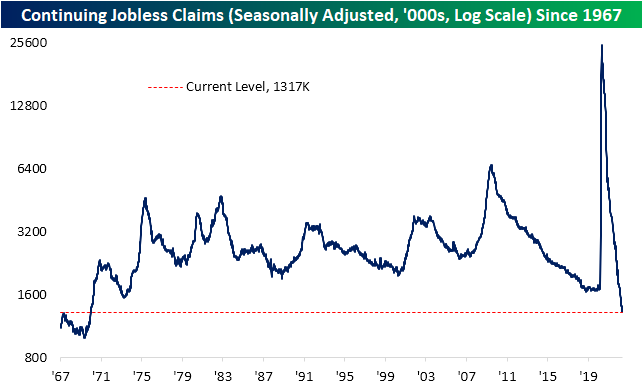
Jobless claims have continued to tick higher with this week’s reading rising to 218K. That is an increase of 21K versus last week’s print which was revised back below 200K to 197K. That leaves the seasonally adjusted number at the highest level since January. While there has not been any further improvements, the actual level of claims remains well below the standard historical range near similar levels to the couple of years prior to the pandemic.

Historically, unadjusted claims have fallen week over week more than three-quarters of the time in the current week of the year. However, this year was not one of those occasions as claims rose to 198.7K. While that is not any sort of dramatic increase, it is a somewhat unusual rise a little ahead of when claims have tended to experience a seasonal bottoming out. Looking ahead to the next couple of weeks, claims could see further marginal improvements before resuming a move higher through the early summer.

Continuing claims—which are delayed an additional week to the initial claims number—have been healthier than initial claims as the reading has made yet another multi-decade low per the latest release. Continuing claims are now down to 1.317 million. As low of a reading has not been observed since the last week of 1969. Combined with the uptick in the initial claims number, claims data points to moderating, albeit historically impressive, readings on the number of people filing for unemployment. Click here to learn more about Bespoke’s premium stock market research service.
Post-COVID Gains for Small-Cap Growth Go Poof!
Growth stocks outperformed value stocks by a wide margin in the years leading up to the pandemic. Growth also outperformed value in the first ~18 months after the pandemic, but that trend has been flipped on its head since late 2021. You can see the recent convergence between growth and value in the chart below. Entering 2022, the S&P 500 Growth index was outperforming the S&P 500 Value index by ~40 percentage points since the pre-COVID high for the stock market in February 2020. Now, Growth is only outperforming Value by ~8 percentage points.

The shift from growth to value has been even more dramatic in the more economically sensitive small-cap space. Remarkably, the Russell 2,000 Growth index is now DOWN 6% on a total return basis since the pre-COVID peak for stocks on 2/19/20. Six months ago, this index was still up 45% from its pre-COVID high.
Fed Chair Powell first shifted to a tighter monetary stance in November 2021. In just six months since Powell’s pivot, we’ve seen the entire post-COVID bull market for small-caps give up its gains and then some. And this doesn’t even factor in a double-digit percentage point increase in inflation since COVID began that pushes “real” returns for the Russell 2,000 Growth index much deeper into negative territory. Click here to learn more about Bespoke’s premium stock market research service.

Stocks Below Pre-COVID Highs – 5/18/22
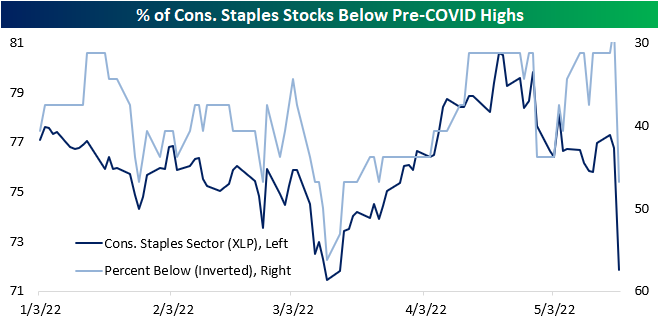
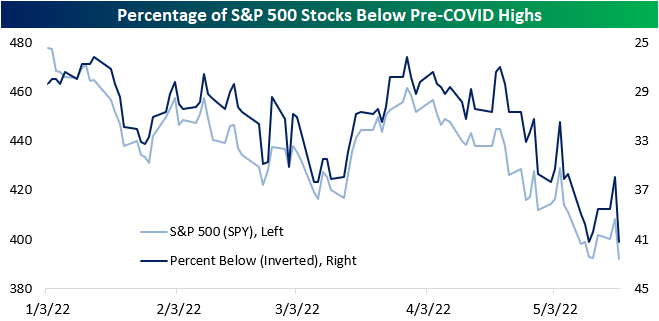
Last week, we outlined the percentage of stocks in each S&P 500 sector that had fallen below their pre-COVID highs to show that many of the stocks that surged due to pandemic effects have significantly fallen off, netting long-term holders a negative return since the onslaught of the pandemic. (Read it here.) Yesterday, the S&P 500 fell by over four percent to set a new 52 week low, breaking the 4,000 level. The index is still up over 15% relative to its pre-COVID high, but as of yesterday’s close, 41.2% of S&P 500 members were below their respective pre-COVID highs, as 26 members crossed below this critical level yesterday.
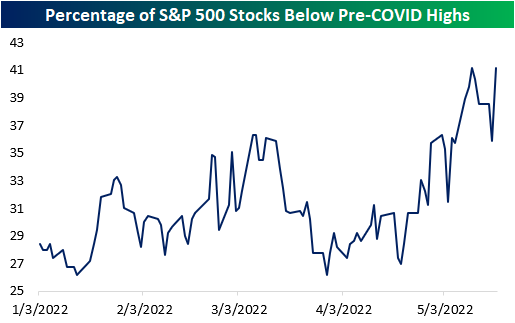
Notably, six of the 32 S&P 500 consumer staples stocks crossed below, moving the percentage from 28.1% to 46.9% on the back of weak earnings reports from Walmart (WMT) and Target (TGT). 66.7% of Communication Services stocks and 60.0% of Real Estate stocks in the S&P 500 are below their pre-COVID highs, but only 18.5% and 23.8% of Materials and Energy stocks are below this level, respectively. Additionally, 8.2% of S&P 500 members were within 5% of their pre-COVID highs, and 15.1% are within 10%.
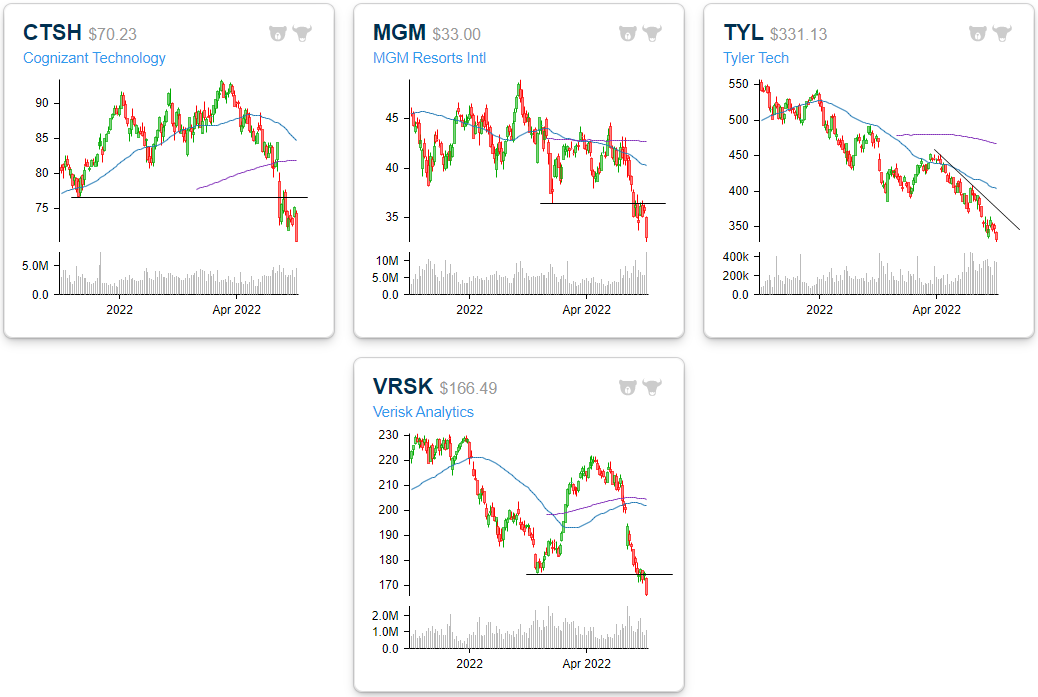
Four S&P 500 stocks crossed below this critical level for the first time in a while yesterday: Cognizant Technology (CTSH), MGM Resorts (MGM), Tyler Tech (TYL) and Verisk Analytics (VRSK). This comes amidst weakness in the Technology sector (XLK) versus the broader S&P 500, as the sector is down close to 25% on a YTD basis versus the S&P 500’s drawdown of about 18%. However, XLK is still up close to 30% relative to pre-COVID highs.
Additionally, there are three stocks that entered a 2% channel above their pre-COVID highs for the first time in a while. Dexcom (DXCM) entered the channel amidst weakness in the broader energy space, and Pentair (PNR) extended the downtrend that is yet to break. Walmart (WMT) sold off significantly in two consecutive days after a weak earnings report and is now less than 1% from its pre-COVID high. A month ago WMT was 30% above this level. Click here to become a Bespoke premium member today!

Bespoke’s Morning Lineup – 5/19/22 – Negative Follow Through
See what’s driving market performance around the world in today’s Morning Lineup. Bespoke’s Morning Lineup is the best way to start your trading day. Read it now by starting a two-week trial to Bespoke Premium. CLICK HERE to learn more and start your trial.
“It is never too late to be wise.” – Daniel Defoe, Robinson Crusoe

Below is a snippet of content from today’s Morning Lineup for Bespoke Premium members. Start a two-week trial to Bespoke Premium now to access the full report.
After yesterday’s plunge, bargain hunters are nowhere to be found this morning as futures are lower again and indicating losses of nearly 1% at the open. Markets in Asia and Europe were weak overnight but not as bad as it was here yesterday. Treasury yields are lower this morning as investors start to worry more about rising recession risks, and crude oil is lower. One bright spot this morning is bitcoin which is trading up nearly 1%.
On the economic front, initial jobless claims were higher than expected but still extremely low relative to history. Continuing claims were slightly lower than expected while the Philly Fed came in lower than expected (2.6 vs 15.0). The only other reports on the calendar for today (and the week) are Existing Home Sales and Leading Indicators.
In today’s Morning Lineup, we recap overnight trading in Asia and Europe (pg 4), economic data in Asia and Europe (pg 5), and a lot more.
When the levels of uncertainty in the economy reach levels like they are at now, you get days like the last two where the S&P 500’s daily advance/decline (A/D) reading exceeds +400 one day and then falls below -400 the next. Like the CEOs of two of the nation’s largest retailers, investors have no idea what to make of the current environment.
Yesterday was just the 22nd time since 1990 that the S&P 500 had an ‘all’ day (S&P 500 daily A/D reading above +400) immediately followed by a ‘nothing’ day (S&P 500 daily A/D reading below -400). Of those 21 prior occurrences, none occurred before 2007. The chart below shows where each of those back-to-back readings occurred. While there have only been 22 occurrences over the last 30 years, two of them have now happened this month! Overall, though, these back-to-back readings have generally occurred during pullbacks and are an indication of extreme volatility and uncertainty.

Earlier this year when the market was falling, ‘all or nothing’ days were notably missing. The reason was mostly due to the fact that the Energy sector was moving in the opposite direction of the broader market, so when stocks rallied, the energy sector declined and vice versa. In recent weeks, though, we’ve seen the pace of all or nothing days pick up notably. In just the last 20 trading days, there have been eight all-or-nothing days, which is far from a record but certainly at the high end of the historical range.

For the year, there have now been ten all-or-nothing days, which brings the pace for 2022 up to 26. Again, 26 all-or-nothing days for the calendar year would be nowhere near an extreme for a calendar year, but it is still relatively high. Like the temperature, day-to-day volatility is certainly picking up.

Start a two-week trial to Bespoke Premium to read today’s full Morning Lineup.
Retail Roiled
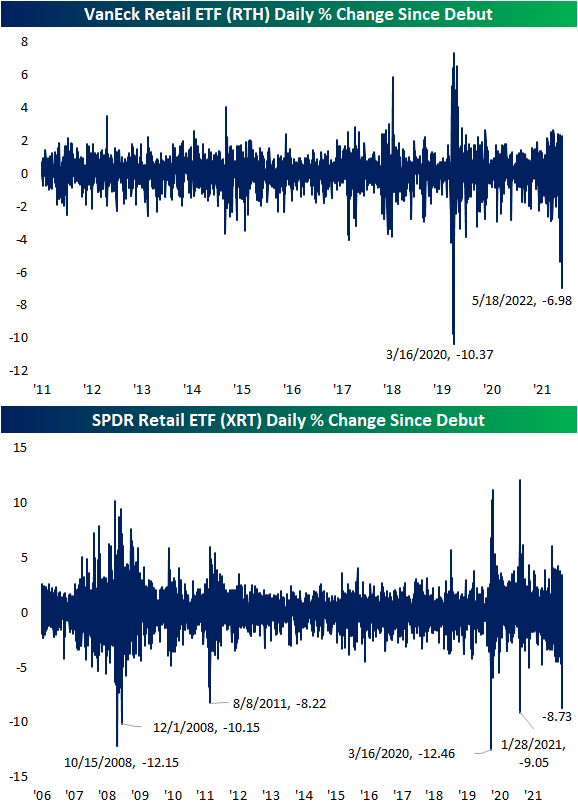
Reactions to the biggest retailer earnings have generally been abysmal this season. Today, Target (TGT) is following in the footsteps of Walmart (WMT) with its worst single-day reaction to earnings on record according to the data in our Earnings Explorer and its worst day overall since the 1987 crash. Given the two are some of the largest publically traded retailers, broad measures of the space are plummeting. As shown below, the VanEck Retail ETF (RTH) is down nearly 7% which puts it on pace for its third-worst day since it began trading in 2011. The only two worse days were in March 2020. Similarly, the SPDR S&P Retail ETF (XRT)—which has both a longer history and a different weighting methodology (equal-weighted)—is down an even more dramatic 8.73% as of this writing. That is on pace to be the seventh-worst day on record.
Of course, there are many different niches in the retail space meaning some areas have held up better than others. Below we show the relative strength lines since the start of 2020 for various S&P 1500 retail sub-industry indices versus the broad market (S&P 1500). The charts are sorted from left to right and top to bottom by largest to smallest market caps.
By far the most striking decline has been the General Merchandise Stores industry which includes names like Walmart and Target. That line essentially shows the group has lost any and all outperformance versus the broader market since the spring of 2020. The relative strength line of specialty stores has also fallen dramatically to the lowest level in over a year. While those brick-and-mortar giants have gotten crushed, the same can be said for internet-based retail, but the drop in this industry actually happened ahead of these others.
Within retail, there are also a couple of pockets that have held up well. For example, Home Improvement Retail is comprised of stocks like Home Depot (HD) and Lowe’s (LOW), and that line is still roughly in its uptrend of the past month and the same goes for Automotive retail in spite of its pullback. The only one making a considerable move higher today is apparel retail. However, the entirety of that move is thanks to TJX Companies (TJX) which is the only stock of the 19 in the industry that is trading higher on the day; TJX is rallying 7.87% on earnings. Click here to learn more about Bespoke’s premium stock market research service.
