Homebuilder Earnings on Deck
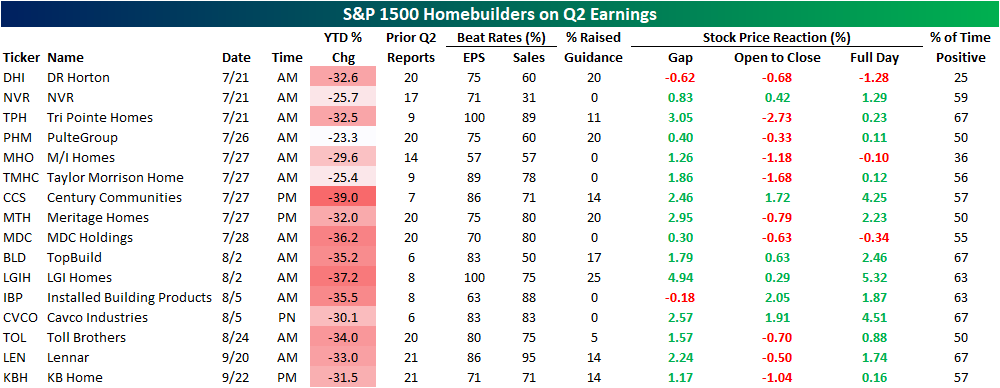
While homebuilder sentiment experienced a historic plunge in the latest reading, homebuilder stocks have actually been on the move higher in today’s session. That brings the total rally off of the June low above 20%, although that is only a dent in the larger decline since late last year. The S&P 1500 Homebuilders group is currently down 31.4% since the December 10th high. Without a coincident drop alongside sentiment, homebuilders continue to hold above their 50-DMA.

Homebuilders are at a bit of a crossroads at the moment as a further move higher would definitively break the past several months downtrend whereas a break back below its 50-DMA would mark a failed breakout similar to what happened earlier this spring. If today is any indication, macro data hasn’t been a particularly strong catalyst for the industry, however, there is a huge slate of earnings in the month ahead. Later this week on Thursday, DR Horton (DHI), NVR (NVR), and Tri Pointe Homes (TPH) are all scheduled to release quarterly results. Of these, DHI has actually averaged some of the worst performance on Q2 earnings of any homebuilder. The stock has averaged a 1.28% decline on its historical Q2 earnings reaction days and positive returns only a quarter of the time. As for other notables, Q2 has tended to be the best quarter of the year for stock price performance of Century Communities (CCS), Installed Building Products (IBP), LGI Homes (LGIH), and NVR (NVR). Click here to learn more about Bespoke’s premium stock market research service.
Pumped For Some Relief
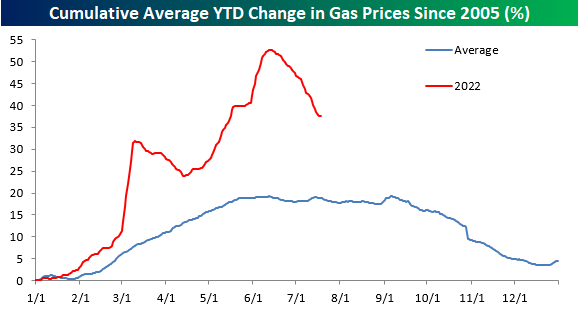
After one of the sharpest YTD surges on record, US consumers have seen a bit of relief at the pump over the last month as gasoline prices, as tracked by AAA, have seen a sharp pullback. The national average price of a gallon of gas currently stands at $4.52, which at any other point in history would have been astronomical, but compared to mid-June when the national average briefly topped $5, current prices seem downright cheap – at least on a relative basis!
The table below shows prices as of 7/18 each year going back to 2005 and where they stood on both a MTD and YTD basis. At $4.52, the national average has never been higher at this time of year, and the only year it was above $4 per gallon on 7/18 was in 2008. On a YTD basis, the average price is still up 37.6%, which is roughly double the average and median YTD gain at this point in the year, but 2021 (40.6%) and 2009 (52.6%) both saw larger YTD increases. One notable aspect of this year so far is that despite the big increases on a YTD basis, this month’s 6.6% MTD decline actually ranks as the largest MTD decline in prices through 7/18.

While the moves this year have been much more extreme than normal, average gasoline prices are following their typical seasonal pattern. Historically, prices tend to peak right around Memorial Day or into early June, and this year’s peak in prices was on June 13th. Granted, this year’s peak (50%+) was much larger than the typical YTD increase leading up to the peak, but the magnitude of the decline in percentage terms has also been steeper than normal. In order to get back down to a more normal YTD pattern, we’re going to need to see continued weakness in prices going forward. But from a seasonal perspective (and barring any hurricanes), there is a tailwind for lower prices. Click here to learn more about Bespoke’s premium stock market research service.
Besides the fact that gas prices hit record levels this year, what has made the period especially painful for consumers is how consistent the increase in prices has been. The chart below shows the y/y change in prices going back to 2005. The current level of 42.71% isn’t necessarily extreme in terms of its magnitude, but what stands out in the chart below is how long the y/y increase has stayed at elevated levels. Back in March 2021, the year-over-year change for gas prices first crossed 30%, and it hasn’t looked back since. When you start lapping 30% y/y increases, it really starts to add up! Let’s hope that this recent dip really starts to have some legs.

Bespoke Brunch Reads: 7/17/22
Welcome to Bespoke Brunch Reads — a linkfest of the favorite things we read over the past week. The links are mostly market related, but there are some other interesting subjects covered as well. We hope you enjoy the food for thought as a supplement to the research we provide you during the week.
While you’re here, join Bespoke Premium with a 30-day free trial!
Labor Markets
Here’s where Tesla’s recently laid-off talent is going by Fred Lambert (electrek)
Workers who have been laid off or otherwise departed Tesla recently has headed to other tech firms, with Rivian, Apple, and Lucid Motors among the biggest recruiters. [Link]
Netherlands Poised to Make Work-From-Home a Legal Right by Lucy Papachristou (WSJ)
Dutch legislation will force employers to consider remote work requests and provide a covered reason denying their request. [Link; paywall]
Food
Learning to Love an Induction Stove by Hannah Goldfield (NYer)
While gas remains a favored cooktop for chefs, home cooks are likely to reduce greenhouse gas emissions, protect their family’s air quality, and reduce cook time. [Link; soft paywall]
Rising prices curb consumers’ taste for chocolate by Maytaal Angel and Jessica DiNapoli (Reuters)
Sweet treats are an easy item to give up for many consumers, especially when high prices for chocolate mean choco-holics are paying out the nose for their fix. [Link]
In Portugal, Taking a Dive Into Sardines by Lily Puckett (NYT)
A look into the very old and very big business of fish canning, an industry dominated by women that is having a moment thanks to foodies’ search for intense and widely available flavors. [Link; soft paywall]
China
Chinese Homebuyers Across 22 Cities Refuse to Pay Mortgages (Bloomberg)
With apartment development timelines dragging out in part due to builders’ financial challenges, owners already on the hook for payments are starting to boycott their loans in protest. [Link; soft paywall]
China Is Stealing Taiwan’s Sand by Elisabeth Braw (FP)
Taiwanese islands close to the mainland regularly see thousands of dredgers and support vehicles trespass with the goal of removing sand for use in a huge range of applications from land reclamation to concrete or glass manufacturing. [Link]
Subscriptions
Instagram now lets creators publish feed posts just for their subscribers by Chris Welch (The Verge)
Content on Instagram can now be pushed exclusively to paid subscribers, following in the steps of Twitter and adding to a similar feature for Stories. [Link]
Netflix Changes Tack With Marketing Spree for $200 Million Film by Lucas Shaw (BNN Bloomberg)
Instead of just letting users discover a new movie, Netflix is actively marketing its new blockbuster (featuring Ryan Gosling) in a bid to re-start subscriber growth and maintain its position within the streaming wars. [Link]
BMW starts selling heated seat subscriptions for $18 a month by James Vincent (The Verge)
The German auto manufacturer is testing a feature that would allow users to pay full freight for heated seats up front or pay less in monthly installments…all to access a feature that comes built into the car but can be turned on or off with software. [Link]
Market Innovation
‘The market is just dead’: Investors steer clear of 20-year Treasuries by Kate Duguid and Colby Smith (FT)
Since being reintroduced in 2020, the 20y Treasury bond has found very little interest from investors as low liquidity and weak real money interest have made it attractive to nobody. [Link; paywall]
Lumber Futures Are Getting a Makeover by Ryan Dezember (WSJ)
In a bid to expand volumes, the CME is reducing the size of its lumber future by 75%, changed the delivery point, and broadened eligible species to allow for more participation on both sides of the contract. [Link; paywall]
Approval
Most Democrats Don’t Want Biden in 2024, New Poll Shows by Shane Goldmacher (NYT)
With President Biden deep underwater in broad polling, a majority of Democrats would prefer someone else in a primary challenge; that said, a failure to renominate a sitting President would be a major shocker in the longer-term history of the US two-party system. [Link; soft paywall]
Too Much of A Good Thing
A new ‘miracle’ weight-loss drug really works — raising huge questions by Hannah Kuchler (FT)
Last year the FDA approved a weight loss drug that led to patients losing 15% of their body weight on average. Its history and approval are controversial: patients will likely need to take it long term at a monthly list price of $1,350. [Link; paywall]
Read Bespoke’s most actionable market research by joining Bespoke Premium today! Get started here.
Have a great weekend!
The Bespoke Report – 7/15/22 – Inversion, Earnings, Oh My!
This week’s Bespoke Report newsletter is now available for members.
Earnings started this week, offering updates from corporate America as economic data and macroeconomic policy points towards a looming recession. Commodity prices have continued on their recent declines, while interest rates have been torn between growth concerns and a Fed that feels pressed to do more amidst high inflation. While consumer and producer prices this week we higher than expected, inflation expectations fell and presented a challenge to how the FOMC will communicate its plans for July rates policy amidst broadening core inflation, falling gasoline prices, volatile expectations numbers from consumer surveys, and big declines for market-based measures. We also discuss growth in China, retail sales data, Canada’s own 100 bps tightening this week, Italian political drama, and more in this week’s Bespoke Report.
To read this week’s full Bespoke Report newsletter and access everything else Bespoke’s research platform has to offer, start a two-week trial to one of our three membership levels.


The Bespoke 50 Growth Stocks — 7/14/22
The “Bespoke 50” is a basket of noteworthy growth stocks in the Russell 3,000. To make the list, a stock must have strong earnings growth prospects along with an attractive price chart based on Bespoke’s analysis. The Bespoke 50 is updated weekly on Thursday unless otherwise noted. There were no changes to the list this week.
The Bespoke 50 is available with a Bespoke Premium subscription or a Bespoke Institutional subscription. You can learn more about our subscription offerings at our Membership Options page, or simply start a two-week trial at our sign-up page.
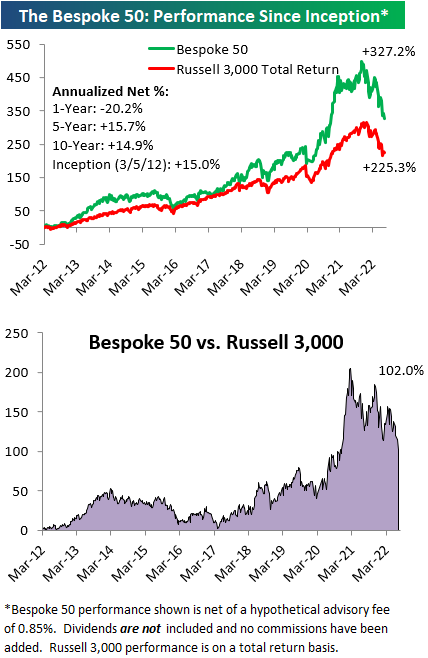
The Bespoke 50 performance chart shown does not represent actual investment results. The Bespoke 50 is updated weekly on Thursday. Performance is based on equally weighting each of the 50 stocks (2% each) and is calculated using each stock’s opening price as of Friday morning each week. Entry prices and exit prices used for stocks that are added or removed from the Bespoke 50 are based on Friday’s opening price. Any potential commissions, brokerage fees, or dividends are not included in the Bespoke 50 performance calculation, but the performance shown is net of a hypothetical annual advisory fee of 0.85%. Performance tracking for the Bespoke 50 and the Russell 3,000 total return index begins on March 5th, 2012 when the Bespoke 50 was first published. Past performance is not a guarantee of future results. The Bespoke 50 is meant to be an idea generator for investors and not a recommendation to buy or sell any specific securities. It is not personalized advice because it in no way takes into account an investor’s individual needs. As always, investors should conduct their own research when buying or selling individual securities. Click here to read our full disclosure on hypothetical performance tracking. Bespoke representatives or wealth management clients may have positions in securities discussed or mentioned in its published content.
Bulls Back Above 25%
In spite of the S&P 500’s consistent declines in the past week as it failed to take out its late June highs, investor sentiment has turned around (relatively speaking) with this week’s reading from the AAII showing 26.9% of respondents reporting as bullish for the first time since early June. The 7.5 percentage point increase in the percentage of bullish responses this week was a large week-over-week increase by historical standards, although there have been multiple even bigger larger weekly increases over the past few months.
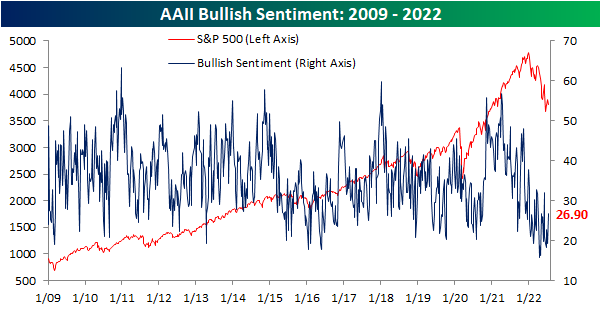
With the increase in bullish sentiment, over a quarter of respondents reported as bullish for the first time in five weeks. Such extended streaks with as depressed readings have been few and far between with the last five-week streak occurring all the way back in the summer of 1993. Overall, there have now only been six streaks in which bullish sentiment remained below 25% for at least 5 consecutive weeks. The longest of these was in December 1990 when it went on for 9 weeks in a row. Albeit a small sample size, historically the end of these streaks have not been raging buy signals for the S&P 500 in the short term with inline performance versus all periods and somewhat weak returns one month out. However, three, six, and twelve months later the S&P 500 has been higher almost every time with slightly stronger than normal performance (six months out from the March 1990 occurrence was the only decline).

The increase in bullish sentiment was met by bears falling back below 50% to 46.5%. Mirroring bullish sentiment, that made for the lowest reading since the first week of June.

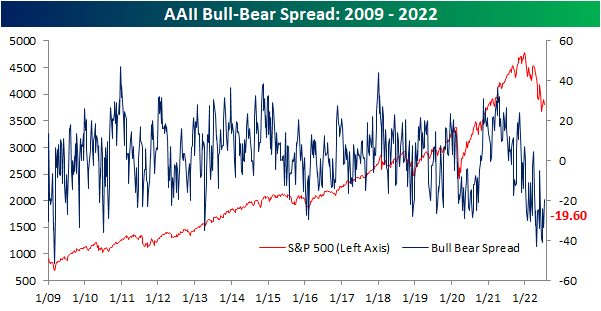
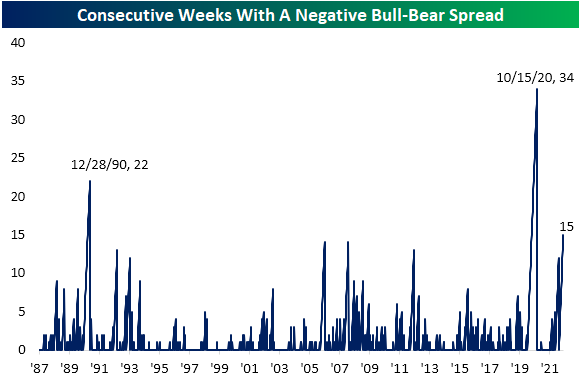
As a result of those moves, the bull-bear spread remains firmly in favor of bears. With the percentage of bearish responses outnumbering bulls by 19.6 points, for the 15th week in a row the bull-bear spread remains negative. That steak has grown to be the third largest on record behind a 22-week streak ending in late 1990 and a 34-week streak ending in October 2020.
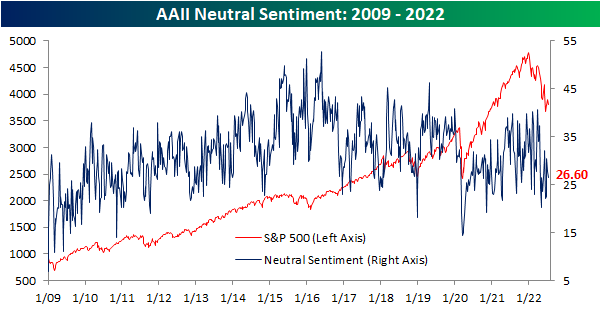
Neutral sentiment has managed to avoid major shifts in sentiment in recent weeks and this week was no exception. This reading fell modestly from 27.8% to 26.6%. That is well within the range of the past couple of years’ readings and is only the lowest since three weeks ago. Click here to learn more about Bespoke’s premium stock market research service.
Seasonal High is Here for Claims
Jobless claims have continued to rise hitting the highest level since November this week. Claims rose from an unrevised 235K up to 244K this week. With consistent increases in claims over the past few months, the reading has gone from multi-decade lows to levels that would have been the highest since late 2017/early 2018 pre-pandemic.

As we have noted each week recently, the current week of the year has historically marked a seasonal peak in claims. As such, the current week of the year has also seen a sequential rise in claims 80% of the time including a rise this week. NSA claims now are at 241.3K which is inline with the comparable readings for the three years prior to the pandemic. Although part of the recent increase in claims is likely seasonal in nature, given evidence of a slowing economy including weakness in other labor market data like under the hood of Friday’s nonfarm payrolls report, how much that seasonal uptick unwinds in the weeks ahead will be something to watch.

As for continuing claims, there has not been as notable of an increase recently when compared to initial claims. Continuing claims have only risen marginally from the low of 1.306 million in the week of May 20th to 1.331 million in the most recent reading as of July 1st. That most recent reading also saw a sizable improvement from the prior week with claims falling from 1.372 million. Click here to learn more about Bespoke’s premium stock market research service.
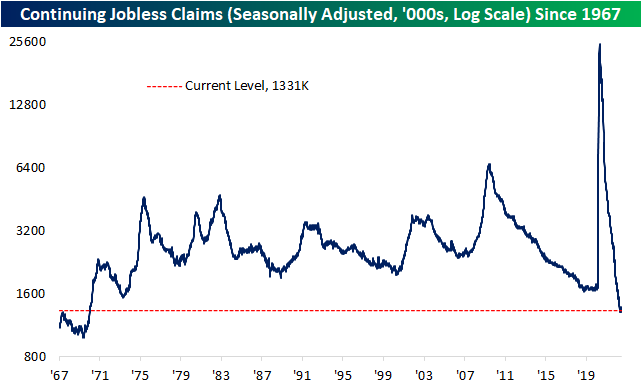
Chart of the Day: Bank Reports Kick Off
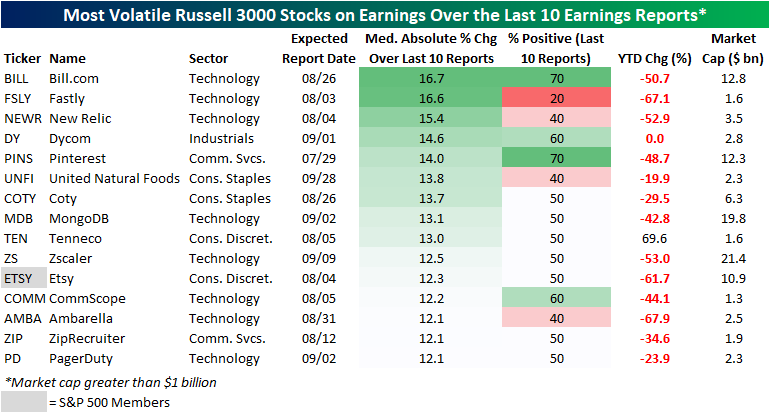
Volatile Stocks in Reaction to Earnings
With earnings season kicking off, we wanted to highlight Russell 3000 stocks that in recent history have been the most volatile in reaction to earnings (over the last ten quarters). In order to be included in this list, a stock must have reported at least ten quarters since going public and must also have a market cap over $1 billion. The list includes tech companies, e-commerce players, food producers, and more. On average, these stocks are down 35.1% on a YTD basis (median: -44.1%), which is notably worse than the overall market. We measured volatility by the median absolute percent change on earnings reaction days over the last ten quarters, and these names averaged a move of 13.6% in either direction on their earnings reaction days. The most volatile name has been Bill.com (BILL), followed by companies like Fastly (FSLY), New Relic (NEWR), Dycom (DY), and Pinterest (PINS). Only one of the stocks outlined below is in the S&P 500 (Etsy), and none have a market cap of more than $21.4 billion.
Of course, volatility does not imply direction. Of the 15 stocks outlined below, two – BILL and PINS – have seen seven of their last ten reports result in gains on their earnings reaction day. On the other end of the spectrum, four stocks have seen positivity rates of 40% or less over the last ten reports: Fastly (FSLY), New Relic (NEWR), United Natural Foods (UNFI), and Ambarella (AMBA). If you own any of these names, be prepared for a potentially sharp reaction to earnings (in either direction) when they report this earnings season. Click here to learn more about Bespoke’s premium stock market research service.
Just to show you what we mean, the graphic below shows BILL’s (the most volatile name on the above list) earnings reactions over the last 10 quarters. As you can see, eight of its last ten reports have been followed by a one-day reaction of 10%+, including four moves of more than 20%! Click here to learn more about Bespoke’s premium stock market research service.

Short Interest Keeps Rising
Over the past few days, equities, including the most heavily shorted stocks, have reversed a good amount of the gains seen since the mid-June lows. A basket of the 100 most heavily shorted stocks in the Russell 3,000 is currently little changed versus its levels at the start of 2020 compared to a roughly 16% gain for the Russell 3000. Whereas heavily shorted stocks saw massive outperformance versus the broader market in the second half of 2020 and early 2021, that outperformance has unwound since last fall. More recently over the past two months, though, highly shorted stocks and the Russell 3000 have been performing more or less in line with each other as the relative strength line has trended sideways and is near similar levels to the COVID Crash.

The most recent short interest data as of the end of June was also updated in the past 24 hours. For the whole of the Russell 3000, the average reading on short interest as a percentage of float currently stands at 6.24%. That is up 20 basis points since the prior update for mid-June and a full percentage point higher versus the start of the year.
Across nearly all industry groups, there have been major shifts in short interest levels since the start of the year. While most have made considerable moves higher, there are others that have actually fallen significantly like Food & Staples Retail and Telecommunication Services. Given the big increases this year, Retail continues to have the highest average reading on short interest followed by the Pharmaceuticals, Biotech &Life Sciences, and the automobile industries. Although their levels of short interest are not as elevated, Software & Services and Energy stocks saw the largest increases from the last report while only the Media & Entertainment industry and Food & Staples Retailing stocks saw declines in average short interest between the two most recent reports. That being said, none of those sequential moves were particularly large with the biggest absolute move being the 0.45 percentage point increase in Software & Services.

Switching over to the individual stocks with the highest levels of short interest, Dillard’s (DDS) currently tops the list with a little more than half of its shares sold short. That reading is only half of a percentage point higher versus mid-June but has nearly doubled since the start of the year. Although it continues to sit near the top of the list, Redbox Entertainment (RDBX), has perhaps seen the most notable shift in levels of short interest versus the last bi-weekly report. Throughout the year, the recent SPAC has seen large swings in its reported short interest levels. Click here to learn more about Bespoke’s premium stock market research service.
