Big Revision in Claims
Initial jobless claims continue to disappoint. Although this week’s release technically fell down to 256K, it was from a 10K upwardly revised number of 261K last week. Both this week and last’s readings are the highest since the fall and would also mark the highest readings since the fall of 2017 outside of the historically elevated readings of the pandemic.

The pandemic was a volatile time period for jobless claims data as readings rose into the millions. As such, revisions over the past couple of years have gotten historically large in turn, albeit less so over the past year. Although it may not sound like much, last week’s 10K revision was actually sizable. It was the largest revision since the week of July 4th last year, and prior to the pandemic, the week before Christmas in 2012 was the last time there was a double-digit revision.
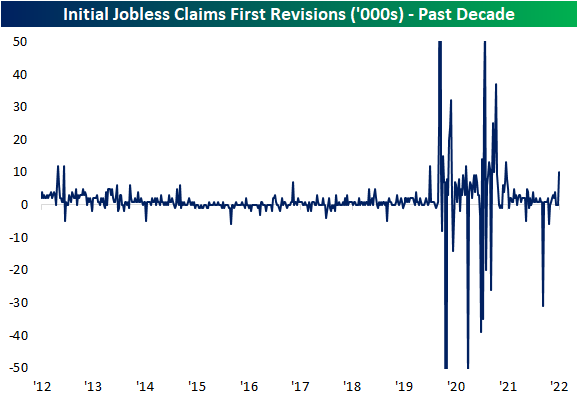
In his post meeting presser, Fed Chair Powell mentioned how the rise in initial jobless claims may be seasonal in nature. While we will provide some more in depth analysis to these comments in regards to the data in tonight’s Closer, as we have noted in the past, jobless claims have been roughly following standard historical seasonal patterns this year. July typically sees a temporary seasonal spike higher, but as we noted last week, that seasonal peak appears to have been put in place a bit later than usual which is rare but not exactly an unprecedented occurrence. While claims will likely get some seasonal tailwinds in the coming weeks (including this week of the year as claims have fallen around 90% of the time historically), the actual level of claims for the current week of the year is now well above comparable weeks for the few years prior to the pandemic. In other words, before or after seasonal adjustment, claims have come off their strongest levels and revisions have not exactly made things any better.

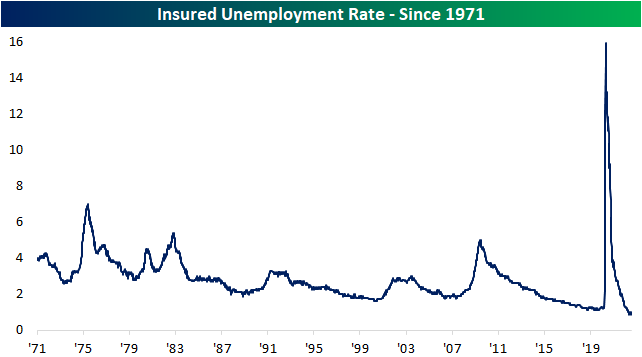
As for continuing claims, the latest week saw a 25K decline to 1.359 million. While that does mark some deterioration from the strongest levels, unlike initial claims, continuing claims are still well below levels from prior to the pandemic indicating a still very healthy labor market the likes of which has not been seen in decades as the insured unemployment rate (continuing claims as a percentage of the number of those covered by state insurance programs) continues to hover near 1%. Click here to learn more about Bespoke’s premium stock market research service.

LIKS Report: 7/28/22
Bespoke’s Little Known Stocks (LIKS) report highlights a company that may not be on the traditional radar of most investors. In this report, we provide an in-depth analysis of the little known stock, including industry insights, growth lever analysis, insights to the competitive landscape, equity performance, relative valuation, operational efficiency, pros & cons, and more. Today’s report is about an innovative software company with exposure to recession-resistant industries.

As always, this report is for informational purposes only and is not a recommendation to buy or sell any specific securities. Investors should do their own research and/or work with a professional when making investment decisions. Highlighting a stock doesn’t mean we are bullish or bearish on it. Our goal is simply to provide readers with facts to help them make informed decisions rather than just opinions.
Bespoke’s LIKS reports are available at the Bespoke Institutional level only. You can sign up for Bespoke Institutional now and receive a 14-day trial to read our LIKS reports. To sign up, choose either the monthly or annual checkout link below:
Bespoke’s Morning Lineup – 7/28/22 – Three Down, Two to Go
See what’s driving market performance around the world in today’s Morning Lineup. Bespoke’s Morning Lineup is the best way to start your trading day. Read it now by starting a two-week trial to Bespoke Premium. CLICK HERE to learn more and start your trial.
“In a world that changing really quickly, the only strategy that is guaranteed to fail is not taking risks.” – Mark Zuckerberg

Below is a snippet of content from today’s Morning Lineup for Bespoke Premium members. Start a two-week trial to Bespoke Premium now to access the full report.
After Fed Chair Powell downplayed the significance of the initial read on quarterly GDP reports and then today’s negative print for Q2 GDP, conspiracy theorists will say yesterday’s comments were made so the Fed could downplay today’s negative print. Whatever. We now have seen two straight quarters of negative GDP, and while that may not meet the ‘official’ definition of a recession, it still doesn’t change the fact that the US economy shrank in the first half. Add to that, initial jobless claims remain right near their post-COVID highs. This morning’s print of 256K was above last week’s print of 250K, but last week’s reading was subsequently revised up to 261K meaning that claims actually fell this week.
Futures have actually rallied a bit since the 8:30 print of GDP and Jobless Claims, but they are still indicating a modestly lower market at the open. The Q2 GDP report was an important report, but who wasn’t expecting a weak print? More important than that report will be earnings reports from Amazon.com (AMZN) and Apple (AAPL) after the bell today.
Today’s Morning Lineup discusses earnings news out of Europe and the Americas, the potential budget deal between Manchin and Senate Democrats, economic data from around the world, and much more.
Even in the current volatile environment, a 4% rally in the Nasdaq is a big move. In the index’s entire history dating back to 1971, there have only been 86 prior occurrences, and yesterday’s rally was the largest one-day gain since early April 2020 just after the COVID crash lows. The chart below shows every 4% rally in the Nasdaq over its history since 1971, and outside of the period from 2000 to 2002, and to a lesser degree the Financial Crisis, moves of this magnitude were sporadic. The most notable aspect of the chart below, however, has to be the fact that in the 50+ year history of the Nasdaq, nearly half of all the index’s rallies of 4%+ occurred in the three-year window from 2000 to 2002.

Given the near majority of all 4%+ rallies in the Nasdaq occurred during the most severe bear market in its history, maybe big moves like yesterday aren’t such a good thing in terms of the Nasdaq’s future direction. In the chart below, we show the index’s forward returns following prior 4%+ rallies as well as 4%+ rallies, like yesterday, that were the first occurrences in at least three months. As shown in the chart, median returns following all 4%+ rallies (light blue bars) are mixed relative to overall average returns since 1971, but when the 4%+ rally is the first in at least three months, forward returns have actually tended to be above the historical average for all periods since 1971. It’s hard to say the coast is now clear following yesterday’s big rally, but historically speaking, big one-day rallies for the Nasdaq after a long absence have historically been followed by above-average returns.

Start a two-week trial to Bespoke Premium to read today’s full Morning Lineup.
Most Countries Remain Below Pre-COVID Highs
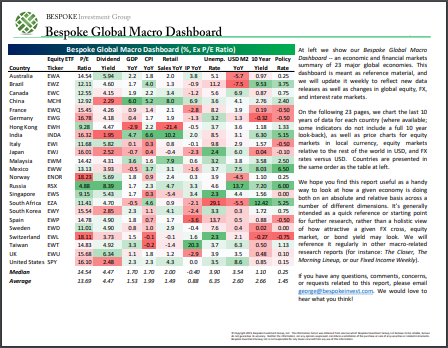
As we do the last Wednesday of each month, today we published our latest update of the Global Macro Dashboard which provides an overview of the major economic data and financial markets of 22 major global economies. Taking a look at the US ETFs tracking these same countries shows a broad move higher in equities around the globe during the month of July. The US has led the way higher as the S&P 500 ETF (SPY) has rallied just over 5%. India (INDA), Sweden (EWD), and Singapore (EWS) have seen the next strongest moves with each one rallying 4% or more. That has brought US equities, India, and Singapore back above their 50-DMAs as well.
Given those moves are in the context of much larger pullbacks year to date, most country ETFs also currently remain below their pre-COVID highs (the 52-week high as of the S&P 500 peak on 2/19/20). In fact, SPY, INDA, Taiwan (EWT), and Canada (EWC) are the only countries meaningfully above prior highs. Switzerland (EWL) is also technically a part of that list, but the one basis point difference is not much of a margin. At the moment, Brazil is down the most significantly from its pre-COVID high as it is still down 43%. However, unlike many other countries, the year-to-date decline has been very modest at only 1.76%.
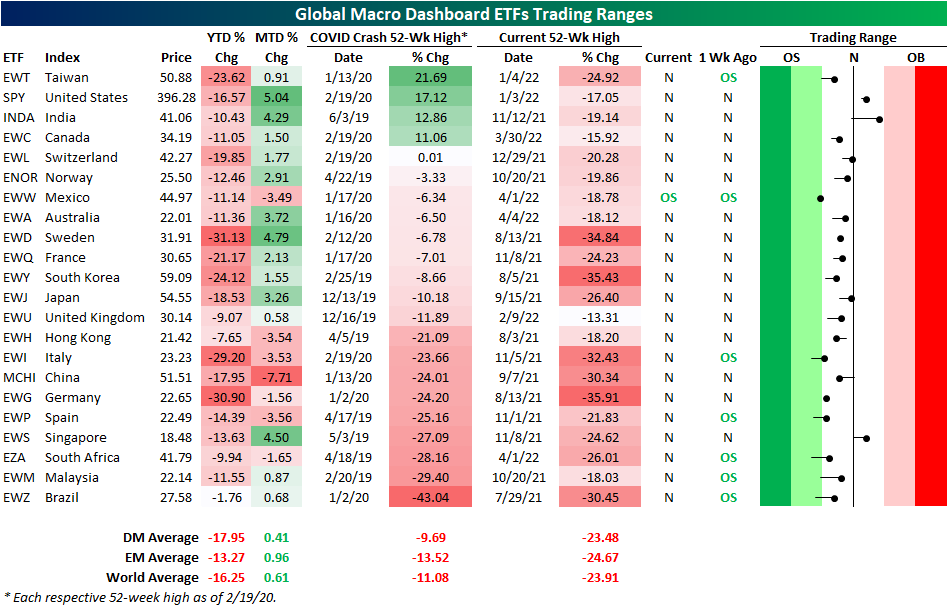
Taking a look at the charts of the four countries that are handily above their pre-COVID highs, the trends of the past year are not exactly positive. Each one currently sits in a multi-month downtrend, and only India and the US have managed to break above their 50-DMAs. Even if those moving averages have been taken out, further progress by bulls would be required to eliminate those downtrends. Click here to learn more about Bespoke’s premium stock market research service.

Chart of the Day – Fed Day Follow Through
Bespoke’s Global Macro Dashboard — 7/27/22
Bespoke’s Global Macro Dashboard is a high-level summary of 22 major economies from around the world. For each country, we provide charts of local equity market prices, relative performance versus global equities, price to earnings ratios, dividend yields, economic growth, unemployment, retail sales and industrial production growth, inflation, money supply, spot FX performance versus the dollar, policy rate, and ten year local government bond yield interest rates. The report is intended as a tool for both reference and idea generation. It’s clients’ first stop for basic background info on how a given economy is performing, and what issues are driving the narrative for that economy. The dashboard helps you get up to speed on and keep track of the basics for the most important economies around the world, informing starting points for further research and risk management. It’s published the last Wednesday of every month at the Bespoke Institutional membership level.
You can access our Global Macro Dashboard by starting a 14-day free trial to Bespoke Institutional now!
Alphabet and Microsoft Down Headed Into Earnings
Both Microsoft (MSFT) and Alphabet (GOOG) are trading down over 2% heading into their earnings report amidst broader market weakness and wariness towards the tech sector. On a year-to-date basis, MSFT and GOOG are both down over 25% and are trading near their 52-week lows. The charts below show MSFT and GOOG over the last twelve months. On the bright side, the rate of change in the two stocks does appear to have support near current levels. However, they are both still in sustained downtrends. Click here to learn more about Bespoke’s premium stock market research service.

Since GOOG went public in 2004, there have only been four days in which the stock traded lower by two percent or more heading into the earnings report. The latest occurrence was on the day of the Q1 2022 report, which was the only time when it also reacted negatively following the earnings report. On average, the stock has gained 2.5% (median: 2.6%) following the report after trading lower by 2%+ leading into earnings. Historically speaking, GOOG has posted gains on its earnings reaction day 58% of the time, gaining an average of 1.7%. While the average and median returns below are positive, we would note that with just four occurrences the sample size is small.

Since October of 2001 (which is as far back as our earnings database goes), MSFT has traded lower by at least two percent in the session heading into an earnings report seven times. Again, the sample size is relatively small, but following every one of these prior occurrences, MSFT gained in the session following its earnings report, booking an average gain of 3.2% (median: 3.5%). For all earnings reports since October of 2001, MSFT has reacted positively to earnings 60% of the time. Click here to learn more about Bespoke’s premium stock market research service.
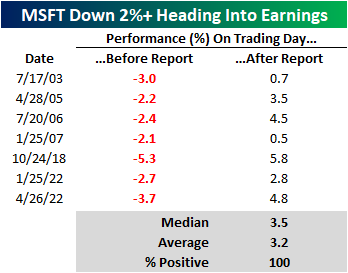
Chart of the Day – Hikes Spike the S&P
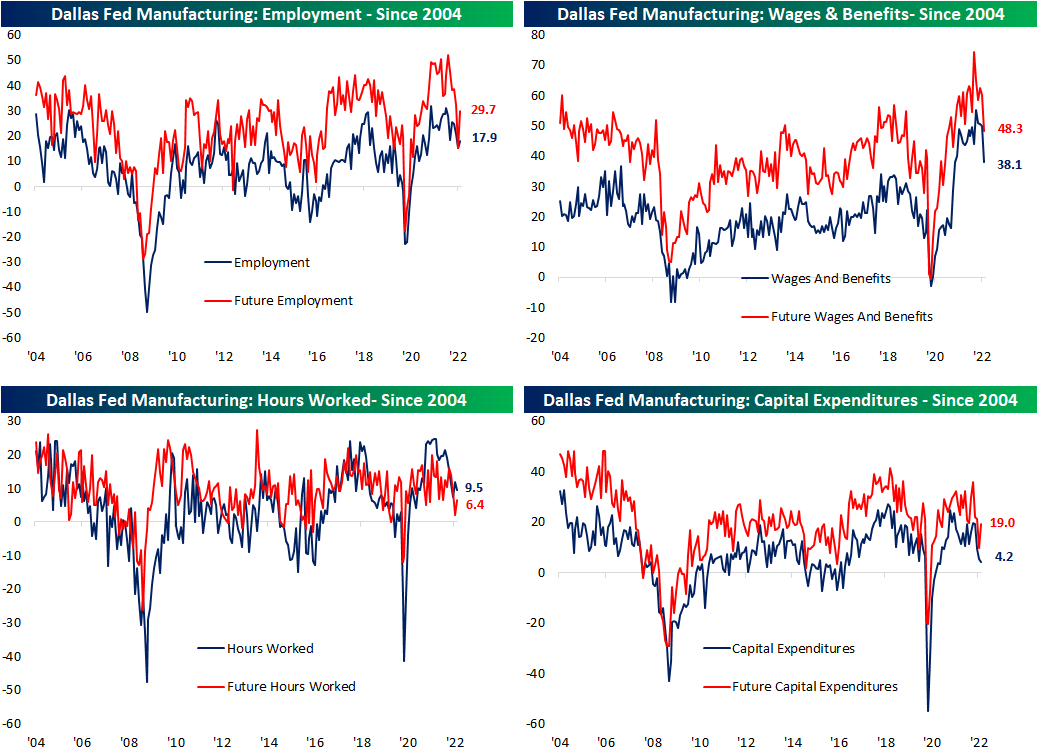
Demand Decimation Out of Dallas
Manufacturing data has continued to cool with the Dallas Fed’s monthly survey showing further deterioration in the month of June. The reading on General Business Outlook dropped another 4.9 points month over month to -22.6; the worst reading since the spring of 2020. Expectations are similarly at some of the lowest levels in over two years, but July did see a modest rebound.

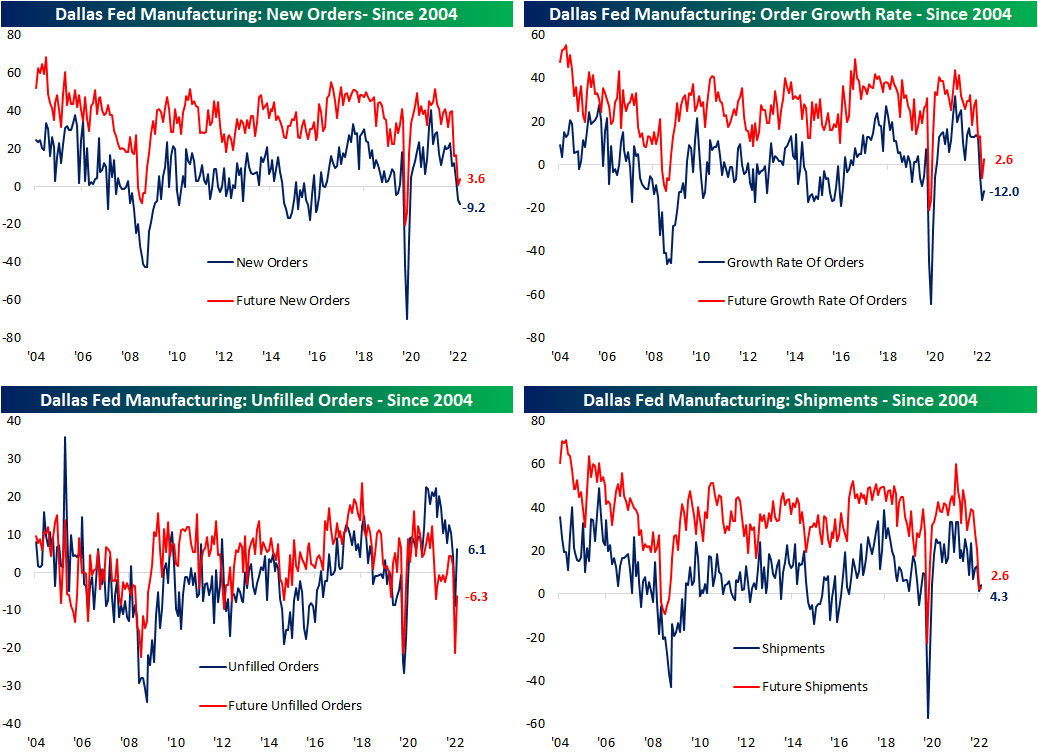
The individual categories of the report were mixed. While most remain in expansionary territory, some of the more important categories like New Orders are in deep contraction. The month-over-month moves were even more mixed as just over half of the components fell. As we have seen across other regional Fed reports recently, expectations broadly sit at much more depressed levels, although July did see some big rebounds across categories.

Even though demand has slowed, production expanded at a slightly accelerated rate in July. At only 3.8, though, the index is in the bottom quartile of its historical range and capacity utilization is only slightly stronger.

Manufacturers reported the worst slowdown in demand since the spring of 2020 as the index for New Orders fell to -9.2. The 1.9 point sequential decline was actually much smaller than the 10.5 point and 8.9 point declines in June and May, respectively, however that nonetheless expresses demand has been weakening materially. As new demand is a fraction of what it once was, Unfilled Orders experienced a peculiarly large uptick of 14.9 points. That ranks in the top 2% of all monthly moves on record resulting in the index to flip from a historically weak to a more solid reading.
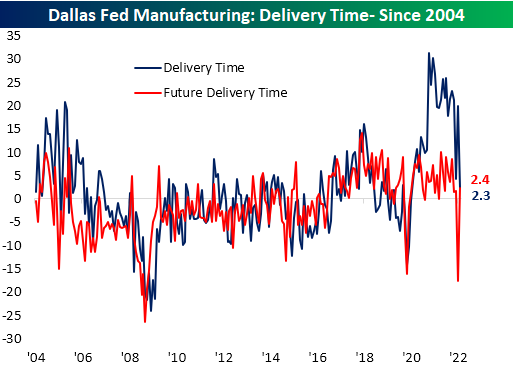
The Dallas Fed report added to the list of indicators pointing to alleviation on the supply chain front as well. The Delivery Times index experienced its second-largest one-month decline on record. Even though that brings the index to a barely expansionary level, the move heavily contrasts with expectations. Future Delivery Times recorded the largest month-over-month gain on record. Given that reading brings the index only to 2.4, it does not mean manufacturers expect delivery times to begin to surge to unprecedented levels as they did earlier in the pandemic. Rather, they no longer expect the rapid improvement that has been observed over the past several months.
As for other metrics that have fallen off a cliff, likely thanks to the easing of supply chain bottlenecks, both Prices Paid and Received are plummeting across both current and future conditions.

In addition to the decline in prices paid and received, the indices tracking the growth of wages and benefits has also been pulling back sharply. Both current conditions and future expectations saw some of their largest one-month declines on record, although, at current levels, they remain more elevated within their historical range than prices paid and received. The employment index peaked well over one year ago, but it has not experienced that same sharp decline as wages in benefits. In fact, there was a modest rise in the reading in July meaning firms increased hiring at an accelerated rate. Contrasting with that higher spending on employment, the capital expenditures index has been consistently grinding lower with this month marking the fourth monthly decline in a row, and at 4.2, it has fallen to the lowest level since October 2020. Click here to learn more about Bespoke’s premium stock market research service.