The Closer – Cranes, Dollars, And Auctions – 7/12/22
Log-in here if you’re a member with access to the Closer.
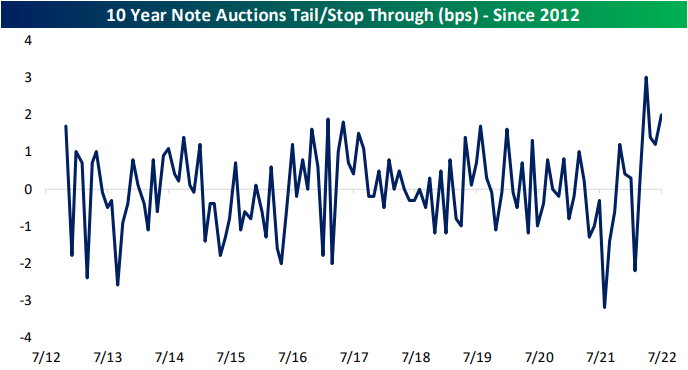
Looking for deeper insight into markets? In tonight’s Closer sent to Bespoke Institutional clients, starting out with some comments on KoneCranes and the stock’s usage as a read on global industrial activity, we then take a quick glance across the moves in markets today (page 1). Next, we take a look into the dollar’s 52-week high and the implications for various sectors (page 2) as well as dollar correlated portfolios (page 3). We then turn to the USDA’s outlook for wheat crops (page 4) before finishing with a recap of another bad 10 year note sale (page 5).
See today’s full post-market Closer and everything else Bespoke publishes by starting a 14-day trial to Bespoke Institutional today!
Daily Sector Snapshot — 7/12/22
Growth at a Reasonable Price (GARP) Basket
Today we are debuting our Growth at a Reasonable Price (GARP) Basket, which utilizes a proprietary algorithm in an attempt to find stocks that may be mispriced relative to their growth. In this report, we highlight some of the flaws of pure growth and value strategies before diving into the potential benefits of a GARP strategy. There are 50 stocks included in the GARP Basket, with brief descriptions provided for each one. This basket is weighted in proportion to S&P 1500 sector weightings and will be updated on a quarterly basis, which gives each company the ability to report an additional quarter of earnings.

Bespoke’s GARP Basket is available at the Bespoke Premium level and higher. You can sign up for Bespoke Premium now and receive a 14-day trial to read our GARP report. To sign up, choose either the monthly or annual checkout link below:
Chart of the Day: Tarnished Gold and Copper
Small Business Expectations Disconnect
The only US release on the economic calendar today was the NFIB’s Small Business Optimism Index, and it was a big dud. Compared to last month’s low reading of 93.1, the index fell to 89.5 versus expectations for a much more modest decline to 92.8. As a result of that larger than anticipated drop, the index is now below the COVID low and down to the lowest level since January 2013.
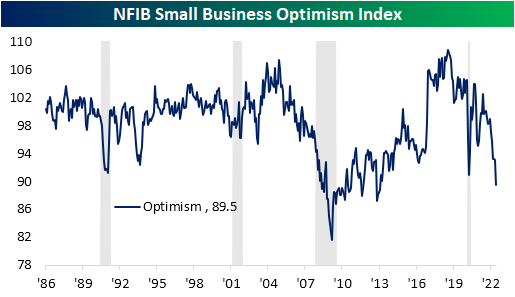
As the headline number is now in the 6th percentile of its historical range, several other components are similarly depressed including a record low reading in expectations for the economy to improve. Although some indices have managed to hold up decently—for example, reported inventory levels and the difficulty in filling openings remain in the top few percentiles since the survey began—breadth in June was very weak with many of the declines being historically large.
As we noted in today’s Morning Lineup, labor market indicators within the report have cooled off in recent months but remain at historically impressive levels. Meanwhile, inflation readings are also continuing to come in very elevated in spite of coincident declines in sales expectations.

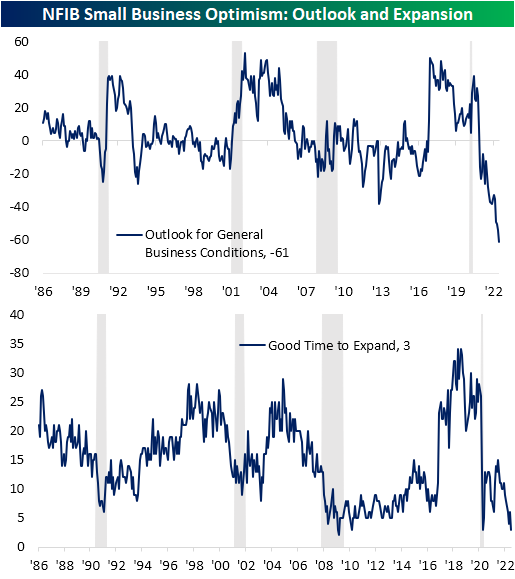
Again, the worst category of the report was the reported outlook for general business conditions. This index set the bar for a record low even lower as a net 61% of respondents reported that they expect the economy to worsen in the months ahead. Given this, there is also a historically muted share of respondents reporting now as a good time to expand their businesses. That reading came in at a meager 3, which alongside April 2020 and March 2010, was the joint lowest level since March 2009.
The NFIB also provides some detail as to why businesses are reporting such a soured outlook regarding expansion. Half of the responses blamed broader economic weakness as the reason. Ironically, that goes against the fact that only 2% reported weak sales would be a reason while another 3% reported strong sales would be the reason to expand. Additionally, while inflation remains such a major concern, only 4% blamed higher costs as a reason to not expand. So while half blamed economic conditions as the reason not to expand, there were some contradictory cross currents.
While it is a drastically lower share at only 10%, the next biggest reason for not expanding was the political climate. As we have frequently noted in the past, one issue with the NFIB survey is that there has been a sensitivity to politics, namely a bias in favor of Republicans. Given the Democratic administration, it is not exactly surprising that political climate would come in second.

Another interesting point to note on this month’s survey regarded the uncertainty index. This measure essentially tracks the number of times respondents select “uncertain” or “don’t know” as an answer to a survey question. Here was another index that has reached the lowest level in over a decade. This month’s low reading would imply that firms have a decidedly negative outlook for the economy.

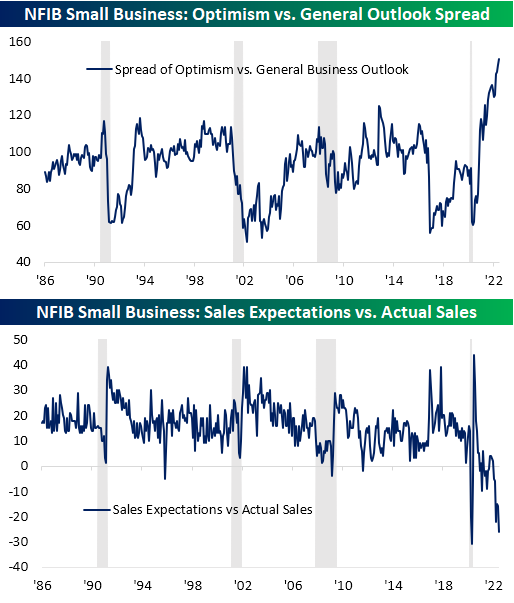
While sales expectations are down near the worst levels since the Global Financial Crisis and the COVID Crash, actual observed changes in sales have not yet cratered in the same way. That being said, on net there are more firms reporting lower sales than higher.

In other words, small businesses expect sales to get much worse than what current levels of sales would have historically implied. As shown below, the spread between those two indices has only been lower once on record and that was at the start of the pandemic. Similarly, the record low in General Business Outlook starkly contrasts with where the headline optimism index has been sitting. That spread is at a record high meaning again economic outlook is far worse than the overall level of optimism.
Another Curve Inverts
As of today, the percentage of inverted points on the yield curve reached the YTD highs seen in mid-June of 17.9%. This comes as the 10-year and 1-year invert, as well as the 5-year and 2-year. The inversion of points on the yield curve (particularly 2s&10s) tends to be cited as a leading recession indicator, due to the fact that higher near-term yields imply a higher risk in the near-term rather than the long-term, the inverse of what is typically true. The graph below shows the rolling percentage of inverted points on the curve over the last six months. Click here to learn more about Bespoke’s premium stock market research service.

As mentioned above, the spread between the 10-year and 1-year treasury inverted today, which is the first occurrence since October of 2019. Following prior inversions of this part of the yield curve since 1970, a recession has followed in the next two years 99.8% of the time which would suggest that a recession at some point in the next two years is almost certain. Following the first inversion in at least one year when a recession did follow, it has taken an average of 271 trading days to officially enter a recession. The shortest time it took to enter into a recession following 1s and 10s inversion was in 1973, when it took just 191 trading days. As mentioned, going back to 1970, recessions have followed within two years of an inversion 99.8% of the time. The only time that this part of the curve inverted and a recession did not follow within two years was after a brief stint in the fall of 1998.

Bespoke’s Morning Lineup – 7/12/22 – Euro Not Gonna Believe This
See what’s driving market performance around the world in today’s Morning Lineup. Bespoke’s Morning Lineup is the best way to start your trading day. Read it now by starting a two-week trial to Bespoke Premium. CLICK HERE to learn more and start your trial.
“The euro was born with great hopes. Reality has proven otherwise.” – Joseph Stiglitz

Below is a snippet of content from today’s Morning Lineup for Bespoke Premium members. Start a two-week trial to Bespoke Premium now to access the full report.
As the European economy continues to crater given rampant inflation, geopolitical instability, and labor/supply issues, the collapse in the bloc’s currency continued overnight as the euro reached parity with the US dollar for the first time since December 2002. While the round number generates a lot of headlines, it really means little in the broader picture of a weak European economy and what looks to be an even weaker outlook in the months ahead.
Over here in the US, things don’t seem all that much better. The week has started off slowly in terms of economic data, but this morning’s report from the NFIB on small business optimism came in much weaker than expected at 89.5 versus estimates for a reading of 92.5. Would you believe that sentiment among small businesses is now lower than it was at any point during the COVID lockdowns? Admittedly, the NFIB survey does tend to lean Republican, so with Democrats in control of DC, it’s not a complete surprise to see sentiment so weak. Given the macro backdrop, though, you can’t fault small business owners for being pessimistic. The last time the headline index from the NFIB was as low as it is now was in January 2013 at the beginning of President Obama’s second term. With the NFIB report behind us, the focus will now shift to tomorrow’s CPI.
In today’s Morning Lineup, we discuss moves in Asian and European markets, the latest developments on the war in Ukraine, and economic data from around the world.
Here is a surprising aspect of recent market events. With what seems like a near-constant focus that the ARK Innovation ETF (ARKK) gets, we were surprised that given the near 7% decline in the ETF yesterday there wasn’t more attention given to the fact that it had one of its 15 worst days since its inception in late 2016. The chart below shows the performance of ARKK since the start of 2017, and we have included red dots to show each of the 15 largest daily percentage declines in the ETF’s history. In the five-plus years that the ETF has been trading, all fifteen of the largest daily percentage declines occurred in either 2020 or 2022. Even more surprising is the fact that seven of the fifteen largest declines have all occurred since the start of May. What does it mean when extreme moves become the norm?

Start a two-week trial to Bespoke Premium to read today’s full Morning Lineup.
The Closer – High Dollar, Gas Reversal, NY Fed Consumer Read, Positioning – 7/11/22
Log-in here if you’re a member with access to the Closer.
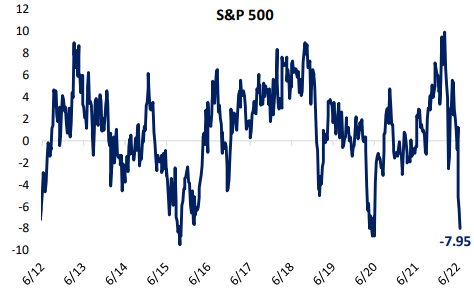
Looking for deeper insight into markets? In tonight’s Closer sent to Bespoke Institutional clients, we begin tonight by showing the relationship between equity prices and real rates, and what that implies for further moves in stocks. We also take a look into the dollar’s surge and EMFX (page 1). We follow up with a rundown of retail gas prices (page 2). Next we show inflation expectations from today’s Consumer Expectations report from the NY Fed (page 3) as well as other inflation expectations (page 4). We finish with a recap of today’s 3 year note auction (page 5) as well as the latest update on Commitments of Traders data (pages 6-8).
See today’s full post-market Closer and everything else Bespoke publishes by starting a 14-day trial to Bespoke Institutional today!
Daily Sector Snapshot — 7/11/22
KWEB Gaps Down 4%+
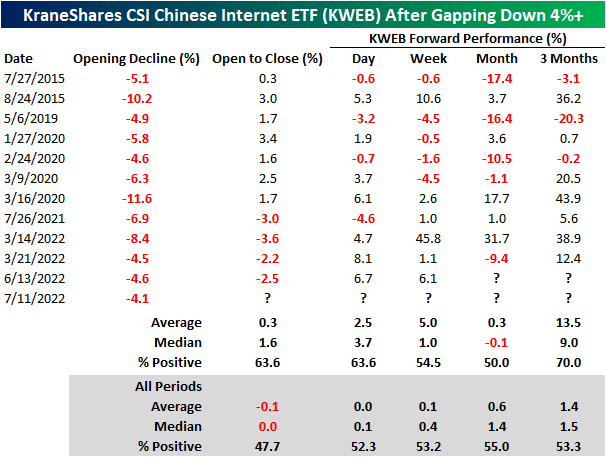
Today, the KraneShares CSI Chinese Internet ETF (KWEB) gapped down by 4.1% due to regulatory pressures from the Chinese Communist Party and an uptick of COVID cases in a few Chinese cities. Since KWEB’s inception in August 2013, the ETF has only gapped down by 4%+ 12 times, the largest of which was an 11.6% drop in March of 2020 during the height of the COVID crash. Following these weak opening gaps, KWEB has tended to partially recover throughout the day, booking a median gain of 1.6% between the open and the close. However, today the stock bucked that pattern and continued to decline from the open to close falling an additional 2%, resulting in a total loss of over 6%.

Following prior downside gaps of 4%+, KWEB has bounced back by a median of 3.7% the next day, with positive returns nearly two-thirds of the time. Over the course of the next week, KWEB has posted a median gain of 1.0%, which is 0.6 percentage points better than the average of all periods. For all the time periods that we looked at, KWEB’s median performance following these occurrences has outperformed the median of all periods, apart from the following month. Three months later, KWEB has booked a median gain of 9.0%, which is 7.5 percentage points higher than the 1.5% average for all periods. Click here to learn more about Bespoke’s premium stock market research service.