Daily Sector Snapshot — 8/23/22
High Yield Finds Support
The S&P 500 is cutting back on some of its losses today as the index is up around 0.4% as of this writing. From a technical perspective, the S&P 500 is currently around similar levels to the June highs, but other than that there is no clear technical support. High yield bonds are another story. Investors often turn to credit markets for confirmation of moves the equities, and while earlier this week credit spreads were ripping higher to confirm the drop in equities, the high-yield bond ETF (HYG) is showing a more promising sign for bulls today. As shown below, HYG has pulled back 3.33% from its high less than two weeks ago, but over the past three sessions, that decline has been paused as the ETF has found support at its 50-DMA (which has also begun to trend sideways). That is the reverse of what has frequently been observed in the past year as the 50-DMA has gone from resistance to support. At multiple points throughout the past year, the 50-DMA frequently marked a stopping point in short-term rallies. This week, the opposite has appeared to be the case. Click here to learn more about Bespoke’s premium stock market research service.

Fixed Income Weekly: 8/24/22
Searching for ways to better understand the fixed income space or looking for actionable ideas in this asset class? Bespoke’s Fixed Income Weekly provides an update on rates and credit every Wednesday. We start off with a fresh piece of analysis driven by what’s in the headlines or driving the market in a given week. We then provide charts of how US Treasury futures and rates are trading, before moving on to a summary of recent fixed income ETF performance, short-term interest rates including money market funds, and a trade idea. We summarize changes and recent developments for a variety of yield curves (UST, bund, Eurodollar, US breakeven inflation and Bespoke’s Global Yield Curve) before finishing with a review of recent UST yield curve changes, spread changes for major credit products and international bonds, and 1 year return profiles for a cross section of the fixed income world.
In this week’s report we take a look at conflicting signals sent by different segments of the Treasury market.

Our Fixed Income Weekly helps investors stay on top of fixed income markets and gain new perspective on the developments in interest rates. You can sign up for a Bespoke research trial below to see this week’s report and everything else Bespoke publishes free for the next two weeks!
Click here and start a 14-day free trial to Bespoke Institutional to see our newest Fixed Income Weekly now!
2022 Slams Stocks and Bonds
It is no secret that 2022 has not exactly been the year of the 60/40 portfolio. This year has left nothing safe with both stocks and bonds hit hard. Both are in the red by 10%+ on a year to date basis headed into the final week of August. In the charts below, we show the year to date total returns of the S&P 500 (y-axis) and the year to date total returns of various ICE Bank of America bond indices (x-axis) through August for each year going back to their respective inceptions (each index began in 1973 except for high yield which began in 1987). No matter which way you cut it, 2022 has been the worst year of the past half century for stocks and bonds combined.
With the S&P 500 down a little over 12% YTD, aggregate bonds (government and corporate bonds combined) are only around one percentage point better. For the comparable time of the year, the only years that also have seen both bonds and stocks sitting on a loss through August were 1973, 1974, and 1981. The same applies for government bonds. The corporate investment grade bond index has a bit more variety of years with stocks and bonds falling in 1974, 1981, 2008, and 2015. Again though, none of those other years have seen as sharp of a decline as 2022, and the S&P 500’s drop in the same time also ranks as one of the worst. 2022 is the only year that the high yield bond index has fallen simultaneously with stocks, however as we noted earlier, it does not have as long of a history as those other categories. Click here to learn more about Bespoke’s premium stock market research service.

Chart of the Day: Breadth Surge Recedes
Bespoke’s Morning Lineup – 8/24/22 – Flat as the Yield Curve
See what’s driving market performance around the world in today’s Morning Lineup. Bespoke’s Morning Lineup is the best way to start your trading day. Read it now by starting a two-week trial to Bespoke Premium. CLICK HERE to learn more and start your trial.
“If you want to succeed you should strike out on new paths, rather than travel the worn paths of accepted success.” – John D. Rockefeller

Below is a snippet of content from today’s Morning Lineup for Bespoke Premium members. Start a two-week trial to Bespoke Premium now to access the full report.
Trading this morning has been directionless, but it’s better than the alternative of weakness which has been the prevailing tone. Fed Chair Powell’s Jackson Hole Speech on Friday continues to be the main focus of investors, and expectations for the tone of the speech are low. Have you spoken to anyone in the last seven days who thinks Powell’s message will be a positive for the market?
In economic news this morning, Durable Goods for July were unchanged, which was weaker than expected, but ex Transportation, the reading came in better than expected (+0.3% vs +0.1%). The only other report on the calendar is Pending Home Sales at 10 AM.
Treasury yields are mostly lower across the curve except for the two-year which is 2 bps higher and further flattening or inverting various portions of the yield curve. In commodities, crude oil continues to run higher following reports yesterday that OPEC would consider cutting production and that has pushed WTI up to just under $95 per barrel.
As oil prices have moved back into the mid-90s per barrel and natural gas surges to multi-year highs, the Energy sector has gotten a jump. Since its July 14th low, the Energy sector has rallied more than 20% taking it from extreme oversold to extreme overbought levels in the span of six weeks, and as of yesterday’s close, the sector is less than 11% from its 52-week high in June.
Perhaps even more impressive than the rebound in price has been the about-face in the percentage of stocks in the sector trading above their 50-day moving average (DMA). While not a single stock in the sector was above its 50-DMA less than three weeks ago, as of yesterday’s close all but one name was above that level (bottom chart). The lone hold-out has been Baker Hughes (BKR), but even it is now just barely 2% below its 50-DMA. Falling oil prices and the prospects of lower inflation have played an important role in the broader market’s summer rally, but the recent trends for oil and natural gas and stocks in the Energy sector may be starting to shift.

Our Morning Lineup keeps readers on top of earnings data, economic news, global headlines, and market internals. We’re biased (of course!), but we think it’s the best and most helpful pre-market report in existence!
Start a two-week trial to Bespoke Premium to read today’s full Morning Lineup.
The Closer – Soft Auto Prices, Paper Houses, Collapsing PMI, 2y Whiff – 8/23/22
Log-in here if you’re a member with access to the Closer.
Looking for deeper insight into markets? In tonight’s Closer sent to Bespoke Institutional clients, we begin tonight with a look at the sharp decline in preferred shares (page 1) followed by a look at the decline in auto prices (page 2). Afterward, we dive into today’s new home sale data (page 3) and then pivoting over to the latest update of preliminary S&P Global PMIs (page 4). We finish with a rundown of the weak 2 year note auction held this afternoon (page 5).

See today’s full post-market Closer and everything else Bespoke publishes by starting a 14-day trial to Bespoke Institutional today!
Daily Sector Snapshot — 8/23/22
Chart of the Day: New Home Sales Down the Drain
Dividend Breakout Despite Declines
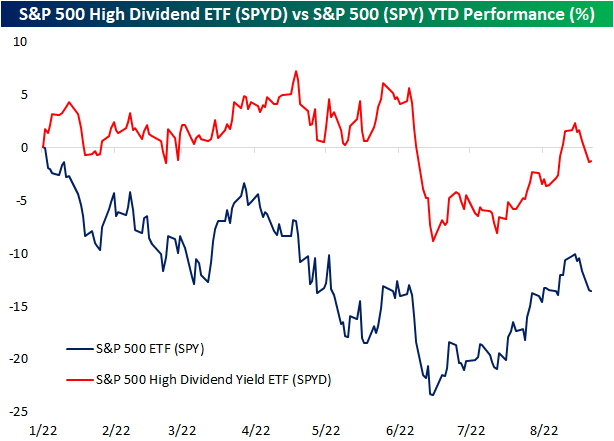
In last Thursday’s Chart of the Day, we highlighted how important dividends are for long-term investment performance. While dividends do help to boost investment returns over the long term, in the short term there is often an ebb and flow of dividend-focused ETFs under and outperforming in terms of price moves. For example, up until June, the S&P 500’s highest yielders measured by the SPDR S&P 500 High Dividend Yield ETF (SPYD) had mostly been trading in the green whereas the S&P 500 (SPY) was deep in the red.
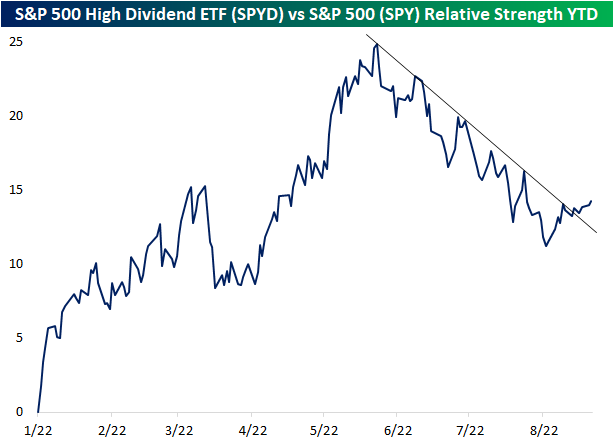
With equities broadly taking a turn lower over the past week, SPYD has held up relatively well when compared to the S&P 500 (SPY). Even though SPYD has not avoided declines (as we also showed in our decile analysis, the highest dividend payers have only slightly better performance than non-dividend payers), the relative strength line of SPYD versus SPY has broken out of the past couple of months’ downtrend. That being said, it has not been a sharp move higher like what was observed in the first half of the year, particularly in the second quarter. In other words, the highest yielders are back to outperforming the broader market but not to the same extent as earlier in the year. Click here to learn more about Bespoke’s premium stock market research service.