
The Closer – Stock-Bond Beta, Beige Book, BoC, Black Knight – 9/7/22
Log-in here if you’re a member with access to the Closer.
Looking for deeper insight into markets? In tonight’s Closer sent to Bespoke Institutional clients, we begin with a look at how stocks and bonds have been moving hand in hand with one another (page 1) followed by a review of the Beige Book and recent Fedspeak (page 2). We then dive into Canadian central bank action and the response in the Looney (page 3). We then close with a look at the latest delinquency and mortgage data from Black Knight (page 4).

See today’s full post-market Closer and everything else Bespoke publishes by starting a 14-day trial to Bespoke Institutional today!
Daily Sector Snapshot — 9/7/22
Fixed Income Weekly: 9/7/22
Searching for ways to better understand the fixed income space or looking for actionable ideas in this asset class? Bespoke’s Fixed Income Weekly provides an update on rates and credit every Wednesday. We start off with a fresh piece of analysis driven by what’s in the headlines or driving the market in a given week. We then provide charts of how US Treasury futures and rates are trading, before moving on to a summary of recent fixed income ETF performance, short-term interest rates including money market funds, and a trade idea. We summarize changes and recent developments for a variety of yield curves (UST, bund, Eurodollar, US breakeven inflation and Bespoke’s Global Yield Curve) before finishing with a review of recent UST yield curve changes, spread changes for major credit products and international bonds, and 1 year return profiles for a cross section of the fixed income world.
In this week’s report we take a look at the collateral shortage wracking European fixed income markets.

Our Fixed Income Weekly helps investors stay on top of fixed income markets and gain new perspective on the developments in interest rates. You can sign up for a Bespoke research trial below to see this week’s report and everything else Bespoke publishes free for the next two weeks!
Click here and start a 14-day free trial to Bespoke Institutional to see our newest Fixed Income Weekly now!
Historic Small Cap Volatility
It’s no secret that growth stocks have underperformed value stocks over the last twelve months. The trailing-twelve-month performance spread (percentage points) between the small-cap growth and large-cap value indices, two opposite ends of the equity market, is currently at -20.5 percentage points. Although this is far above the recent low of -33.9 ppts, the current reading is in the bottom 6% of all days since the mid-1994 (when both the MSCI USA Small Cap Growth and MSCI USA Large Cap Value Index were active). Interestingly, this year’s trailing twelve-month performance spread was the lowest since 2001 (unwind of the dot-com bubble). Funny enough, the spread had hit the highest level since early 2000 in 2021, as excessive performance from small-cap growth stocks has tended to reverse course after reaching extreme levels.

Small-cap growth stocks tend to trade at significantly higher valuation multiples than large-cap value stocks, which is part of the reason that small-cap growth equities have sold off at a higher rate than their counterparts. These stocks also have higher betas, so market moves have a disproportionate effect. These factors have caused the average daily percent change spread between the two indices to reach an extremely elevated level, the highest since 2000 – 2001. This measure of volatility is also yet to roll over, indicating no end to the volatility regime that has been in place. Click here to learn more about Bespoke’s premium stock market research service.

Chart of the Day: Doubled Rates Dampen Demand
Apple on iPhone Announcement Days
Building upon yesterday’s Chart of the Day, we took a look into Apple’s (AAPL) intraday performance on iPhone announcement days. Today is one of those days, and although we couldn’t locate the exact announcement time for each day going back to 2008, the ones that we did find occurred at 1 PM Eastern, which is highlighted in red below.
As you can see, the stock has tended to sell off during the first hour of the day before slowly trudging higher until 1 PM Eastern. However, once the event begins, the stock has tended to decline in a sell-the-news reaction. That weakness has tended to last most of the afternoon until the final 40 minutes of trading when the stock has tended to bounce back a bit. For the entire day. AAPL’s stock has, on average, declined 78 basis points on the day of prior iPhone announcements since 2008. Click here to learn more about Bespoke’s premium stock market research service.

Bespoke Morning Lineup – 9/7/22 – Eight in a Row?
See what’s driving market performance around the world in today’s Morning Lineup. Bespoke’s Morning Lineup is the best way to start your trading day. Read it now by starting a two-week trial to Bespoke Premium. CLICK HERE to learn more and start your trial.
“There’s nothing fair about it, it’s going to create economic hardship,” – Ryan Lance

Below is a snippet of content from today’s Morning Lineup for Bespoke Premium members. Start a two-week trial to Bespoke Premium now to access the full report.
The above quote from the ConocoPhillips (COP) CEO from earlier this year was referring to the energy policy of the United States, but it could just as equally have been used as a response to this morning’s WSJ article that the FOMC is planning on a 75 bps rate hike at its September meeting. Whatever your views are regarding the path of inflation and whether a 75 bps hike is actually needed, the impacts will create some level of hardship on what is already a weakening economy. Chair Powell has admitted as much in numerous comments saying that the FOMC’s fight to reverse the post-COVID inflation surge will be ‘painful’.
Futures were modestly higher before the WSJ article was published but have since reversed into negative territory with the S&P 500 indicated to open down by 0.30% with the Nasdaq indicated lower by a similar amount. The Nasdaq is already down seven straight days, which is the longest losing streak since November 2016, and that streak ultimately went on for nine days before ending. Crude oil prices are modestly lower and treasury yields are lower as well.
Maybe we were just overdue for a losing streak like the Nasdaq is currently in the midst of now. Before this one, the last losing streak of seven trading days was right before the 2016 election, and the gap of 1,466 trading days between these two streaks was the longest in the Nasdaq’s history. Prior to the current period, the longest gap between 7-day streaks was from late 2001 until 2006, and the only other gap of over 1,000 trading days ended in January 2016.

Our Morning Lineup keeps readers on top of earnings data, economic news, global headlines, and market internals. We’re biased (of course!), but we think it’s the best and most helpful pre-market report in existence!
Start a two-week trial to Bespoke Premium to read today’s full Morning Lineup.
The Closer – Small Cap Streak, PMIs & LMIs, Trader Positioning – 9/6/22
Log-in here if you’re a member with access to the Closer.
Looking for deeper insight into markets? In tonight’s Closer sent to Bespoke Institutional clients, we begin with a look at how the Russell 2,000’s losing streak stacks up to prior streaks and what forward returns have typically looked like (page 1). We then provide an updated on the latest service PMIs (page 2) followed by a supply chain equivalent (pages 3-5). We conclude with the latest Commitments of Traders report (pages 6-8).

See today’s full post-market Closer and everything else Bespoke publishes by starting a 14-day trial to Bespoke Institutional today!
Daily Sector Snapshot — 9/6/22
Nasdaq Declines For 7th Straight Day
Following Tuesday’s drop, the Nasdaq Composite has closed lower for seven consecutive days, a streak that has not occurred since November 2016. During this stretch, the index has declined roughly 9%, which is the largest decline over seven trading days for the index since mid-June of 2022. Even during the COVID crash and the continued sell-off during the first half of this year, the Nasdaq never declined for seven straight days. As apparent from the chart below, the frequency of these occurrences has declined substantially since the first 20 years of the index’s history. Click here to learn more about Bespoke’s premium stock market research service.
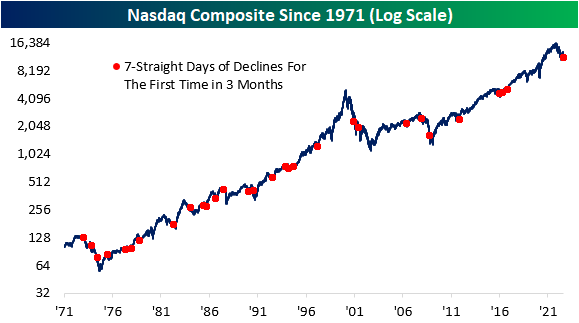
As shown in the table below, the median performance following these occurrences does not differ greatly from all periods. Average performance is lower over the following month, three months, and six months, but the positivity rate six months out is identical to that of all periods. The median performance does not differ too greatly compared to all periods across each time frame we looked at. Although investors are likely feeling the pain of this sell-off, there is no evidence suggesting that the forward performance will diverge from the norm.

The chart below provides an alternative way to visualize the consistency of positive returns following seven straight declines for the Nasdaq. Apart from three months forward, the positivity rate for the index was within three percentage points of the norm for every time period we looked at.
