
Bespoke’s Morning Lineup – 9/16/22 – At Least He Warned Us
See what’s driving market performance around the world in today’s Morning Lineup. Bespoke’s Morning Lineup is the best way to start your trading day. Read it now by starting a two-week trial to Bespoke Premium. CLICK HERE to learn more and start your trial.
“While higher interest rates, slower growth, and softer labor market conditions will bring down inflation, they will also bring some pain to households and businesses.” – Jerome Powell

Below is a snippet of content from today’s Morning Lineup for Bespoke Premium members. Start a two-week trial to Bespoke Premium now to access the full report.
It’s looking like another day of declines heading into the weekend after FedEx (FDX) lowered guidance last night, making an already weak backdrop even weaker. FDX wasn’t the only company to warn since the close yesterday. Companies like GE and Huntsman (HUN) also lowered guidance citing issues like supply chain bottlenecks and high energy costs. If the S&P 500 does finish down 1% today, it will be the sixth straight week of a gain or loss of 1%+ on the last trading day of the week. That would be the longest streak since May 2020 (ten weeks) and tied for the second-longest streak since at least 1952 (when the five-day trading week on the NYSE started).
The only economic report on the calendar is the Michigan Sentiment report at 10 AM Eastern. Economists expect the headline reading to bounce to 60.0 from 58.2 at its last read. The most important aspect of the report to watch, though, is inflation expectations. In that respect, economists are expecting one-year inflation expectations to fall to 4.6% from 4.8% while 5-10 year inflation expectations are forecast to remain unchanged at 2.9%.
When Powell said back in August that businesses and households would feel ‘pain’ from higher interest rates he wasn’t lying, but is a situation like FedEx (FDX) what he had in mind? The stock is currently trading down over 20% in the pre-market which would rank as the worst single-day decline for the stock since its IPO in 1978. Declines of this magnitude weren’t even felt during the 1987 crash, the financial crisis, or during the COVID crash. At the open today, FDX will still be well above its COVID lows (when global trade essentially shut down temporarily), but it will be right at levels it was trading at right before COVID hit US shores.
Given the trends we have seen this year, you would have expected FDX to be blaming increased labor and energy costs as well as supply chain bottlenecks for the weakness in results, but those issues were notably absent. Instead, FDX cited “global volume softness that accelerated in the final weeks of the quarter” and “macroeconomic weakness in Asia and service challenges in Europe”. With a warning like this, it raises the question of whether the Fed is too busy fighting yesterday’s battle and missing what’s on the horizon.

Our Morning Lineup keeps readers on top of earnings data, economic news, global headlines, and market internals. We’re biased (of course!), but we think it’s the best and most helpful pre-market report in existence!
Start a two-week trial to Bespoke Premium to read today’s full Morning Lineup.
The Closer – Banks on Sale, Industrial Production, 5 Fed, Growth Slows – 9/15/22
Log-in here if you’re a member with access to the Closer.
Looking for deeper insight into markets? In tonight’s Closer sent to Bespoke Institutional clients, we kick off tonight with a look into the historic rise in short term rates as well as a glance at bank valuations (page 1). We then switch over to macro data, reviewing the latest industrial production estimates (page 2), Five Fed Composite (page 3-5), and trade prices (page 6).

See today’s full post-market Closer and everything else Bespoke publishes by starting a 14-day trial to Bespoke Institutional today!
The Bespoke 50 Growth Stocks — 9/15/22
The “Bespoke 50” is a basket of noteworthy growth stocks in the Russell 3,000. To make the list, a stock must have strong earnings growth prospects along with an attractive price chart based on Bespoke’s analysis. The Bespoke 50 is updated weekly on Thursday unless otherwise noted. There were no changes to the list this week.
The Bespoke 50 is available with a Bespoke Premium subscription or a Bespoke Institutional subscription. You can learn more about our subscription offerings at our Membership Options page, or simply start a two-week trial at our sign-up page.
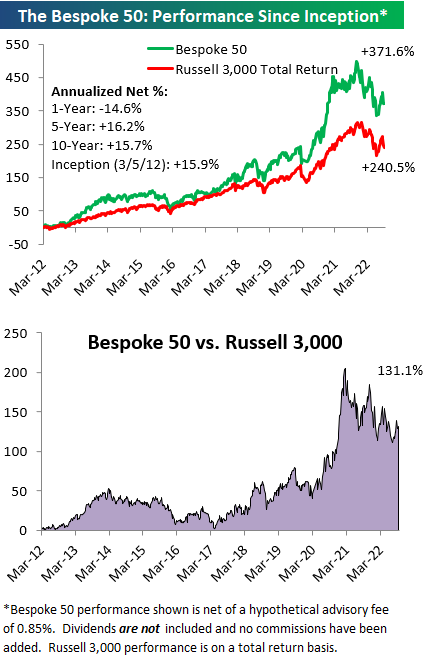
The Bespoke 50 performance chart shown does not represent actual investment results. The Bespoke 50 is updated weekly on Thursday. Performance is based on equally weighting each of the 50 stocks (2% each) and is calculated using each stock’s opening price as of Friday morning each week. Entry prices and exit prices used for stocks that are added or removed from the Bespoke 50 are based on Friday’s opening price. Any potential commissions, brokerage fees, or dividends are not included in the Bespoke 50 performance calculation, but the performance shown is net of a hypothetical annual advisory fee of 0.85%. Performance tracking for the Bespoke 50 and the Russell 3,000 total return index begins on March 5th, 2012 when the Bespoke 50 was first published. Past performance is not a guarantee of future results. The Bespoke 50 is meant to be an idea generator for investors and not a recommendation to buy or sell any specific securities. It is not personalized advice because it in no way takes into account an investor’s individual needs. As always, investors should conduct their own research when buying or selling individual securities. Click here to read our full disclosure on hypothetical performance tracking. Bespoke representatives or wealth management clients may have positions in securities discussed or mentioned in its published content.
Bespoke’s Weekly Sector Snapshot — 9/15/22
Chart of the Day: OpEx Catalyst Reaches Extremes
Sentiment Contradicts Price Action
The S&P 500 may have fallen around 1.5% over the past week, but individual investors have reportedly become increasingly bullish. 26.1% of responses to the weekly AAII sentiment survey reported as bullish this week, up from a recent low of 18.1% last week. With the S&P 500’s worst day in since June 2020 and a hotter-than-expected CPI print occurring late in the response collection period (12:01 AM on Thursday through 11:59 PM Wednesday night), the timing of responses is a potential cause for the increase in optimism that was contrary to equities’ price action. In other words, responses that came in prior to Tuesday were likely far more bullish than those that came in afterward and therefore elevating the level of bullish sentiment. As such, next week will be a more telling read on individual investor sentiment as it will more fully capture recent price action and inflation data.

While bulls rose back above a quarter of responses, bears fell back below 50%. Bearish sentiment dropped to 46% which was only the lowest level since the week of August 24th.

Those moves meant the bull-bear spread rose 15.3 points week over week going from -35.2 up to -19.9. That was the largest one-week jump in the reading since the end of June. However, that indicates sentiment remains heavily in favor of pessimism as the streak of negative readings grows to 24 weeks long; the second longest streak of negative readings on record.


The AAII survey was not alone in showing a rebound in sentiment. Both the Investors Intelligence survey and the NAAIM Exposure Index highlighted increased bullishness in the latest week’s data. As with the AAII survey, though, the collection periods likely did not fully capture the effects of Tuesday’s inflation data and historic one-day decline. Overall, the story remains that investors are remarkably bearish. Click here to learn more about Bespoke’s premium stock market research service.

Claims Avoid Seasonal Lows
The move lower in jobless claims pressed on this week as the seasonally adjusted reading dropped another 5K down to 213K in addition to last week’s reading being revised 4k lower to 218K. That exceeded expectations which were calling for claims to rise up to 225K. This week was the fifth consecutive decline in adjusted claims with a total drop of 39K in that span. That is the longest streak of declines since December of last year when claims had fallen for 11 weeks in a row as the end of pandemic era programs was approaching.
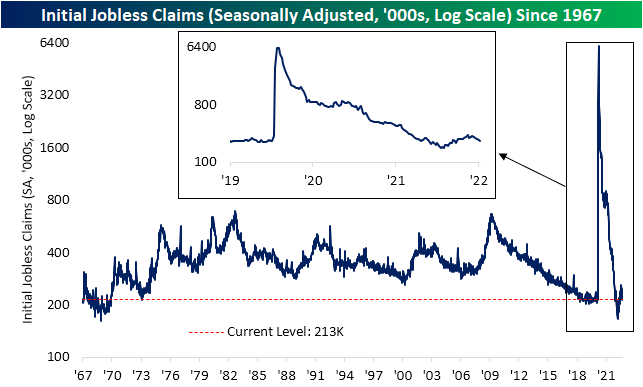
Although the continued decline in seasonally adjusted claims have not resulted in any sort of a new low, unadjusted claims are far more impressive. Taking a historical average of claims throughout the year, most of the time claims would have bottomed by now, but that is not the case this year. Unadjusted claims have continued to fall over the past couple of weeks and are all the way down to 156K; the lowest level since October 1969. That is not to say claims are completely bucking seasonal trends as the current week of the year has marked seasonal lows in years like 2009, 2010, 2015, and 2016. In other words, it is hard to distinguish how much of the continued decline is seasonal versus material improvement in claims, and regardless, claims remain at historically strong levels.

As for continuing claims, the latest reading for the week of September 2nd edged up modestly to 1.403 million. As with initial claims, continuing claims saw the previous week’s reading revised lower from 1.473 million to 1.401 million resulting in the latest print coming in well below estimates of 1.478 million.
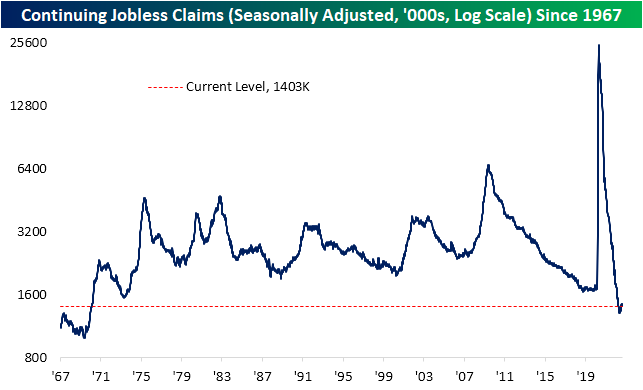
Recently we have been highlighting the ratio between initial and continuing claims to highlight how the latter has generally been stronger than the former. However, with initial claims falling for a fifth week in a row without a similar decline in continuing claims, the ratio of the two has been reversing lower and is approaching more normal levels. In fact, the one-month change in the reading has been on the large size ranking in the bottom 3% of all moves on record. Click here to learn more about Bespoke’s premium stock market research service.

B.I.G. Tips – Mixed Bag in Retail Sales
Bespoke’s Morning Lineup – 9/15/22 – Lehman Day
See what’s driving market performance around the world in today’s Morning Lineup. Bespoke’s Morning Lineup is the best way to start your trading day. Read it now by starting a two-week trial to Bespoke Premium. CLICK HERE to learn more and start your trial.
“The key to risk management is never putting yourself in a position where you cannot live to fight another day.” – Dick Fuld
Below is a snippet of content from today’s Morning Lineup for Bespoke Premium members. Start a two-week trial to Bespoke Premium now to access the full report.
To some, September 15th means that summer ends in a week, but others remember September 15th as the day Lehman died. Regardless of what comes to your mind first, it’s a lousy day. Equity futures are lower, treasury yields are higher, and crude oil is lower heading into what is going to be a busy day for data. Things kicked off at 8:30 with jobless claims, retail sales, import prices, Empire Manufacturing, and the Philly Fed. Jobless Claims were better than expected as were Retail Sales. Import Prices were less weak than expected, and finally, both the Empire and Philly Fed reports were negative, although the Empire was slightly better than expected while the Philly report was weaker. Perhaps most notable was that in both regional Fed reports, the Prices Paid components were at the lowest levels since December 2020. At 9:15, we’ll get updates on Industrial Production and Capacity Utilization, and then finally at 10:00 we’ll finish the day of data with Business Inventories.
Asian markets were mixed overnight while Europe is mostly higher. Japan’s Finance Minister warned markets that any intervention in the currency markets would be ‘swift’ and not announced in advance. In Europe, an ECB policymaker said he sees price pressures spreading out in the economy and warned that the central bank might be forced to raise rates more than expected.
September has historically been a lousy month for stocks, and the second half of the month has been notoriously weak. Over the last 40 years, the S&P 500’s median performance has been a decline of 0.49% with positive returns just 40% of the time. Making matters even worse, the years where the S&P 500 was down in the second half of the month saw a much larger magnitude of decline (-1.92%) than the years when it was up (1.07%). The last ten years have been even more painful. From 2012 to 2021, the second half of September has only been up three times and the median decline has been 0.81%.

Our Morning Lineup keeps readers on top of earnings data, economic news, global headlines, and market internals. We’re biased (of course!), but we think it’s the best and most helpful pre-market report in existence!
Start a two-week trial to Bespoke Premium to read today’s full Morning Lineup.
The Closer – Gas Rips, PPI Slows, Mortgage Costs, High Yield, Crude Update – 9/14/22
Log-in here if you’re a member with access to the Closer.
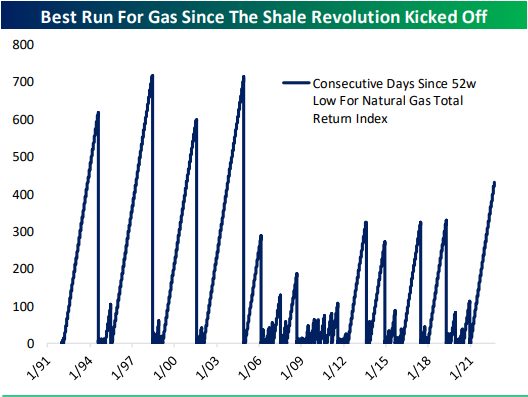
Looking for deeper insight into markets? In tonight’s Closer sent to Bespoke Institutional clients, we start out with a look at the backdrop for natural gas markets and how long it has been since the commodity has seen a 52-week low (page 1). Next, we review the latest PPI data (page 2) followed by the moves in mortgage rates (page 3) and credit spreads (page 4). Switching back to energy commodities, we then review the latest petroleum stockpile data (page 5).
See today’s full post-market Closer and everything else Bespoke publishes by starting a 14-day trial to Bespoke Institutional today!