Bespoke Brunch Reads: 7/7/19
Welcome to Bespoke Brunch Reads — a linkfest of the favorite things we read over the past week. The links are mostly market related, but there are some other interesting subjects covered as well. We hope you enjoy the food for thought as a supplement to the research we provide you during the week.
While you’re here, join Bespoke Premium for 3 months for just $95 with our 2019 Annual Outlook special offer.
We’ve Seen This Movie Before
Scientists are searching for a mirror universe. It could be sitting right in front of you. by Corey S. Powell (NBC)
Scientists in Tennessee are searching for an alternate, mirror universe using the behavior of subatomic particles to prove their theories. Don’t expect any gateways to open up any time soon, though. [Link]
Scientists Are Giving Dead Brains New Life. What Could Go Wrong? by Matthew Shaer (NYT)
Neuroscientists are experimenting with keeping brains alive long after their meaty vessels stop functioning, which doesn’t sound at all like the start of a zombie flick. [Link; soft paywall]
Conservation
Aggressive Goats Addicted to Human Urine Airlifted Out of Olympic National Park, WA (SnowBrains)
Many animals have a taste for salt, but goats in Olympic National Park have acquired such a taste for the salt and minerals in human urine that they became a threat to hikers and by extension themselves. [Link]
Poachers Are Invading Botswana, Last Refuge of African Elephants by Rachel Nuwer (NYT)
Botswana offers strong legal protections against poachers, but elephants are increasingly threatened even there, with poachers crossing a border that has traditionally offered protection to the massive mammals. [Link; soft paywall]
Vintage EPA photos reveal what US waterways looked like before pollution was regulated by Aylin Woodward (Business Insider)
A reminder of what natural environments used to be like before the EPA, featuring fetid water, trash dumped into rivers, and burning oil slicks. [Link]
Tree planting ‘has mind-blowing potential’ to tackle climate crisis by Damian Carrington (The Guardian)
While there are plenty of stories doom related to global warming, some of the solutions appear to be remarkably straightforward, including a program of simple reforestation and tree planting; that activity has room to remove two-thirds of emissions released by human activity if conducted at a large enough scale. [Link]
Tech Dystopia
Facebook, YouTube Overrun With Bogus Cancer-Treatment Claims by Daniela Hernandez and Robert McMillan (WSJ)
Part of the ongoing mess that is social media: deceptive and false information about health treatments which can lead to literal death if taken too seriously. [Link; paywall]
Design
For Better And Worse, We Live In Jony Ive’s World by Nikil Saval (The New Yorker)
A retrospective on the contributions of Apple’s head of design, someone who has had an almost immeasurable mark on the way the devices we use every day function and feel. [Link; soft paywall]
Economics
Consumers’ and Economists’ Differing Inflation Views Can Complicate Policymaking by Tyler Atkinson (Federal Reserve Bank of Dallas)
An analysis of consumer expectations shows that while economists tend to see inflation and unemployment as negatively correlated, consumers who are optimistic about the economy expect lower inflation and vice-versa. That presents a major challenge for policymakers, who aim to manage consumer inflation via economic slack. [Link]
US breaks record for longest economic expansion by Sylvan Lane (The Hill)
While it’s at least hypothetically possible that a US recession will be declared to have started this summer (we are near-certain that won’t be the case), as-of now the lack of a recession through June means the US now has a new record for the length of an economic expansion. [Link; auto-playing video]
Immigration
“Bodies and minds are breaking down”: Inside US border agency’s suicide crisis by Justin Rohrlich and Zoë Schlanger (Quartz)
Enforcing deterrence policies related to both unauthorized migration and legal asylum seekers is starting to place an enormous toll on CPB officers, with efforts to recruit new hires to the agency falling flat and existing personnel being worked into the ground. [Link; soft paywall]
Sanctions
To Evade Sanctions on Iran, Ships Vanish in Plain Sight by Michael Forsythe and Ronen Bergman (NYT)
Chinese ships are evading sanctions placed on Iran by the United States by turning off transponders when they are nearing the Strait of Hormuz. [Link; soft paywall]
Investing
As Stocks Hover Near Records, Growth Worries Linger by Akane Otani (WSJ)
With the economic expansion hitting a record length his month and stocks at all-time highs, investors continue to struggle with the outlook. [Link; paywall]
80% of the stock market is now on autopilot by Yun Li (CNBC)
We are extremely skeptical that JPM claims showing 80% of the market is invested in either passive strategies or quantitative funds. Per the Fed’s Z.1 report, domestic equity ETFs hold $2.2trn in domestic equity assets and mutual funds hold $7.7trn in equity assets, versus $17.5trn in direct household and nonprofit equity exposure that includes ETFs with another $8.8trn in total mutual fund exposure, making the outstanding ETF and mutual fund numbers far too small. That said, the market is increasingly trading on passive factors. [Link]
Read Bespoke’s most actionable market research by joining Bespoke Premium today! Get started here.
Have a great weekend!
The Closer: End of Week Charts — 7/5/19
Looking for deeper insight on global markets and economics? In tonight’s Closer sent to Bespoke clients, we recap weekly price action in major asset classes, update economic surprise index data for major economies, chart the weekly Commitment of Traders report from the CFTC, and provide our normal nightly update on ETF performance, volume and price movers, and the Bespoke Market Timing Model. We also take a look at the trend in various developed market FX markets.

The Closer is one of our most popular reports, and you can sign up for a free trial below to see it!
See tonight’s Closer by starting a two-week free trial to Bespoke Institutional now!
Golden Cross for Health Care (XLV)
Health Care (XLV) has been the worst performing sector so far in 2019 with a year to date gain of under 10% while other sectors like Technology (XLK) has risen upwards of 30%. Although it still has a large amount of catching up to do with the other sectors, things have been improving over the past couple of months. The sector has put in a series of higher lows and higher highs since early May and is currently sitting just below 52-week highs. At Wednesday’s close, the sector ETF also experienced a technical “golden cross,” which occurs when the 50-DMA crosses above the 200-DMA as both moving averages are rising.
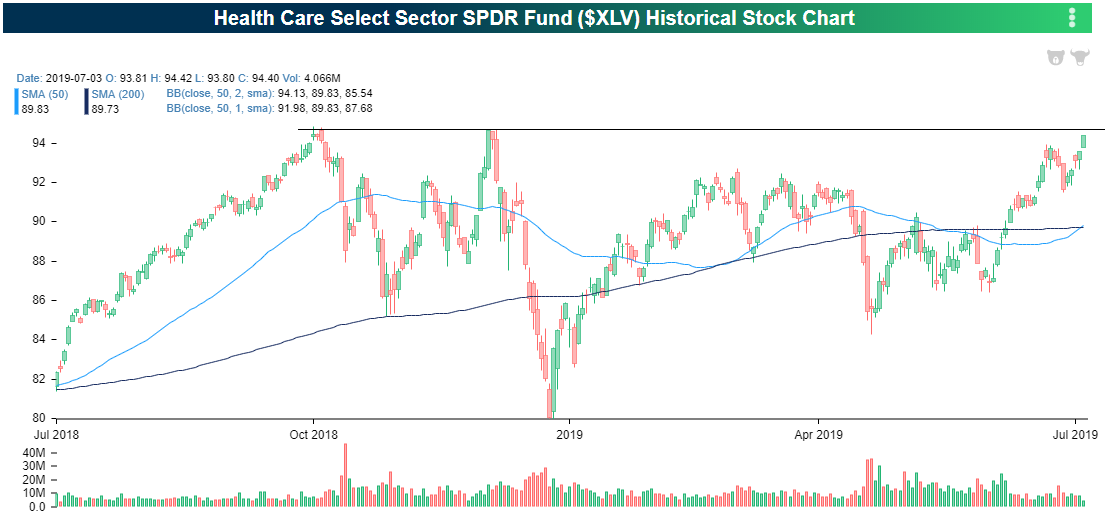
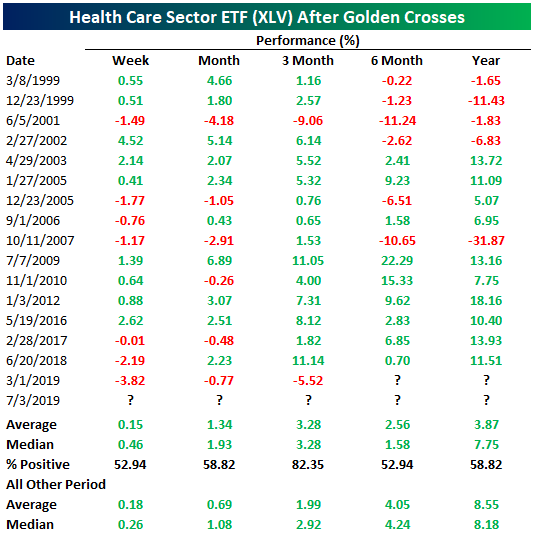
This was the 17th time in the Health Care Sector ETF’s history that it has experienced a golden cross with the last one was being only four months ago in March; the shortest span of time between golden crosses of all occurrences at only 124 days. Typically, golden crosses have not necessarily been indicators of consistent outperformance for XLV. In the week following a golden cross, gains have only been found a little better than half the time with worse than average performance; although median returns are in fact better than other periods. One month and three months out is when returns have been strongest and most consistent. Both are stronger than all other periods on an average and median basis. Three months out, gains have been notably consistent with XLV being higher 82.35% of the time. With a longer time horizon, looking 6 months to one year after a golden cross, XLV returns have been worse than normal. Granted, this is partially due to steep losses around 2000 and 2007. For one year out, huge losses of 31.87% from 2007 to 2008 weigh heavy on this average. For the current bull run, though, there has yet to be a golden cross where XLV was lower six months to one year out. Start a two-week free trial to Bespoke Institutional to access our interactive Security Analysis tool and much more.
Morning Lineup – Tap. Tap. Tap. Is this Thing On?
Trading desks are sparsely staffed this morning, and if you are reading this either at the office or on your way to work, we feel your pain. Questions we ponder on a day like today are why is the day before July 4th a shortened session, but the Friday after isn’t?
Anyways, the big June payrolls report is right on tap and should go a long way in letting us know if the futures markets have been correct in anticipating at least a 25 bps rate cut at the end of July.
In other news…it’s a summer Friday sandwiched between a holiday on one side and the weekend on another. There really isn’t much.
Read today’s Morning Lineup to get caught up on news and stock specific events ahead of the trading day and everything you may have missed since Wednesday’s close.
Bespoke Morning Lineup – 7/5/19

Believe it or not, today is only the 6th time in the last 45 years that July 5th has fallen on a Friday, but like today, each of the prior Friday, July 5ths also featured Non-Farm Payrolls (NFP) reports. In the two charts below, we have grouped the five prior events (1985, 1991, 1996, 2002, and 2013) based on whether the reported Non-Farm Payrolls reading that day was better or worse than expected.
Overall, market performance has generally been positive on these five days as the S&P 500 has seen an average gain of 0.65% with positive returns four out of five times, and on two of the five days, equities closed early on the day.
Out of the five NFP that fell on Friday, July 5th, three were weaker than expected. As shown in the first chart below, the S&P 500 finished the day higher on all three days with gains ranging from 0.2% all the way up to 3.67% on 7/5/02.

On the two days where NFP were better than expected, returns weren’t as positive. In 2013, the S&P 500 rose 1.02% when NFP came in ahead of forecasts, but in 1996, when the unemployment rate fell a surprising 0.3% percentage points and hourly wages saw their largest m/m percentage increase in 13 years, investors were spooked that the strength would lead to more hawkish rate policy from the FOMC. While a strong report of that magnitude is pretty much out of the question today, a significant beat relative to expectations is unlikely to be met with a positive reaction from the market.

Start a two-week free trial to Bespoke Premium to see today’s full Morning Lineup report. You’ll receive it in your inbox each morning an hour before the open to get your trading day started.
The Closer – Gapped Up To An Island – 7/3/19
Log-in here if you’re a member with access to the Closer.
Looking for deeper insight on markets? In tonight’s Closer sent to Bespoke Institutional clients, we take a look at what today’s surge into an island (low price above all other highs) means for stock prices going forward. We also discuss the ongoing surge in iron ore prices, record interest rate risk in corporate bond markets, today’s economic data, and how Q2 GDP is shaping up.

See today’s post-market Closer and everything else Bespoke publishes by starting a 14-day free trial to Bespoke Institutional today!
Fixed Income Weekly – 7/3/19
Searching for ways to better understand the fixed income space or looking for actionable ideas in this asset class? Bespoke’s Fixed Income Weekly provides an update on rates and credit every Wednesday. We start off with a fresh piece of analysis driven by what’s in the headlines or driving the market in a given week. We then provide charts of how US Treasury futures and rates are trading, before moving on to a summary of recent fixed income ETF performance, short-term interest rates including money market funds, and a trade idea. We summarize changes and recent developments for a variety of yield curves (UST, bund, Eurodollar, US breakeven inflation and Bespoke’s Global Yield Curve) before finishing with a review of recent UST yield curve changes, spread changes for major credit products and international bonds, and 1 year return profiles for a cross section of the fixed income world.
In this week’s report we argue overseas investors are part of the reason for declining UST yields.
Our Fixed Income Weekly helps investors stay on top of fixed income markets and gain new perspective on the developments in interest rates. You can sign up for a Bespoke research trial below to see this week’s report and everything else Bespoke publishes free for the next two weeks!
Click here and start a 14-day free trial to Bespoke Institutional to see our newest Fixed Income Weekly now!
B.I.G. Tips – June Employment Report Preview
With just one day separating the July 4th holiday and the upcoming weekend, you probably figured that Friday would be a throwaway day. Not this time. With the market all but pricing in at least a 25 bps rate cut at the end of the month but many FOMC officials not on the same page (see Mester’s comments from Tuesday), Friday’s employment report will be even more important than normal. You can bet there will be a notable market reaction whether the report is good or bad!
Heading into Friday’s report, economists are expecting an increase in payrolls of 162K, which would be an improvement from May’s much weaker than expected reading of 75K. In the private sector, economists are expecting an increase of 153K, which represents a 63K increase from last month’s weaker reading of 90K. The unemployment rate is expected to remain unchanged at 3.6%. Average hourly earnings are expected to grow at a rate of 0.3% versus last month’s 0.2% reading. Finally, average weekly hours are expected to be unchanged at 34.4.

Ahead of the report, we just published our eleven-page preview of the June jobs report. This report contains a ton of analysis related to how the equity market has historically reacted to the monthly jobs report, as well as how secondary employment-related indicators we track looked in June. We also include a breakdown of how the initial reading for June typically comes in relative to expectations and how that ranks versus other months.
For anyone with more than a passing interest in how equities are impacted by economic data, this June employment report preview is a must-read. To see the report, sign up for a monthly Bespoke Premium membership now!
Claims Healthy Despite Weak ADP
In what is a busy week of labor data, results so far have been mixed. Ahead of Friday’s Nonfarm Payroll Report for June, ADP payroll data released this morning missed forecasts of 140K, coming in at just 102K. While this set the stage for a potentially weaker NFP number on Friday, Initial Jobless Claims (released one day early due to the holiday) came in slightly stronger than forecasts and improved modestly from the previous week. While not making significant moves lower, claims continue to hold at healthy levels. Last week’s original print of 227K was revised up to 229K but this week saw an 8K drop to 221K. Claims were expected to fall to 223K. This stronger than expected print keeps the streaks going as claims have remained below 250K for a record 91 weeks and below 300K for a record 226 weeks.

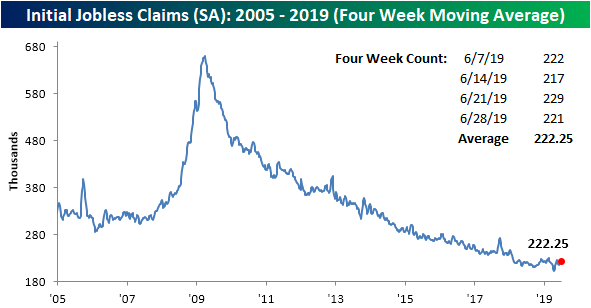
The less volatile four-week moving average edged 0.5K higher to 222.25K this week. This is as an input of 219K from late May rolled off the average to be replaced by this week’s higher 221K. The moving average has stayed in the upper end of its range from the past several months and has not made any meaningful move lower since April.
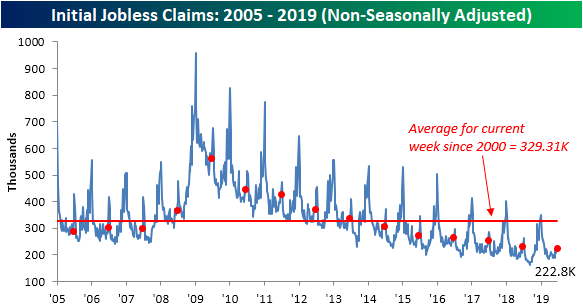
Turning to the non-seasonally adjusted (NSA) data, while the current week of the year typically sees an uptick in claims, the NSA number actually fell from 225.8K to 222.8K this week. For the current week of the year, this was the first time that claims fell week over week on an NSA basis since 2013. Headed deeper into the dog days of summer, claims data historically begins to see some seasonal increases so this drop is less likely to be repeated in the coming weeks. Regardless, this week’s number was the lowest reading for the current week of the year of the current cycle for what was all in all a healthy release. Start a two-week free trial to Bespoke Institutional to access our interactive economic indicators monitor and much more.
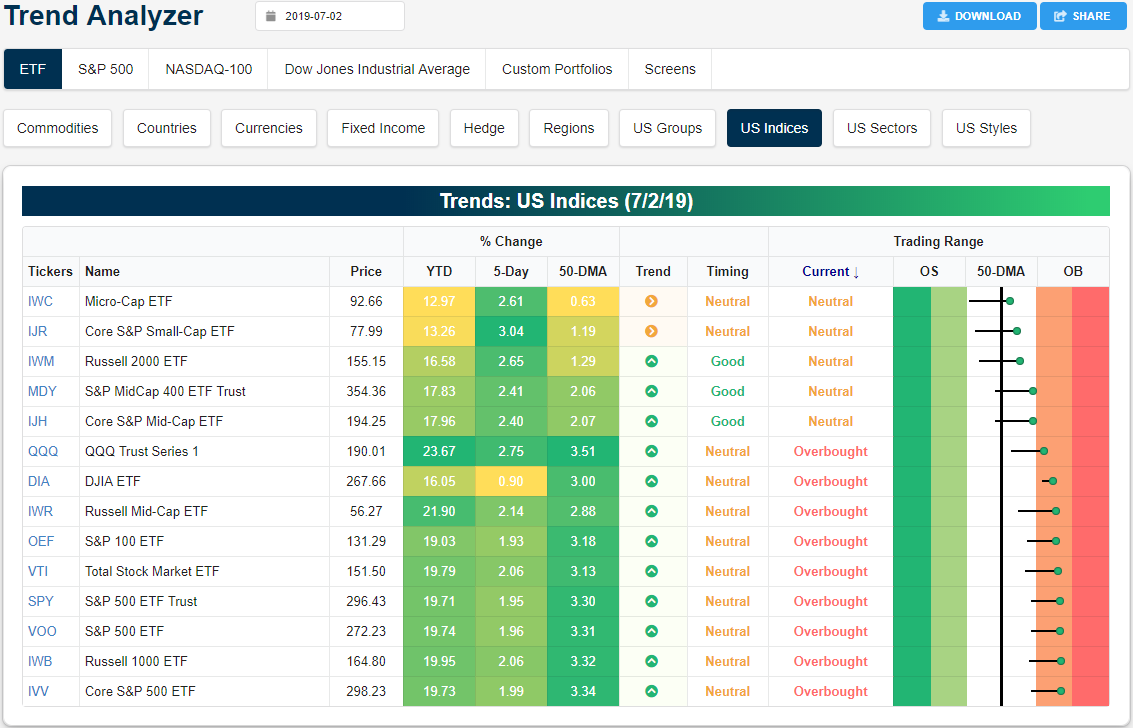
Trend Analyzer – 7/3/19 – Solar (TAN) Keeps Running
Gains have been strong across the board over the past week as the S&P 500 (SPY) finished at another all-time high yesterday. The only significant laggard has been the Dow (DIA) as it sits 0.9% higher from last Tuesday’s close. Otherwise, each of the major index ETFs has risen upwards of 3%. Small and mid caps have outperformed while the performance of large caps has been somewhat weaker. The Core S&P Small Cap (IJR) has done the best rising by 3.04%. The next best ETF is the Nasdaq (QQQ) with a 2.75% gain. In spite of these gains in the past week, there are actually fewer ETFs sitting at overbought levels than yesterday. Whereas there were 11 overbought major index ETFs at yesterday’s open, today there are only 9 as the S&P MidCap 400 (MDY) and Core S&P Mid-Cap (IJH) both moved to neutral on modest declines. Given their uptrends, this also gives them a good timing score in our Trend Analyzer tool.
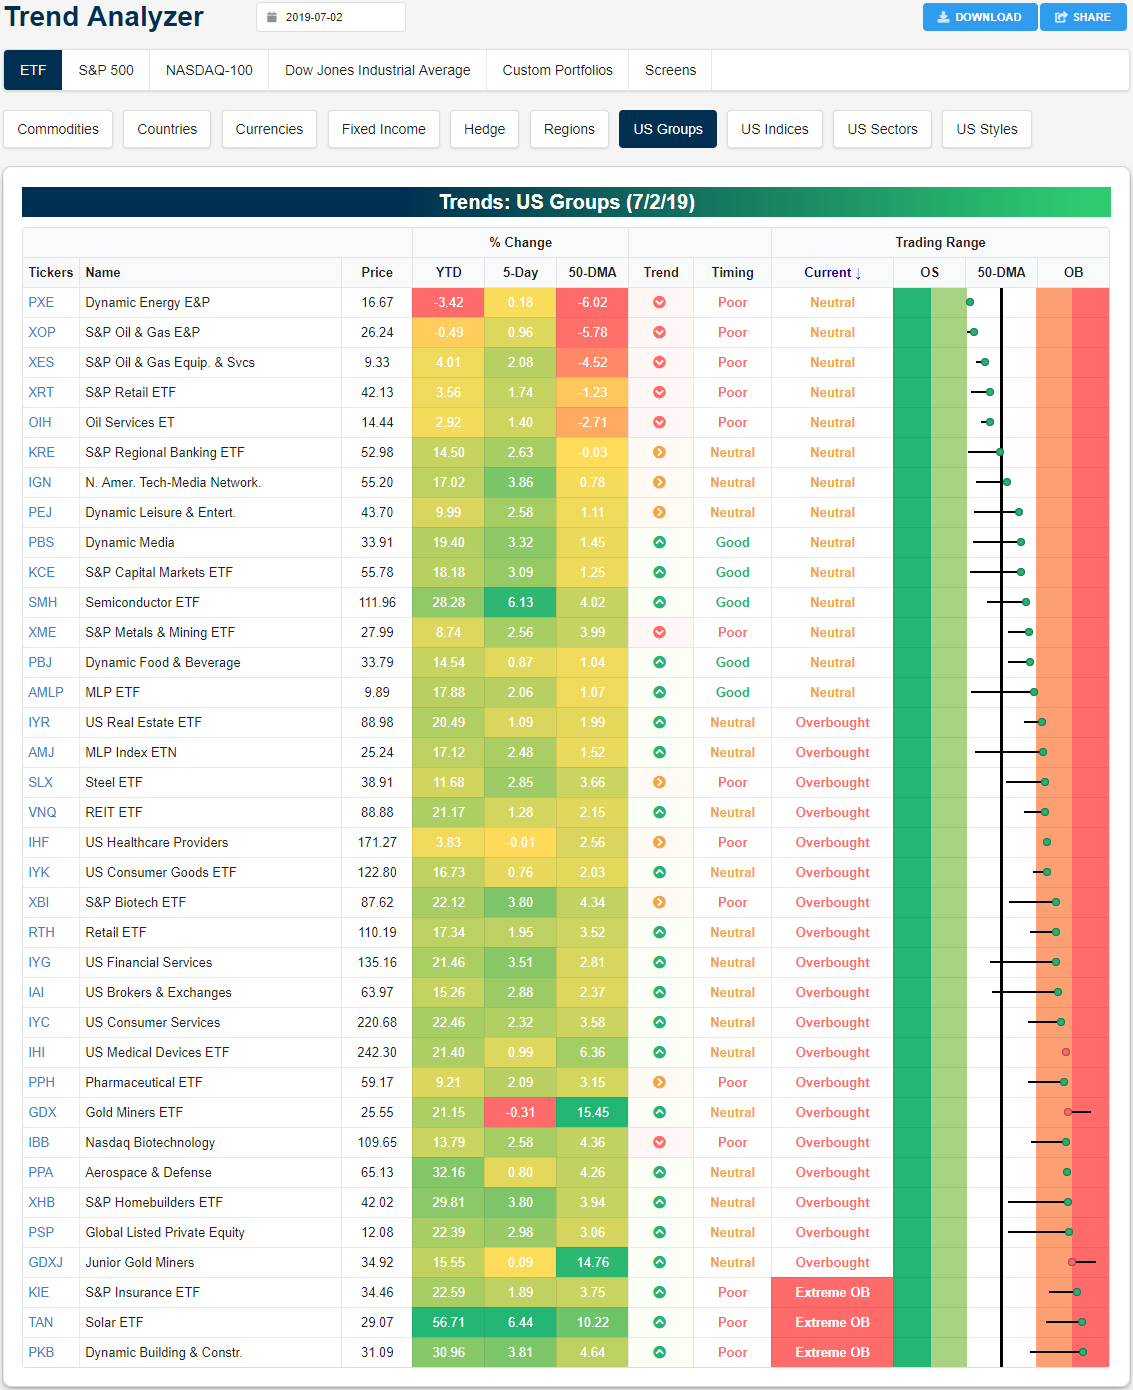
Looking at performance broken out by industry groups, the two best performers recently have been Semiconductors (SMH) and Solar (TAN). Both industries ripped over 6% higher in the past week. This brings SMH to be one of the top performing ETFs YTD. SMH also retook the 50-DMA in the past week but has yet to move into overbought territory, helping it to earn a good timing score. Meanwhile, solar has actually been the best-performing industry in 2019 by a wide margin as easing trade tensions have been a factor behind the rallies of both ETFs. TAN has now risen 56.71% YTD and is now trading at extremely overbought levels again.
While both of these ETFs have surged, most other industries have also moved higher as only the Gold Miners ETF (GDX) and US Healthcare Providers (IHF) are lower over the last week. The underperformance of GDX along with Junior Gold Miners (GDXJ) follows a surge where both become very extended from their 50-DMAs; both are still teetering on extremely overbought levels as well. While not in the red, with oil sliding, energy ETFs like the Dynamic Energy E&P (PXE) and S&P Oil & Gas E&P (XOP) have also been somewhat underperforming. These are currently the furthest below the respective 50-DMAs and the closest to oversold territory. Start a two-week free trial to Bespoke Institutional to access our interactive Trend Analyzer and much more.
Bespoke’s Global Macro Dashboard — 7/3/19
Bespoke’s Global Macro Dashboard is a high-level summary of 22 major economies from around the world. For each country, we provide charts of local equity market prices, relative performance versus global equities, price to earnings ratios, dividend yields, economic growth, unemployment, retail sales and industrial production growth, inflation, money supply, spot FX performance versus the dollar, policy rate, and ten year local government bond yield interest rates. The report is intended as a tool for both reference and idea generation. It’s clients’ first stop for basic background info on how a given economy is performing, and what issues are driving the narrative for that economy. The dashboard helps you get up to speed on and keep track of the basics for the most important economies around the world, informing starting points for further research and risk management. It’s published weekly every Wednesday at the Bespoke Institutional membership level.
You can access our Global Macro Dashboard by starting a 14-day free trial to Bespoke Institutional now!
