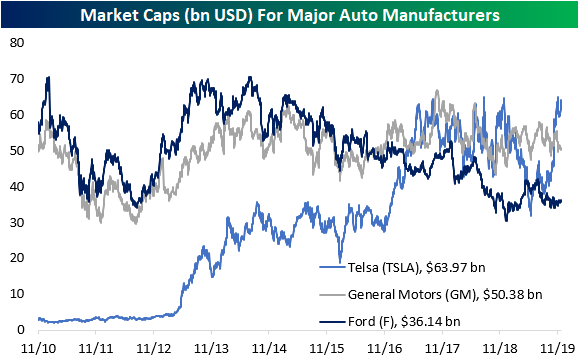
Tesla (TSLA) Once Again The Highest Valued US Auto Maker
In the past year and a half, we have periodically (see here, here, and here) kept tabs on the size of the US’s auto manufacturers: Ford (F), General Motors (GM), and Tesla (TSLA). While on the road you are perhaps more likely to come across a car, truck, or SUV created by Ford or GM, the rookie of the industry, TSLA, actually boasts the largest market cap at the current moment with the company valued at $63.97 billion. That has not been the case all year though. The stock’s downtrend in the first half of 2019 resulted in TSLA spending a brief stint as the automaker with the smallest market cap; falling below that of Ford (F). After bottoming out in June, the stock began to grind higher, breaking out of its downtrend, and ultimately surging over 17.67% the day after earnings in October. It was at this point that TSLA took the crown from GM which currently has a market cap of $50.38 bn. Since then even smashed windows at the Cybertruck reveal only temporarily dampened TSLA as the stock has continued to push higher in the past couple of weeks. Given that, TSLA has further distanced itself from GM and F in terms of market cap with the differences between the companies’ sizes some of the largest on record. In fact, only December of last year saw TSLA’s market cap larger than that of Ford or GM by a wider margin as shown in the second and third charts below. Start a two-week free trial to Bespoke Institutional to access our 2020 Outlook Report, interactive tools, and much more.
Fixed Income Weekly – 12/11/19
Searching for ways to better understand the fixed income space or looking for actionable ideas in this asset class? Bespoke’s Fixed Income Weekly provides an update on rates and credit every Wednesday. We start off with a fresh piece of analysis driven by what’s in the headlines or driving the market in a given week. We then provide charts of how US Treasury futures and rates are trading, before moving on to a summary of recent fixed income ETF performance, short-term interest rates including money market funds, and a trade idea. We summarize changes and recent developments for a variety of yield curves (UST, bund, Eurodollar, US breakeven inflation and Bespoke’s Global Yield Curve) before finishing with a review of recent UST yield curve changes, spread changes for major credit products and international bonds, and 1 year return profiles for a cross section of the fixed income world.
In this week’s report we discuss the persistent bias in interest rate markets over the past four decades.

Our Fixed Income Weekly helps investors stay on top of fixed income markets and gain new perspective on the developments in interest rates. You can sign up for a Bespoke research trial below to see this week’s report and everything else Bespoke publishes free for the next two weeks!
Click here and start a 14-day free trial to Bespoke Institutional to see our newest Fixed Income Weekly now!
2020 Outlook – Dollar & Stocks
Our 2020 Bespoke Report market outlook is the most important piece of research that Bespoke publishes each year. We’ve been publishing our annual outlook piece since the formation of Bespoke in 2007, and it gets better every year! In this year’s edition, we’ll be covering every important topic you can think of that will impact financial markets in 2020.
The 2020 Bespoke Report contains sections like Economic Cycles, The Fed, Sector Technicals and Weightings, Stock Market Sentiment, Stock Market Seasonality, Housing, Commodities, and more. We’ll also be publishing a list of our favorite stocks and asset classes for 2020 and beyond.
We’ll be releasing individual sections of the report to subscribers until the full publication is completed by year-end. Today we have published the “Dollar & Stocks” section of the 2020 Bespoke Report, which focuses on the performance and potential forward paths of major currencies with a focus on the US dollar.
To view this section immediately and all other sections, become a member with our 2020 Annual Outlook Special!

How SALT Has Iced Home Prices in High Tax States
In the past couple of days, we’ve released a few more sections of our 2020 Outlook Report including those on Washington, Commodities, and Housing. In addition to gauging the overall health of the economy and potential for future economic growth, in the Housing section, we also discussed home price trends using the gold standard for housing prices: the Case-Shiller Home price indices. Below is a complimentary excerpt from the Housing section of our 2020 Outlook Report. To view the entire section and gain access to all of the other sections (plus the rest of our research offering), join Bespoke Premium with this 2020 special offer.
The Case-Shiller indices saw home price growth slow sharply in 2018 from the 6% to 7% YoY range all the way down to the 2% range, but in 2019 home price appreciation began to pick back up. One significant cause of the fluctuations in home prices over the past couple of years has been the implications of tax policy.
Prior to the passage of the Tax Cuts & Jobs Act (TCJA) at the end of 2017, relatively high and low tax metro areas had no consistent home price trends relative to each other. The Trump tax bill capped SALT (state and local taxes) deductions, however, which hurts higher-tax metro areas like DC, LA, New York, and Chicago more than lower-tax metro areas like Denver, Las Vegas, Charlotte, and Dallas. This has resulted in home prices rising more in low-tax jurisdictions versus high-tax jurisdictions in each month since early 2018 as shown in the chart below. This trend is not likely to last forever, especially as the effects have already waned in 2019 compared to 2018, but the TCJA has certainly been a big penalty for homeowners in high tax metros, and the data proves that out.

Semis Testing Support
We’ve been discussing the very recent underperformance of the semiconductors for a few weeks now ever since the group’s relative strength versus the S&P 500 peaked back in early November. In the last week, the Philadelphia Semiconductor Index (SOX) has made a nice recovery off of its early December low, and in that rally, it also broke its intraday downtrend that had been in place since the SOX’s 11/15 intraday high. In yesterday’s trading, the group made a higher high but then faded in the afternoon finishing both near its intraday lows as well as right above the downtrend line that was previously broken last week. Over the coming days, this 1,710 – 1,715 level will be a key one to watch to see if key support can hold. Sign up using our 2020 Annual Outlook Special to gain access to our full report between now and year-end which covers the market from just about every angle imaginable!

Bespoke’s Global Macro Dashboard — 12/11/19
Bespoke’s Global Macro Dashboard is a high-level summary of 22 major economies from around the world. For each country, we provide charts of local equity market prices, relative performance versus global equities, price to earnings ratios, dividend yields, economic growth, unemployment, retail sales and industrial production growth, inflation, money supply, spot FX performance versus the dollar, policy rate, and ten year local government bond yield interest rates. The report is intended as a tool for both reference and idea generation. It’s clients’ first stop for basic background info on how a given economy is performing, and what issues are driving the narrative for that economy. The dashboard helps you get up to speed on and keep track of the basics for the most important economies around the world, informing starting points for further research and risk management. It’s published weekly every Wednesday at the Bespoke Institutional membership level.
You can access our Global Macro Dashboard by starting a 14-day free trial to Bespoke Institutional now!

Bespoke’s Morning Lineup – 12/11/19 – “There’s a Fed Meeting Today?”
See what’s driving market performance around the world in today’s Morning Lineup. Bespoke’s Morning Lineup is the best way to start your trading day. Read it now by starting a two-week free trial to Bespoke Premium. CLICK HERE to learn more and start your free trial.

2020 Outlook – Washington
Our 2020 Bespoke Report market outlook is the most important piece of research that Bespoke publishes each year. We’ve been publishing our annual outlook piece since the formation of Bespoke in 2007, and it gets better every year! In this year’s edition, we’ll be covering every important topic you can think of that will impact financial markets in 2020.
The 2020 Bespoke Report contains sections like Economic Cycles, The Fed, Sector Technicals and Weightings, Stock Market Sentiment, Stock Market Seasonality, Housing, Commodities, and more. We’ll also be publishing a list of our favorite stocks and asset classes for 2020 and beyond.
We’ll be releasing individual sections of the report to subscribers until the full publication is completed by year-end. Today we have published the “Washington” section of the 2020 Bespoke Report, which provides a summary of the US equity market’s performance during President Trump’s first term, how that performance stacks up versus other Presidents, and how equities have historically performed during the fourth year of a President’s term based on a number of scenarios. In addition, we have provided a summary of how equities performed during the impeachment inquiries into President Nixon and Clinton, how stocks and bonds have reacted to the President’s critical tweets of the Federal Reserve and Jerome Powell, and finally how the market and various sectors have reacted to changes in polling figures among Democratic candidates.
To view this section immediately and all other sections, become a member with our 2020 Annual Outlook Special!
The Closer – Yields Up, Productivity Details, API Forecast – 12/10/19
Log-in here if you’re a member with access to the Closer.
Looking for deeper insight on markets? In tonight’s Closer sent to Bespoke Institutional clients, we begin with a look at the breakout of two year yields as the copper to gold ratio and Russell to S&P 500 ratio confirm the move. Next, we delve into some of the details of today’s nonfarm productivity and costs report including manufacturing productivity and the steady rise in labor costs. We finish on a note about recent crude inventories and what API data is forecasting for tomorrow’s EIA release.

See today’s post-market Closer and everything else Bespoke publishes by starting a 14-day free trial to Bespoke Institutional today!
Investor Sentiment Still Fragile
Seeing stocks drop more than 50% from record highs not once but twice in the span of ten years is enough to bruise bludgeon the psyche of even the best investors. Even more than a decade after the lows of the credit crisis and the S&P 500 trading at double the level it traded at when it peaked in 2007, investors still look at equities with suspicion. The latest example that illustrates this is the TD Ameritrade Investor Movement Index (IMX). According to TD Ameritrade, the IMX index is meant to provide a snapshot of sentiment on the part of retail investors by tracking the behavior and trading activity of the firm’s clients.
With the market at record highs, one would have expected sentiment on the part of retail investors to be pretty positive resulting in an elevated reading in the IMX index. The reality is – you guessed it – the opposite. The chart below compares the IMX index to the S&P 500 going back to 2010. From 2010 through 2016, the IMX index oscillated in a range of roughly four to six even as the S&P 500 made new all-time highs. It wasn’t until 2017 when the broader market traded higher all year with nothing more than a 3% pullback that the IMX index really started to break out of its range. After the GOP tax plan passed through Congress and was signed into law, the IMX index surged above eight to record highs. Investors were finally starting to embrace the market again, as individuals who had sworn off equities forever finally started to want back into the stock market. Some even dipped their toes into bitcoin and other crypto-currencies!
The fun didn’t last long, though. In late January 2018, the S&P 500 had its first 10% correction in more than a year, and investors weren’t willing to wait it out. They quickly headed for the exits and have once again mostly stayed on the sideline. This past November, even though the S&P 500 was at record highs, the IMX index was at a reading of just 5.17, which is just barely above its historical average of 5.16. Not exactly a level you would consider indicative of confidence. Sign up using our 2020 Annual Outlook Special to gain access to our full report between now and year-end which covers the market from just about every angle imaginable!
