Multiyear Records Abound In Empire Manufacturing
This morning, the New York Fed’s Empire State Manufacturing Survey showed the strongest reading since May of last year. The headline index surged 8.1 points from 4.8 in January to 12.9 in February. That was the biggest pickup in activity since July when the general business index rose 10.6 points following a massive 20.8 point decline in June.

Taking a look across the individual categories of the survey, there were multiple significant moves to multiyear highs as current conditions have broadly picked up across categories. The only area that saw some weakness in February was that of employment as the indices for Number of Employees and Average Workweek both fell. The index for Average Workweek was the only index to show more businesses reporting worsening conditions in February. That compares to January in which Delivery Time, Inventories, and Prices Paid all showed conditions worsening.
Forward-looking results did not share the same strength as the indices for current conditions. The index for Number of Employees was the only expectations index that rose from January. In other words, current conditions have improved much more dramatically than optimism for the future. That’s similar to a trend that we’ve been seeing in the Conference Board’s Consumer Confidence Index for quite some time now.
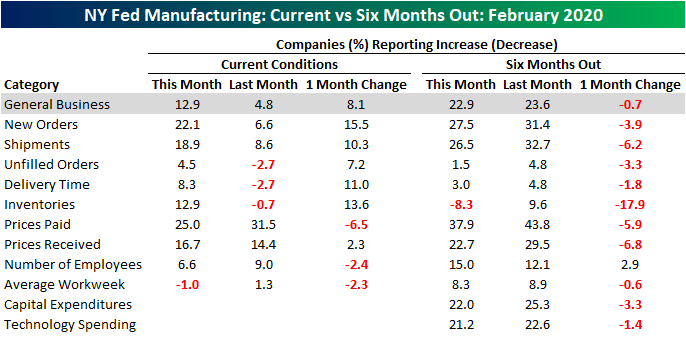
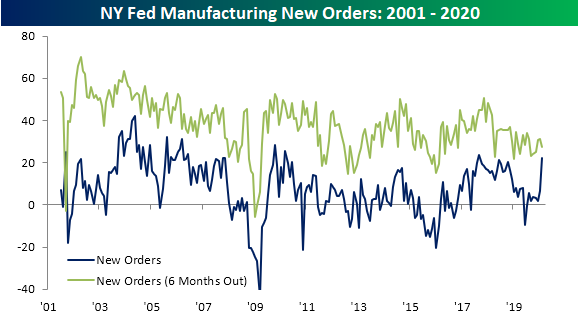
One of the more notable indices in February’s report was that of New Orders. The index rose 15.5 points to 22.1 which is the highest level since September 2017 when it was 23.7. That 15.5 increase was also the biggest one month jump since June of 2017 when it rose 18.3 points. Although the current outlook has dramatically improved, expectations for New Orders remain around similar levels to the past couple of years.
As New Orders surged, more NY businesses reported rising unfilled orders. This index came in with its first positive reading (4.5) since May of last year, reaching the highest level since September of 2018. Part of this increase is likely due to longer delivery times (more on this later).

Given the rise in New Orders and as businesses struggle to fulfill existing orders, Shipments have also picked up, rising 10.3 points to 18.9. That was the largest increase in this index since March of 2018, leaving it at its highest level since November of that same year. But as with other indices, the move in future conditions was much more subdued declining 6.2 points. Regardless, the combined move in Shipments, Unfilled, and New Orders indicate strong demand among New York state manufacturers.

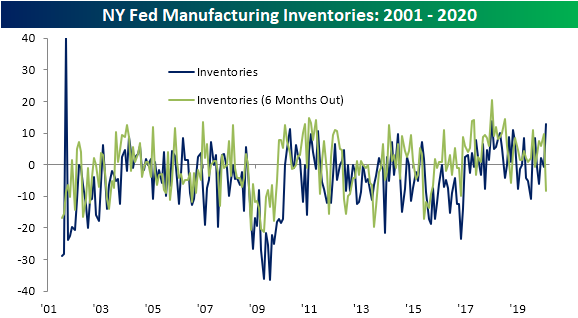
Despite this pickup, Inventories have continued to build with longer delivery times. In fact, the index for Inventories rose from a negative reading last month to 12.9 in February. It has only been higher in two other months since 2001: once in September of 2001 with an outlier reading of 40 and again in January of 2018 when it reached 13.8. At the same time, expectations for 6 months out plummeted to -8.3 which is the lowest reading since November of 2016. Meanwhile, Delivery Times surged 11 points to 8.3 which was the biggest one month jump in the index since June of 2010 and the highest level of that index since August of 2018. As with the index for Inventories, businesses do not appear to expect Delivery times to continue to grow as significantly over the next half year. Overall, this month’s survey seemed to show that while demand may not be an issue, New York manufacturers’ ability to get products out the door has hit a little bit of a roadblock. Start a two-week free trial to Bespoke Institutional to access our interactive economic indicators monitor and much more.

Bespoke’s Morning Lineup – 2/18/20 – Crab Apple
See what’s driving market performance around the world in today’s Morning Lineup. Bespoke’s Morning Lineup is the best way to start your trading day. Read it now by starting a two-week free trial to Bespoke Premium. CLICK HERE to learn more and start your free trial.
Investors are returning from the three-day weekend in a bad mood after Apple (AAPL) announced that revenues for the quarter will be weaker than expected due to the impact of the coronavirus on both production and demand. The stock was trading down over 3% on the news, but analysts rushed in to defend it and it is now trading down less than 2%. Our favorite headline of the morning was the following in all caps on Bloomberg, “APPLE PREANNOUNCEMENT BETTER THAN EXPECTED.” A better than expected warning. Can’t say we see that often!
In other news, Wal-Mart (WMT) marked the unofficial end to earnings season this morning with a weaker than expected report. While the stock was initially lower, it has rebounded and is now indicated to open up about 1%.
For a recap of all the latest on the coronavirus, earnings, and economic data, check out today’s Morning Lineup.

Even though earnings season unofficially winds down this morning, there’s still quite a lot of other reports to come in the coming two weeks. As shown in the snapshot from our Earnings Explorer below, there are still some days where more than 100 companies will report on a given day. We would note, however, that most of these companies are small in scale.
As far as the results of this past earnings season are concerned, the main takeaway from this earnings season is the improvement in revenues relative to expectations. As shown in the lower right chart below, 61.2% of companies have topped sales forecasts in the last three months, and that’s the highest percentage of beats since early 2019.

Bespoke Brunch Reads: 2/16/20
Welcome to Bespoke Brunch Reads — a linkfest of the favorite things we read over the past week. The links are mostly market related, but there are some other interesting subjects covered as well. We hope you enjoy the food for thought as a supplement to the research we provide you during the week.
While you’re here, join Bespoke Premium for 3 months for just $95 with our 2020 Annual Outlook special offer.
Coronavirus
Did pangolins spread the China coronavirus to people? by David Cyranoski (Nature)
One potential vector for the transmission of the coronavirus to humans via the animal kingdom are the armored mammals known as pangolins, sometimes used in traditional Chinese medicine. [Link]
Passengers celebrate as Westerdam cruise ship is FINALLY allowed to dock in Cambodia after five countries refused entry over coronavirus fears, despite no cases on board by Tim Stickings (Daily Mail)
The unfortunate tail of more than two thousand people who were stranded on a cruise ship in Southeast Asia after countries refused to let them dock over fears of coronavirus transmission. [Link]
Coronavirus brings China’s surveillance state out of the shadows by Yingzhi Yang and Julie Zhu (Reuters)
A detailed summary of the dystopian systems which control and regulate Chinese society, which while useful in helping stem the coronavirus outbreak, carries significant risks to civil liberties in a free society. [Link]
Politics
Voting on Your Phone: New Elections App Ignites Security Debate by Matthew Rosenberg (NYT)
The Democratic Party’s debacle in Iowa is one of a number of issues in recent elections that would suggest it’s too soon to be using apps to register votes remotely. But that isn’t stopping one company from taking its best shot. [Link; soft paywall]
Bernie Sanders’s Rise Spurs Re-Evaluation by Wall Street Detractors by Emily Barrett and Katherine Greifeld (Bloomberg)
While most assume a democratic socialist in the White House would be bad news for the stock market, some strategists and investors are taking a much more balanced view of the possibility of a Sanders Presidency. [Link; soft paywall, auto-playing video]
Social Media
Inside Mark Zuckerberg’s Lost Notebook by Steven Levy (Wired)
When Facebook was in the process of growing from mere idea to world-spanning corporation, Zuckerberg jotted some of his most important ideas down in a notebook that has since been destroyed…except for a few pages. [Link]
My Instagram by Dayna Tortorici (n+1)
A personal essay investigating the author’s experience on Instagram, from the light-hearted and good to the depths of personal oblivion in the hours before sleep. [Link]
The Original Renegade by Taylor Lorenz (NYT)
How a suburban teen outside of Atlanta sparked one of the biggest dance trends in years, but got no credit for her innovation from the people who benefitted most in the subsequent craze. [Link; soft paywall]
ESG
MSCI Says ESG Indexes Will Be Bigger Than Traditional Gauges by Ishika Mookerjee and Abhishek Vishnoi (Bloomberg)
Global index provider MSCI forecasts that assets indexed to ESG benchmarks will eventually surpass those indexed to traditional measures of the equity market. [Link; soft paywall]
Big Technology Stocks Dominate ESG Funds by Akane Otani (WSJ)
Active funds focused on sustainability are significantly overweight large tech stocks that have led the market of late, including Microsoft, Alphabet, Visa, Apple, and Cisco. [Link; paywall]
Investing
When Dividend Aristocrats Lose Their Status, Their Returns Often Improve by Lawrence C. Strauss (Barron’s)
When a company fails to raise its dividend for the first time after 25 years of hikes (falling off the so-called Dividend Aristocrats list) its stock tends to perform pretty well. [Link; paywall]
Charlie Munger warns there are ‘lots of troubles coming’ because of ‘too much wretched excess’ by Fred Imbert (CNBC)
Berkshire Hathaway Vice Chairman and partner of Warren Buffett Charlie Munger is warning against excess and forecasts a rocky road ahead. [Link; paywall]
Five Hedge Fund Heads Made More Than $1 Billion Each Last Year by Tom Maloney and Hema Parmar (Bloomberg)
The 15 highest-paid hedge fund managers took home more in compensation than the entire payroll of JP Morgan’s investment bank, even though some of them delivered literally zero return for investors. [Link; soft paywall, auto-playing video]
Japan
Why so many of the world’s oldest companies are in Japan by Bryan Lufkin (BBC)
More than 33,000 businesses in Japan are at least a century old, and a number of them have roots that run significantly deeper than that. [Link]
Japan’s Lost-and-Found System Is Insanely Good by Allan Richarz (Citylab)
75% of cash misplaced in Japan and more than 80% of lost cellphones are eventually returned thanks to a series of cultural and organizational imperatives. [Link]
Security
U.S. Officials Say Huawei Can Covertly Access Telecom Networks by Bojan Pancesvski (WSJ)
Mobile phone networks reliant on Huawei’s technologies are exposed to backdoors that are reminiscent of those the US government has asked tech companies for in the past. [Link; paywall]
The intelligence coup of the century by Greg Miller (WaPo)
A Swiss cryptography company was the sole provider of secure communications to a range of state actors. Unfortunately for its customers, the company was owned by the CIA. [Link; soft paywall]
This man says he’s stockpiling billions of our photos by Donie O’Sullivan (CNN)
More on the story of Hoan Ton-That and his company’s effort to introduce widespread facial recognition as a means of social control for law enforcement and other arms of government alike. [Link]
Strange History
Was Jeanne Calment The Oldest Person Who Ever Lived – Or A Fraud? by Lauren Collins (The NYer)
The French woman who died in 1997 at the claimed age of 122 got lots of scrutiny over the years, but there is good evidence she wasn’t who she claimed to be. [Link; soft paywall]
One Year in Helvetia West Virginia (The Bitter Southerner)
A tiny Appalachian village plays host to the legacy of Swiss immigrants that founded it after the Civil War, leaving behind a legacy of farming, cuisine, and music. [Link]
Fast Food
The Weirdest Subway Restaurant in America by Byron Tau (WSJ)
FBI training requires a realistic backdrop, including a sandwich shop in the midst of a giant training facility in Quantico, Virginia. While the bank robberies are fake, the footlongs are very real. [Link; paywall]
Popeyes sales surge an eye-popping 34% amid chicken sandwich craze by Heidi Chung (Yahoo!)
With the full roll-out of its incredibly popular chicken sandwich, Popeye’s sales have surged in an almost implausible surge of customer enthusiasm. [Link; auto-playing video]
An Ode to the Supermercado by José Olivarez (Chicago Mag)
A love letter to the ethnic grocery stores that are scattered across the crossroads of the Midwest, with piles of pork, fresh tacos, mounds of dried chiles, and every possible taste of home. [Link]
Tech
A BlackBerry Brought D’Angelo Russell to Minnesota by Marc Stein (NYT)
The end of BlackBerry devices and support for existing phones means that one of the most important tools in the NBA’s blockbuster trade department is about to disappear. [Link; soft paywall]
Apple Pay is on pace to account for 10% of all global card transactions by John Detrixhe (Quartz)
While it was a bit slow to start, Apple’s payments solution is now booming with 5% of global transactions and forecasts for double that share 5 years from now. [Link; soft paywall]
Streaming accounts for nearly one-fifth of total US TV watching, according to Nielsen by Anthony Ha (TechCrunch)
The growth of services like Netflix mean that one in five hours spent watch television took place on streaming services in the most recent Total Audience Report published by Nielsen. [Link]
Actors
Anthony Hopkins Talks To Brad Pitt About Movies, Mortality, And Mistakes (Interview Magazine)
Do you really need more incentive to click than two of the best-regarded leading men from two generations of Hollywood talent, spinning yarn about life, the universe, and everything? [Link]
Counting
Report: Census Bureau at risk of not being ready for count by Mike Schneider (AP)
A House committee meeting this week revealed a Government Accountability Office report that claims the Census is behind on a range of key metrics it needs to hit in order to accurately count the American people in its decennial survey this coming year. [Link]
Car ‘splatometer’ tests reveal huge decline in number of insects by Damian Carrington (The Guardian)
Counts of insects generated by instruments that measure insect density over roadways have reported a precipitous drop in the number of bugs, which could have all sorts of negative side-effects for the environment and human beings. [Link]
The birds, the bees and the Bank? The birth-rate channel of monetary policy by Fergus Cumming and Lisa Dettling (BoE Bank Underground)
Bank of England rate cuts in 2008 led to a large increase in cash flow via lower mortgage payments. As a result, the bank calculates 50,000 more births than would have taken place without support from monetary policy. [Link]
Happiness
What makes people happier than money, says new study from Yale and Oxford? by Danny Welch (The Hill)
Exercise may be the single most important thing you can do for your mental health, with bigger benefits than higher income or other material improvements. [Link; auto-playing video]
Read Bespoke’s most actionable market research by joining Bespoke Premium today! Get started here.
Have a great weekend!
The Closer: End of Week Charts — 2/14/20
Looking for deeper insight on global markets and economics? In tonight’s Closer sent to Bespoke clients, we recap weekly price action in major asset classes, update economic surprise index data for major economies, chart the weekly Commitment of Traders report from the CFTC, and provide our normal nightly update on ETF performance, volume and price movers, and the Bespoke Market Timing Model. We also take a look at the trend in various developed market FX markets.

The Closer is one of our most popular reports, and you can sign up for a free trial below to see it!
See tonight’s Closer by starting a two-week free trial to Bespoke Institutional now!
Another ‘Corona’ Friday
The S&P 500 has given up early gains and is now trading modestly lower in what has become an all too familiar pattern ever since the coronavirus entered the world stage in January. In fact, of the now seven Fridays so far in 2020, the S&P 500 has traded lower on the day six times. The one exception was the Friday heading into MLK weekend back on 1/17. Ever since then there’s been a genuine skittishness on the part of investors to add equity exposure into a 65+ hour window where markets are closed and who knows what type of headlines regarding the coronavirus will come out.
The chart below shows the S&P 500’s daily percent change in 2020 by weekday with each day of the week color-coded. It’s an admittedly small sample size, but Fridays are the only day so far this year where the S&P 500 has been down both on a median basis and more than half of the time. While Fridays have been poor for stocks, Mondays have been the best day of the week with a median gain of 0.70% and gains 80% of the time. It’s not often that people actually look forward to Mondays! Wednesdays and Thursdays haven’t been as strong for equities, but they have been even more consistent to the upside. The only down Wednesday so far in 2020 was 1/29 (-0.09%), while this past Thursday was the only down Thursday for the S&P 500 since Thanksgiving. Collectively, Tuesdays have been pretty uneventful with a median gain of just 0.01% and positive returns half of the time. On a more bullish note, though, two of the year’s three best days were Tuesdays. Start a two-week free trial to Bespoke Institutional to access our interactive economic indicators monitor and much more.

Reservations. It’s What’s for Dinner.
When it comes to monthly retail sales, one trend we have highlighted repeatedly over the years is the shift in American shopping habits from bricks and mortar to online establishments. Ten years ago, General Merchandise retailers accounted for 14.4% of total retail sales. At the same time, online sales which had already risen sharply over the years accounted for only 7.9% of total sales. Fast-forwarding to the present, online retail has continued to surge at the expense of General Merchandise retailers (among others) and now ‘clicks’ account for a larger share of total sales than ‘bricks’.
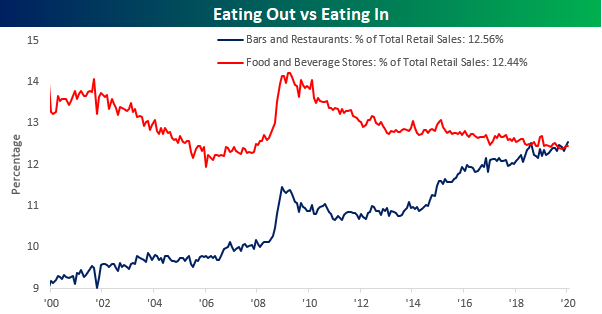
Another less discussed trend in American shopping habits is the shift from eating at home to eating out. While there was a time not so long ago when going out for dinner was considered a treat, for a lot of Americans today, home-cooked meals are out of the norm. The chart below shows the historical share of total sales that both Food and Beverage Stores and Bars and Restaurants have accounted for since 2000. Twenty years ago, sales at Food and Beverage stores accounted for 13.3% of total sales while Bars and Restaurants accounted for just 9.2%. As Americans increasingly eat out, though, sales at Bars and Restaurants have risen to 12.56% while sales at Food and Beverage Stores have been drifting lower to the current level of 12.44%. While both groups have been moving back and forth in recent months regarding which one has the lead in total share, in January, Bars and Restaurants overtook Food and Beverage Stores by the widest margin on record (0.12 percentage points). In most modern houses, the idea of a formal dining room has become obsolete, and who knows, the way things are going now, in fifty years the idea of a kitchen may sound just as quaint. Start a two-week free trial to Bespoke Institutional to access our interactive economic indicators monitor and much more.
Bespoke CNBC Appearance (2/14)
Bespoke co-founder Paul Hickey appeared on CNBC’s Squawk Box this morning to discuss the current market and the roads to 30K for the Dow and 10K for the Nasdaq. To view the segment, please click on the image below. Start a two-week free trial to Bespoke Institutional to access our interactive economic indicators monitor and much more.

Bespoke Morning Lineup — 2/14/20 — Semis Nearly Automatic
See what’s driving market performance around the world in today’s Morning Lineup. Bespoke’s Morning Lineup is the best way to start your trading day. Read it now by starting a two-week free trial to Bespoke Premium. CLICK HERE to learn more and start your free trial.
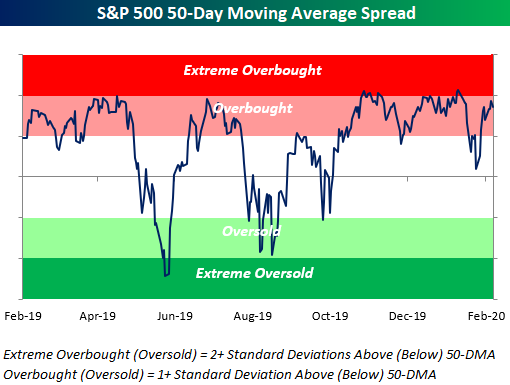
As shown below, the US equity market is entering the trading day in overbought (but not quite extreme) territory:
For a recap of all the latest on the coronavirus, earnings, and economic data, check out today’s Morning Lineup.
The Closer – Bounce, Valuations, EUR-Outta-Here – 2/13/20
Log-in here if you’re a member with access to the Closer.
Looking for deeper insight on markets? In tonight’s Closer sent to Bespoke Institutional clients, we begin by showing the bounce in more cyclical commodities and equities’ valuations. We also provide an update to EUR’s selloff before reviewing European stocks and their expected EPS over the next year. We then recap today’s 30 year bond auction. Turning to economic data, we review today’s inflation data.

See today’s post-market Closer and everything else Bespoke publishes by starting a 14-day free trial to Bespoke Institutional today!
Correction Come Down
In an earlier post, we detailed the improvements in AAII’s weekly sentiment survey. Another sentiment survey from Investors Intelligence also saw a substantial improvement in investors reporting as optimistic this week. The percentage of bullish newsletter writers in the Investors Intelligence survey rose 5.3 percentage points this week to 52.9%. That only brings it back to similar levels to last month, but it was also the largest week over week increase in bullish sentiment since a 5.4 percentage point increase in June of last year. A more notable move in this week’s survey was that of respondents looking for a correction. While there have been far higher readings over the past few years, similar to bullish sentiment, last week’s reading of just over 33% was the highest share of respondents expecting a correction since October. But as investors reassessed the negative implications of the coronavirus, this has come crashing down falling 5.4 percentage points week-over-week.

As shown below, while that 5.4 percentage point decline was far from the largest such decline in the history of the data going back to the late 1990’s (a 13.2 percentage point decline in June of 2012 holds that title), there have only been 29 other times that this reading on sentiment had fallen more than 5 percentage points in a single week. The most recent occurrence was in June of last year.

The performance of the S&P 500 following similar declines in ‘correction’ sentiment in the past has been mixed. While the S&P 500 has outperformed versus all other periods one week and 3 months later, one month, six months, and one year later have seen returns more inline or worse than other periods on a median and average basis. In other words, when fewer newsletter writers are looking for a correction or market pullback, better than average returns become slightly less likely. Start a two-week free trial to Bespoke Institutional to access our interactive economic indicators monitor and much more.
