Sentiment Stable
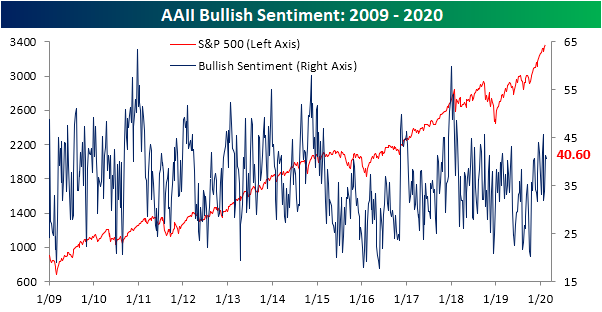
With the major indices little changed over the past week, sentiment readings from AAII‘s weekly investor survey likewise moved only slightly. The percentage of respondents reporting as bullish remains above 40% but pulled back slightly from 41.33% last week. The 0.73 percentage point drop was the smallest move in bullish sentiment (either positive or negative) since November 28th of last year when bullish sentiment fell only 0.6 percentage points.
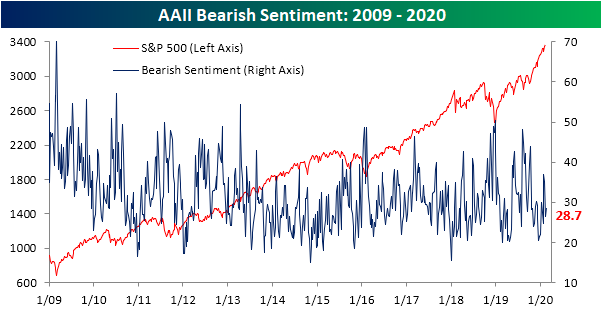
With bullish sentiment declining, respondents reporting as bearish picked up the difference rising 2.3 percentage points to 28.7%. Although up versus last week, bearish sentiment remains fairly subdued at 1.63 percentage points below the past year’s average of 30.33% and around the low end of the past several years’ range.
Neutral sentiment was also little changed, dropping 1.47 percentage points to 30.8%. Similar to bearish sentiment, neutral sentiment continues to come in at the low end of its range as it has averaged readings of 35.9% over the past year. This was the sixth week in a row that neutral sentiment has come in below its 52-week average; the longest such streak since a 15-week long streak ending in January of last year. Start a two-week free trial to Bespoke Institutional to access our interactive economic indicators monitor and much more.

Jobless Claims Match Expectations
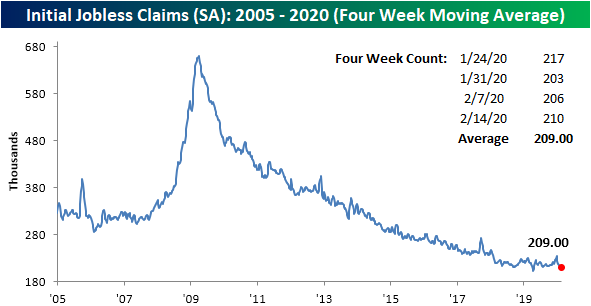
Initial jobless claims totaled 210K this week, matching expectations but rising slightly from an upwardly revised 206K last week. Despite the increase, claims remain low no matter how you measure it.
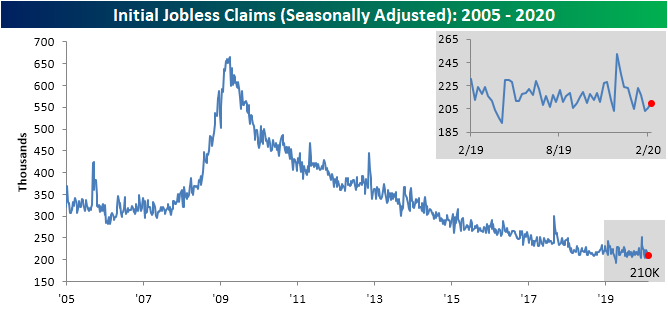
The past few weeks have seen claims come in at some of their strongest levels since the cycle low of 193K that was put in place back in April. Without a continued move to the downside though, that April low is still firmly in place. That means it has now been 44 weeks without a new cycle low in seasonally adjusted jobless claims. Looking back since the end of the Financial Crisis, that ties another 44-week long streak that came to an end in July of 2014. Given claims remain at healthy levels just off of those cycle lows, this seems to point more towards the indicator having plateaued rather than deteriorating.

Even though claims rose this week, a higher reading of 223K rolled off of the four-week moving average which led the average to drop 3.25K. That leaves the four-week average at 209K which is the lowest reading since mid-April when it reached 206K. That was also only one week after the moving average put in its cycle low of 201.5K
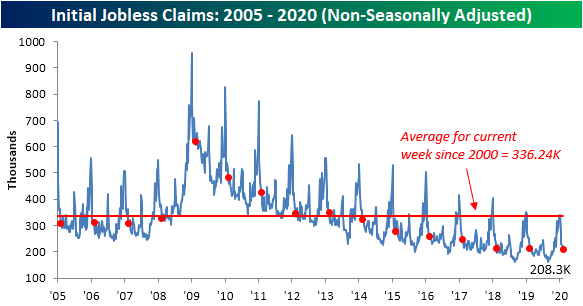
On a non-seasonally adjusted basis, jobless claims continued to decline as is seasonally normal for this time of year, falling to 208.3K. That is 2.4K lower than the comparable week last year and the lowest reading for the current week of the year for all years of the current cycle. Given this, it is also well over 100K below the average for the current week of the year since 2000. Start a two-week free trial to Bespoke Institutional to access our interactive economic indicators monitor and much more.
Bespoke’s Morning Lineup – 2/20/20 – Philly Special
See what’s driving market performance around the world in today’s Morning Lineup. Bespoke’s Morning Lineup is the best way to start your trading day. Read it now by starting a two-week free trial to Bespoke Premium. CLICK HERE to learn more and start your free trial.
Wow! That was an impressive print in the Philly Fed Manufacturing report. While economists were expecting the headline index to come in at a level of 11.0, the actual reading was more than triple that at 36.7. While the Philly Fed report tends to be volatile, this morning’s release was the strongest relative to expectations going back to at least 1998! Not only that, but the actual level of the index is also one of the strongest readings we have seen since the mid-1990s. Jobless Claims were also strong coming right in line with expectations at a level of 210K. So, how many cuts was the market pricing in?
Read today’s Bespoke Morning Lineup below for the latest on the impact of the coronavirus, the major shift in betting markets following last night’s Democratic debates, earnings data out of Europe, and the latest credit growth figures out of China.

As fears over the coronavirus start to ebb, Chinese stocks have been on a tear. Since reopening from the Lunar New Year holiday earlier this month, the Shanghai Composite has rallied more than 11% and actually closed last night above where it finished heading into the holiday. There has been a consensus among investors that the impact of the coronavirus would be transitory, but we’re not sure anyone expected all of the post-New Year declines to be erased in just three weeks!

The Closer – Dollar Dominance, Silver Surge, Fed Musing, Strong Data – 2/19/20
Log-in here if you’re a member with access to the Closer.
Looking for deeper insight on markets? In tonight’s Closer sent to Bespoke Institutional clients, we first give our thoughts on the massive move in USDJPY before turning to the continued rally in precious metals, namely silver. Pivoting over to the Fed minutes released today, we then show market projections of monetary policy. Next, we review today’s strong housing data and producer prices.

See today’s post-market Closer and everything else Bespoke publishes by starting a 14-day free trial to Bespoke Institutional today!
Fixed Income Weekly – 2/19/20
Searching for ways to better understand the fixed income space or looking for actionable ideas in this asset class? Bespoke’s Fixed Income Weekly provides an update on rates and credit every Wednesday. We start off with a fresh piece of analysis driven by what’s in the headlines or driving the market in a given week. We then provide charts of how US Treasury futures and rates are trading, before moving on to a summary of recent fixed income ETF performance, short-term interest rates including money market funds, and a trade idea. We summarize changes and recent developments for a variety of yield curves (UST, bund, Eurodollar, US breakeven inflation and Bespoke’s Global Yield Curve) before finishing with a review of recent UST yield curve changes, spread changes for major credit products and international bonds, and 1 year return profiles for a cross section of the fixed income world.
In this week’s report we look at the relationship between commodities prices and ten year rates.

Our Fixed Income Weekly helps investors stay on top of fixed income markets and gain new perspective on the developments in interest rates. You can sign up for a Bespoke research trial below to see this week’s report and everything else Bespoke publishes free for the next two weeks!
Click here and start a 14-day free trial to Bespoke Institutional to see our newest Fixed Income Weekly now!
A Dow Without Boeing (BA)
For more than a year now, Boeing (BA) has been plagued by the 737 MAX crisis which has weighed on shares of the plane manufacturer with it now currently down nearly 20% from when the initial groundings took place on March 10th of last year. Despite this, while underperforming the broader market due to the 737 issues, the stock is actually still up just over 5% since the start of 2019.
Even though BA has lagged, it is still the highest-priced of the 30 stocks in the price-weighted Dow Jones Industrial Average. Currently trading around $338.50, the only stocks in the index holding a candle to BA are Apple (AAPL) and UnitedHealth (UNH), which also trade north of $300 per share. That means these stocks have the highest weighting in the index and therefore have a much larger impact than other stocks on the Dow’s performance.
With BA’s issues, a number of people have pondered the what-ifs for the Dow had the company not had the issues with the 737. Would we have already broken out the Dow 30K hats were it not for BA? In the chart below, we show the actual performance of the DJIA and have overlaid the performance of an ‘alternate Dow’ showing its performance if BA had not been in the index since the start of 2019. We used the start of 2019 instead of the actual date of the groundings as it is a little less arbitrary. By our calculations, while we would be a bit closer, even if BA wasn’t in the index since the start of 2019, we wouldn’t quite be at Dow 30K yet. As shown, our alternate Dow would be almost 1% or 266 points higher if Boeing was not included in the index since the start of 2019.
While BA has been a drag on the DJIA since last March, it also provided a big boost to the index in early 2018 before the 737 issues hit the stock. In fact, at the start of March 2017, BA was up over 36% YTD and the spread between the Dow’s performance with and without BA was around 700 points in the other direction as it is now!

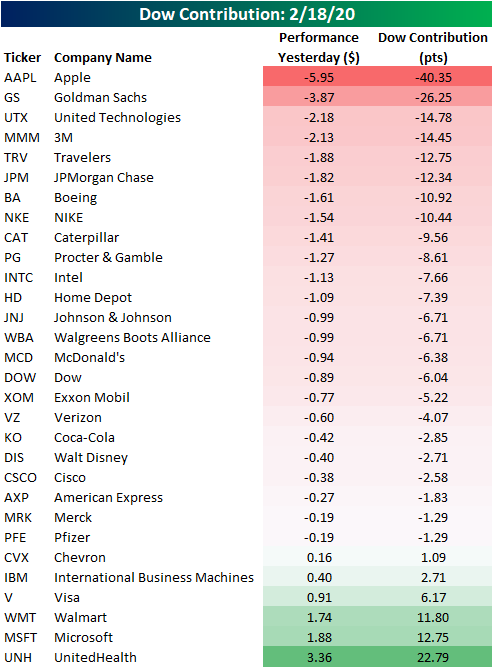
Another example of this dynamic in which high priced stocks have a greater impact on the index was observed on Tuesday when Apple’s (AAPL) stock fell after the company warned that Q1 revenues would be shy of prior guidance due to the coronavirus. The warnings sent shares down over 3% at its intraday lows, but the stock only finished down 1.83%. While there were equivalent or larger declines like Dow (DOW) or Walgreens Boots Alliance (WBA) in Tuesday’s session, AAPL’s declines by far weighed on the index more than any other stock. Of the Dow’s 165.89 point decline, AAPL contributed 40.35 points. Fortunately, UNH helped to mitigate some of those losses as it had a positive impact on the index of +22.79 points. Start a two-week free trial to Bespoke Institutional to access our Closer, full list of interactive tools, and much more.
Bespoke’s Global Macro Dashboard — 2/19/20
Bespoke’s Global Macro Dashboard is a high-level summary of 22 major economies from around the world. For each country, we provide charts of local equity market prices, relative performance versus global equities, price to earnings ratios, dividend yields, economic growth, unemployment, retail sales and industrial production growth, inflation, money supply, spot FX performance versus the dollar, policy rate, and ten year local government bond yield interest rates. The report is intended as a tool for both reference and idea generation. It’s clients’ first stop for basic background info on how a given economy is performing, and what issues are driving the narrative for that economy. The dashboard helps you get up to speed on and keep track of the basics for the most important economies around the world, informing starting points for further research and risk management. It’s published weekly every Wednesday at the Bespoke Institutional membership level.
You can access our Global Macro Dashboard by starting a 14-day free trial to Bespoke Institutional now!

Bespoke’s Morning Lineup – 2/19/20 – Gold Glitters
See what’s driving market performance around the world in today’s Morning Lineup. Bespoke’s Morning Lineup is the best way to start your trading day. Read it now by starting a two-week free trial to Bespoke Premium. CLICK HERE to learn more and start your free trial.
Housing data continues to show a strong foundation as this morning’s reports on January Housing Starts and Building Permits both exceeded expectations by more than 100K! The last time both reports exceeded expectations by more than 100K was last August’s report. Before that, though, you have to go back more than 10 years to find the next occurrence. That was the good news. The bad news was that PPI also exceeded expectations by a wide margin with the highest reported reading (0.5%) since October 2018. Futures haven’t budged much on the news, though, and are still indicating a positive open of about 0.25%.
Read today’s Bespoke Morning Lineup below for the latest on the impact of the coronavirus (including an important milestone in reported cases), earnings data out of Europe, and Japanese trade data.
We’ve been highlighting the bullish pattern in the price of gold for several weeks now, and after bouncing at support in the prior couple of weeks, prices broke out overnight to their highest levels in about seven years. With price convincingly above the $1,600 level, look for that psychological level to provide support going forward.

What’s interesting about the recent rally in gold, and as we discussed in last night’s Closer, the current rally has coincided with a stronger dollar, which overnight rallied to its best levels since last summer, so it’s not a weaker dollar that’s causing the recent rush into gold.

The Closer – Commodities Corner, Contribution Season, TICS Flows, Trade Monitor – 2/18/20
Log-in here if you’re a member with access to the Closer.
Looking for deeper insight on markets? In tonight’s Closer sent to Bespoke Institutional clients, we begin with a look at gold’s rally across currencies and crude’s move back into contango. We then show just how much Apple (AAPL) contributed to the S&P 500’s declines today before turning to TIC flows. Switching over to international data, we also show Singapore trade and Hong Kong container data.
See today’s post-market Closer and everything else Bespoke publishes by starting a 14-day free trial to Bespoke Institutional today!
Performance Throughout The Presidencies
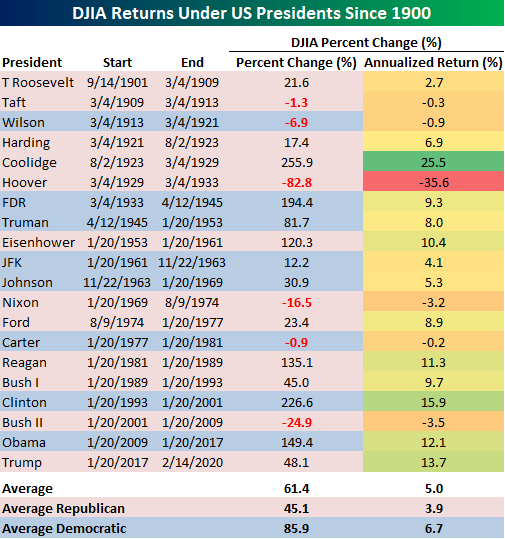
As markets were closed to observe Presidents Day yesterday and the 2020 Presidential election continues to ramp up, we thought it would be a good time to check up on stock performance during different administrations. In the table below, we show the performance of the Dow during the administrations of every US president since 1900 in addition to the annualized return. In the time since President Trump was sworn into office, the Dow has risen 46.9%. On an annualized basis, the 13.3% return places the current administration in 3rd place for the strongest performance. Only the Clinton administration in the 1990s and Coolidge administration in the 1920s have observed stronger annualized gains. The one caveat of course is that President Trump’s term (or terms) has yet to end. Comparing Democratic and Republican administrations since 1900, Democratic presidencies have tended to average stronger returns than their Republican peers, so the stock market’s returns under President Trump have deviated somewhat from the norm.
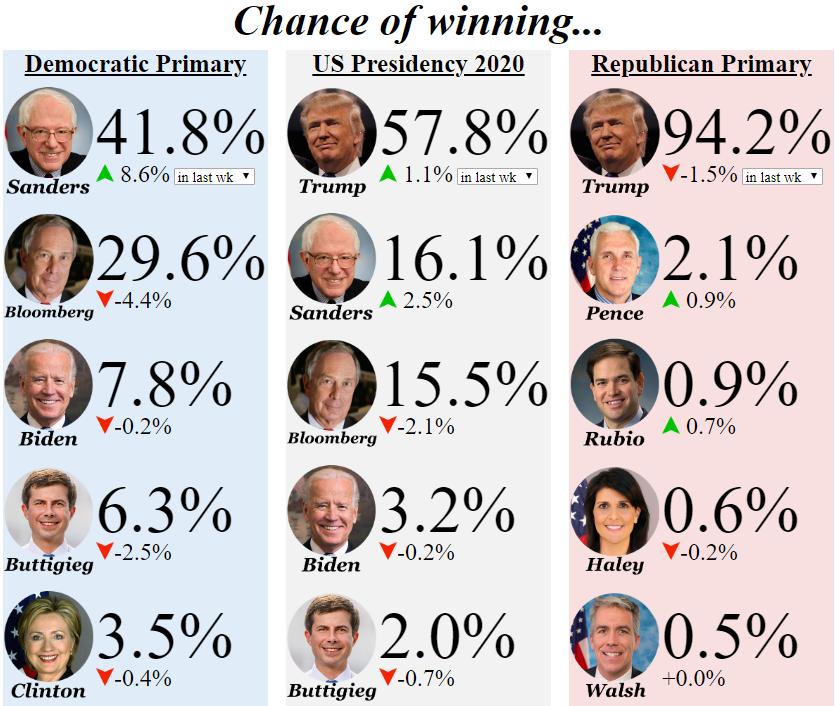
While it is impossible to say what a candidate’s election will mean for the market, at the moment betting markets favor the incumbent to win the presidency while Bernie Sanders and Michael Bloomberg go back and forth in taking the number 2 spot, hovering around 15%-16%. Come Super Tuesday (March 3rd) when we could finally see more clarity on the Democratic side, the back and forth between Bloomberg and Sanders might become more one-sided Start a two-week free trial to Bespoke Institutional to access our Bespoke Report and much more.