Lots Of Businesses, Not So Many Jobs
The US Census has started releasing an experimental data set that shows the quarterly rate of new business start-ups based on tax filing data. As shown in the chart below, while the total number of businesses started in the US reached a record in the fourth quarter of 2019, they did so thanks entirely to applications which did not include planned wage outlays. In other words, most new businesses don’t plan to immediately employ people, which is part of the explanation of weaker business dynamism in the United States. Instead of businesses starting up and immediately ramping up, the vast majority of new businesses don’t actually hire workers. In short, there are a lot of businesses being started, but they’re on average having a much smaller impact than has historically been the case. Get access to all of Bespoke’s research with a two-week free trial to Bespoke Institutional. You won’t be disappointed!
The Closer – Banking On Earnings, PPI Pause, Beige Book, Business Starts – 1/15/20
Log-in here if you’re a member with access to the Closer.
Looking for deeper insight on markets? In tonight’s Closer sent to Bespoke Institutional clients, we begin with a look at analyst earnings estimates which have been on the rise before reviewing returns on equity and credit markets for banks. Next, we review today’s release of PPI and update our Beige Book index. We then take a look at census data on business start ups. We close out tonight with our weekly look at EIA data.

See today’s post-market Closer and everything else Bespoke publishes by starting a 14-day free trial to Bespoke Institutional today!
The Largest Stocks Weigh Heavy on the S&P 500
There has been plenty of chatter recently concerning the impact of the largest stocks in the S&P 500 on the broader index. As shown in the chart below, 2020 began with the market caps of Apple (AAPL), Microsoft (MSFT), Alphabet (GOOGL), Amazon (AMZN), and Facebook (FB) totaling 17.3% of the S&P 500’s total market cap. Since at least 1990, that is the largest percentage of total market cap that has been taken up by the top five stocks at the start of the year. The only other year with the top five stocks holding a comparably high weighting is 2000 when it was 17%. That year the five stocks that held the highest share of total S&P 500 market cap were Microsoft (MSFT), General Electric (GE), Cisco (CSCO), Walmart (WMT), and Intel (INTC). While MSFT is the only one to have stayed on this list for all but one year (2001) since then, GE currently has fallen to the 66th largest stock in the index, CSCO the 27th, WMT is the 10th largest, and INTC is the 18th largest. Start a two-week free trial to Bespoke Institutional to access our full library of research and interactive tools.

Fixed Income Weekly – 1/15/20
Searching for ways to better understand the fixed income space or looking for actionable ideas in this asset class? Bespoke’s Fixed Income Weekly provides an update on rates and credit every Wednesday. We start off with a fresh piece of analysis driven by what’s in the headlines or driving the market in a given week. We then provide charts of how US Treasury futures and rates are trading, before moving on to a summary of recent fixed income ETF performance, short-term interest rates including money market funds, and a trade idea. We summarize changes and recent developments for a variety of yield curves (UST, bund, Eurodollar, US breakeven inflation and Bespoke’s Global Yield Curve) before finishing with a review of recent UST yield curve changes, spread changes for major credit products and international bonds, and 1 year return profiles for a cross section of the fixed income world.
In this week’s report we review the technical backdrop for yields.

Our Fixed Income Weekly helps investors stay on top of fixed income markets and gain new perspective on the developments in interest rates. You can sign up for a Bespoke research trial below to see this week’s report and everything else Bespoke publishes free for the next two weeks!
Click here and start a 14-day free trial to Bespoke Institutional to see our newest Fixed Income Weekly now!
Bespoke’s Global Macro Dashboard — 1/15/20
Bespoke’s Global Macro Dashboard is a high-level summary of 22 major economies from around the world. For each country, we provide charts of local equity market prices, relative performance versus global equities, price to earnings ratios, dividend yields, economic growth, unemployment, retail sales and industrial production growth, inflation, money supply, spot FX performance versus the dollar, policy rate, and ten year local government bond yield interest rates. The report is intended as a tool for both reference and idea generation. It’s clients’ first stop for basic background info on how a given economy is performing, and what issues are driving the narrative for that economy. The dashboard helps you get up to speed on and keep track of the basics for the most important economies around the world, informing starting points for further research and risk management. It’s published weekly every Wednesday at the Bespoke Institutional membership level.
You can access our Global Macro Dashboard by starting a 14-day free trial to Bespoke Institutional now!

Bespoke’s Morning Lineup – 1/15/20 – More Bank Beats
See what’s driving market performance around the world in today’s Morning Lineup. Bespoke’s Morning Lineup is the best way to start your trading day. Read it now by starting a two-week free trial to Bespoke Premium. CLICK HERE to learn more and start your free trial.

It’s the second day of earnings season, and although only six companies reported this morning on a combined basis, they generated just under $108 billion in revenues. Relative to expectations, the results were also strong. The only company to miss top-line revenue forecasts was UnitedHealth (UNH) while the only one to miss EPS forecasts was Goldman Sachs (GS). In the case of Goldman, though, if you back out a litigation expense for that company, results were much stronger than expected. Despite the strong results from companies reporting, the initial reaction from investors has been to sell the news as most of these companies are trading down in the pre-market.
Outside of earnings, shares of Target (TGT) are down sharply after reporting weaker than expected holiday sales. The stock had been a darling in the retail sector over the last year, so this bad news is having an outsized impact on the stock which is trading down over 5% in the pre-market. While TGT is a large retailer, we would caution against extrapolating this as a sign of consumer weakness at this point.
In economic news, the December PPI missed expectations on both a headline and core basis, and that follows yesterday’s CPI which also missed forecasts at both the headline and core level. If the FOMC is looking for significant and persistent inflation, it’s going to have to wait a bit longer.
Investors have had somewhat of a ‘sell the news’ reaction to the initial reports this earnings season, and one big reason is that the markets have rallied sharply heading into the reporting period. As shown in our snapshot of S&P 500 sectors in our Trend Analyzer, every sector with the exception of Materials is currently trading at overbought levels including three that are at what we classify as ‘extreme’ overbought levels.

The Closer – High Commodities, Low Inflation, Picking APAC – 1/14/20
Log-in here if you’re a member with access to the Closer.
Looking for deeper insight on markets? In tonight’s Closer sent to Bespoke Institutional clients, we kick things off with a look at what copper and crude oil are suggesting for the health of the global economy. Turning to inflation data, we review today’s CPI release as well as what it means for the path of the Fed. In addition to today’s CPI release, we also look at leading inflationary indicators. We then glimpse at credit spreads before evaluating the attractiveness of APAC countries.
See today’s post-market Closer and everything else Bespoke publishes by starting a 14-day free trial to Bespoke Institutional today!
More New Highs Than Lows
Included with each day’s Morning Lineup and Closer is our Daily Sector Snapshot which offers a look across the internals of the S&P 500 and its eleven individual sectors. One such indicator covered is the net percentage of stocks reaching new 52-week highs. This is essentially the difference between the number of stocks that closed at a 52-week high and 52-week low for a given day.
Typically you would want to see positive readings as it would indicate more positive momentum. For multiple sectors, this reading has begun to spike up recently. Perhaps the most obvious of these is for the Communication Services sector which topped out at 30% about one week ago as many of its stocks have recently outperformed including some of the largest like Facebook (FB) and Google’s parent company Alphabet (GOOGL). For this sector, these were by far the highest new-high readings of the past year. The Technology sector likewise peaked at over 30% last week although for this sector such readings have more precedence in the past year. Similarly, Consumer Staples, HealthCare, and Financials have also begun to pick up over the past several days. While these are working their way back up to similar readings to a few weeks ago, the Utilities sector has begun to see some of the highest number of net new highs since the fall. At the current moment, the Materials sector is the only one with more 52-week lows being made than 52-week highs. Start a two-week free trial to Bespoke Institutional to get our Closer, Morning Lineup, and Daily Sector Snapshot.

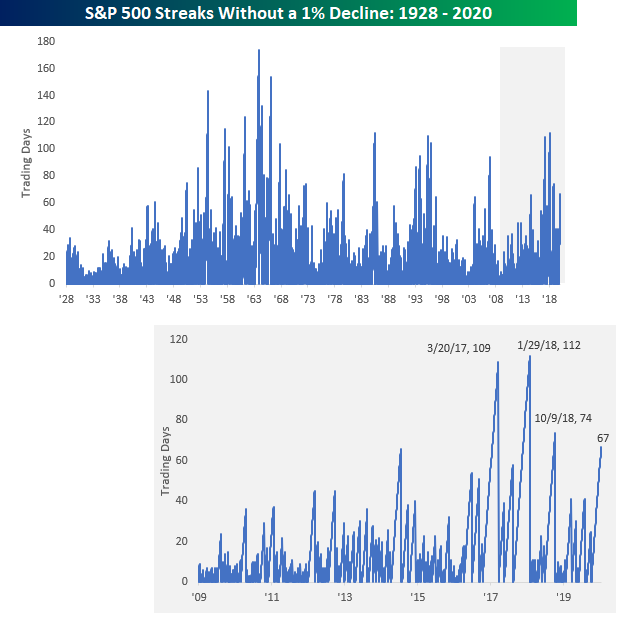
Three Months And Counting Since Last 1% Decline
It has now been over three months since the S&P 500’s last decline of 1% or more back on 10/9. While it seems like an eternity, the current streak of 67 trading days is nowhere near any sort of record on either a long or short-term basis. The chart below shows historical streaks without a decline of 1%+ for the S&P 500 dating back to 1928. The record for the longest streak was back in 1963 when the S&P 500 went 174 trading days – a full eight months – without a 1% drop. Even more impressive is the fact that in both the 1950s and 1960s there were numerous streaks of 100 or more days. For a decade that is looked back on as one with a lot of upheaval in the US, the 1960s was a period of relative calm for the equity market.
More recently, the current streak of 67 trading days doesn’t look all that impressive relative to streaks we saw back in 2017 and 2018. Right after the election in 2016 and into March of 2017, the S&P 500 had a 109-day streak without a 1% decline, and then from late 2017 through January 2018, there was another streak of 112 trading days without a 1% drop. Even in October 2018, there was another streak of 74 trading days. In other words, in just the last three years there have been three longer streaks without a 1% decline than the current one. In the S&P 500’s history, there have been 26 other streaks that have been as long or longer than the current one, and half of those went on to last at least 100 trading days. Get access to all of Bespoke’s research with a two-week free trial to Bespoke Institutional. You won’t be disappointed!
Bespoke’s Morning Lineup – 1/14/20 – And They’re Off!
See what’s driving market performance around the world in today’s Morning Lineup. Bespoke’s Morning Lineup is the best way to start your trading day. Read it now by starting a two-week free trial to Bespoke Premium. CLICK HERE to learn more and start your free trial.