Another Streak Ends
After a false alarm Tuesday, the S&P 500 finally closed above its 200-day moving average (DMA) on Wednesday for the first time since 2/27.

At 57 trading days, the just-ended streak of closes below the 200-DMA was the longest streak since the 61-day stretch ending in October 2011. But while this was the longest streak below the 200-DMA for the S&P 500 in over eight years, from a longer-term perspective, it looks almost minuscule. In May 2009, the S&P 500 ended a streak of 358 trading days below its 200-DMA, and there have been a total of nine streaks that spanned more than 200 trading days. In terms of 50-trading day streaks below the 200-DMA, there have now been a total of 34.

In a just-released report, we looked at the S&P 500’s performance following similar upside breaks of the 200-DMA. For anyone interested, sign up for a monthly Bespoke Premium membership now!
The Losers
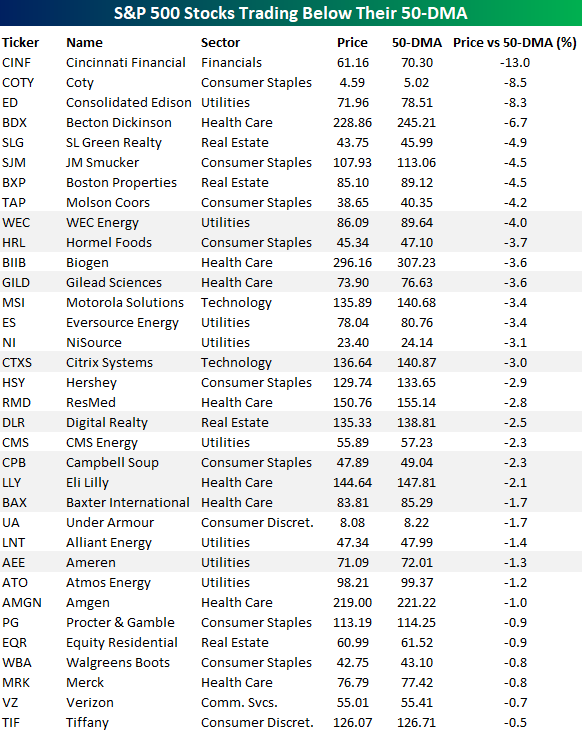
There’s been a number of different stories flowing around this morning regarding the fact that more than 90% of stocks in the S&P 500 are above their 50-day moving averages (DMA) and how that has historically been a bullish indicator for the subsequent performance of the market. Rather than focus on all of those winners, though, we wanted to look at some of the losers, namely, the S&P 500 stocks that are currently below their 50-DMA.
The table below lists the 34 S&P 500 stocks that were trading below their 50-DMAs as of this morning. Not only are there a relatively small number of stocks on the list, but seven of them are within 1% of their 50-DMAs and only four are more than 5% below. In other words, if the equity rally continues to have legs, this list could quickly shrink even more.
In looking through the names on the list, two notable trends stood out. First, although Energy, Financials, and Industrials are the worst performing sectors so far this year, Cincinnati Financial (CINF) is the only stock on the list from one of those sectors (Financials). Meanwhile, Technology, the top-performing sector in the S&P 500 so far this year, accounts for two of the names on the list (Motorola Solutions – MSI and Citrix Systems – CTXS). The sectors that account for the most names on the list are Consumer Staples (8), Utilities (8), and Health Care (7).
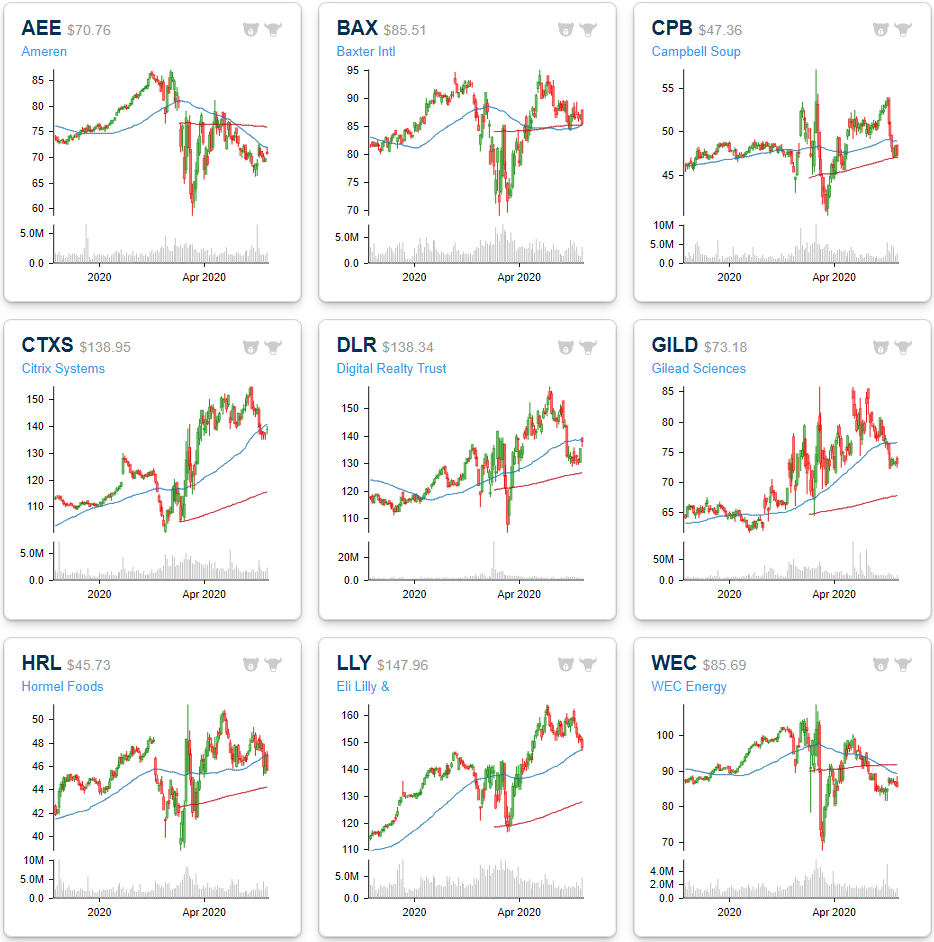
A second notable aspect of the names listed pertains to recent performance. In going through the charts of the names listed, you would expect to mostly see charts of bombed-out stocks that were so weak that they couldn’t even manage to rally in this environment. While that was the case for many of them, there were also a number of stocks that actually outperformed in the initial stages of the bear market, but have started to fall apart either later in the decline, or in many cases, after the market bottomed. The nine stocks shaded in the table below (charts below) all traded at 52-week highs at least two weeks after the S&P 500 peaked in late February. These are all generally names that investors thought would benefit from the pandemic and a prolonged decline. Now that markets have stabilized, though, and the economy appears to be on the mend, there’s been a rotation out of them. One example is Citirix Systems (CTXS). After hitting a 52-week high as recently as May 11th, it now finds itself on the loser list. Start a two-week free trial to Bespoke Institutional to access all of our research and interactive tools.
Bespoke’s Morning Lineup – 5/27/20 – It’s Not How You Start But How You Finish
See what’s driving market performance around the world in today’s Morning Lineup. Bespoke’s Morning Lineup is the best way to start your trading day. Read it now by starting a two-week free trial to Bespoke Premium. CLICK HERE to learn more and start your free trial.
Concerns yesterday afternoon regarding tensions between the US and China have disappeared this morning, and US equity futures have bounced back following Tuesday’s last hour decline. Also helping sentiment this morning is a proposed 750 billion Euro recovery fund for member nations and reports that the Japanese government is also considering an additional $1.1 trillion in stimulus.
Airlines, cruises, and other groups hit especially hard from the COVID outbreak are surging this morning with the airlines ETF (JETS) up over 8% and the cruise operators all up over 10%.
Be sure to check out today’s Morning Lineup for a rundown of the latest stock-specific news of note, news in global markets, global and national trends related to the COVID-19 outbreak, and much more.

After taking into account this morning’s rally in equity futures, the S&P 500 is up over 3.5% month to date- a good month by just about every account. One part of the day where strength has been lacking, though, is the last hour of trading. Yesterday, was a prime example. What was a gain of well over 2% earlier in the day turned into only a little more than 1% by the closing bell as a late-day decline negated what would have been the S&P 500’s first close above its 200-DMA in over ten weeks.
We covered this issue in more detail in last week’s Bespoke Report, but yesterday’s intraday chart provides a good example. What was an impressive rally for the market, looked a lot less so by the end of the day and the S&P 500 ultimately was unable to close above its 200-DMA yesterday. Today it will have another chance. All we need is a strong finish- something that has been far from automatic this month.

Dallas Fed Manufacturing Surges But Conditions Still Declining
This morning, the Dallas Fed updated its monthly manufacturing survey. Like other regional Federal Reserve indices of late, May saw a substantial improvement from April though the index, as well as its components, remain at extremely low levels. The 24.8 point increase from April’s -74 to May’s -49.2 was the largest one month increase on record but only leaves it in the 4th percentile of all readings. Today’s reading was also well ahead of consensus expectations for a reading of -61.0. The headline number for the six-month outlook also rose by 24 points which is in the 98th percentile of all MoM changes.
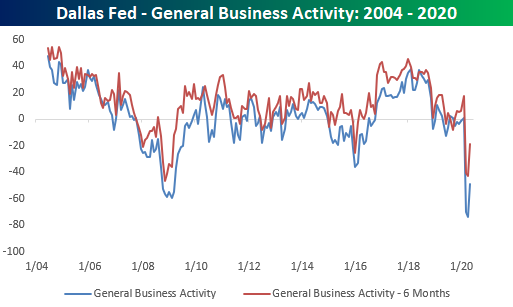
Given the improvement of the headline number, just about every component saw improvement with the exception of the index for finished good inventories which fell by 0.1 points. But that does not mean every component is showing expansionary readings. As with other regional Fed indices, conditions are still worsening just not at the same pace as in April. While it may not necessarily be a positive, only raw material prices is showing an expansionary reading (above 0). But as for six-month outlooks, the picture is a bit more optimistic.

Take a few of the components for production and demand. While current production and capacity utilization are still showing readings deep in contractionary territory, the indices for six months ahead surged to actually show expansionary readings this month. For production, that is the widest divergence between the six-month and current outlooks on record. While not at a record, the spread between the six-month and current outlook for capacity utilization is also in the 99th percentile. The same can be said for new orders and new order growth rate as both spreads are in the 95th percentile of all readings.
For production and capacity utilization, the readings this month for six-month outlook rose to pretty much within range of the past several years. In other words, Texas area manufacturers expect production to nearly return to normal in six months. The six-month outlook for new orders, though, is not as optimistic with May’s reading still much further below its range, meaning demand is not expected to ramp back up to quite the same degree as production.

As for employment, these indices seem to echo weekly jobless claims of late. Even though Texas manufacturers are still taking on fewer employees, the pace has improved from April. But there also does not appear to be much in the way of plans to expand workforces in the future. The six-month outlook for employment is still showing contraction, although hours worked are expected to rise. Start a two-week free trial to Bespoke Institutional to access our interactive economic indicators monitor and much more.

Stock Jockeys Driving The Market?
“Many Americans used part of their coronavirus stimulus check to trade stocks.” – CNBC
“Day Trading Has Replaced Sports Betting as America’s Pastime.” – Barron’s
“Frustrated sports punters turn to US stock market.” – FT
“Many Americans used coronavirus stimulus check money to trade stocks.” – The Sun
We could go on and on with headlines like the ones above. As equities made new short-term highs last week, the pace of articles suggesting that the rally was being driven by unemployed Americans on their couches with nothing better to do but trade stocks increased at a fever pitch. This is not the type of foundation you want to build a rally on. Either out of work Americans are eventually going to find new jobs as the economy opens up and no longer have time to trade, or they are going to run out of money and have no money to trade.
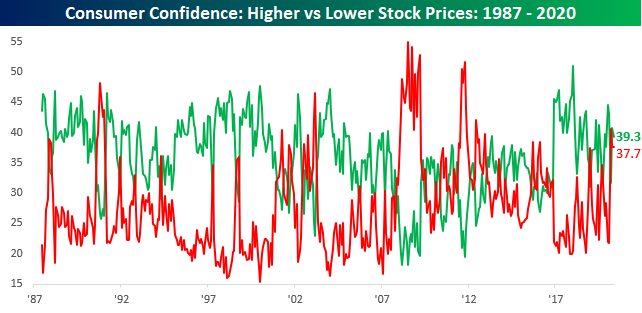
Given all of these headlines last week, we were eager to see today’s report on Consumer Confidence for May, and more specifically, the section of the report that asks consumers whether they expect stock prices to increase or decline. This is an important indicator of sentiment because rather than gauging the sentiment of investors who likely follow the market on a regular basis, the people surveyed in the Consumer Confidence report provides a more representative sample of the ‘average Joe’. Extreme readings in sentiment on the part of the general public typically represent strong contrarian signals.
One would think that if a large number of consumers were sitting at home trading stocks, then we would see an uptick in general sentiment towards stock prices. That’s exactly what we saw back in late 2017 and early 2018 when stocks were breaking out and bitcoin was going bananas. Shortly thereafter, though, the S&P 500 experienced its first 10% correction in well over a year and then essentially traded sideways for the next year and a half.
In this month’s report, though, the percentage of consumers expecting higher stock prices actually saw a slight decline, falling from 40.8% down to 39.3% while the percentage of consumers expecting stock prices to decline actually rose slightly from 37.6% up to 37.7%. While the percentage of consumers expecting higher stock prices is still slightly higher than the percentage expecting lower prices, the spread remains minimal at 1.6 percentage points. What to make of this report? While on the couch traders have likely played a role in the rally off the March lows, we would say that their actual role in driving the rally is a lot less than the headlines would suggest. Start a two-week free trial to Bespoke Premium to access our most actionable market research and interactive investor tools.

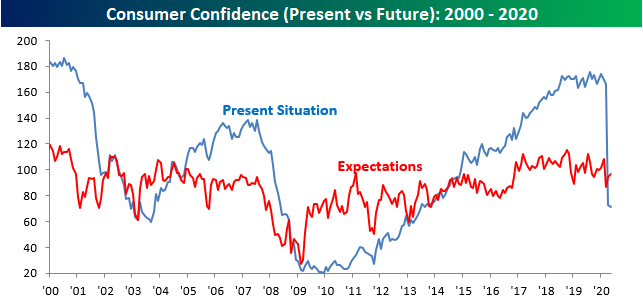
Consumer Confidence Inches Higher
Consumer Confidence showed a slight improvement in May, rising from 85.7 up to 86.6 but below consensus expectations for a reading of 87.0. While this month’s print was weaker than expected, the fact that confidence didn’t decline further is a moral victory and provides additional signs that activity bottomed out in April.

All of the improvement in this month’s report came from expectations which ticked higher for the second straight month while the Present Situation component actually made another low, falling to its lowest level since August 2013. It’s good to see that consumers are relatively upbeat about the future, but if the Present Situation index keeps making new lows, that will eventually bleed into sentiment towards the future as well. The key here will be Summer. Things will likely spiral in one way or the other. Either people come out and case counts start to spiral higher, or case counts remain stable and social activity spirals higher.
One reason we haven’t seen a bounce in consumer sentiment towards the Present Situation is that consumers feel increasingly uneasy about the job market. In this month’s survey, only 17.4% of consumers believe jobs are plentiful – a level not seen since 2014. This low of a reading is only natural when the majority of retail businesses are closed, but as things start to open back up, the hope, at least, is that job opportunities increase. Start a two-week free trial to Bespoke Premium to access our most actionable research and interactive tools.

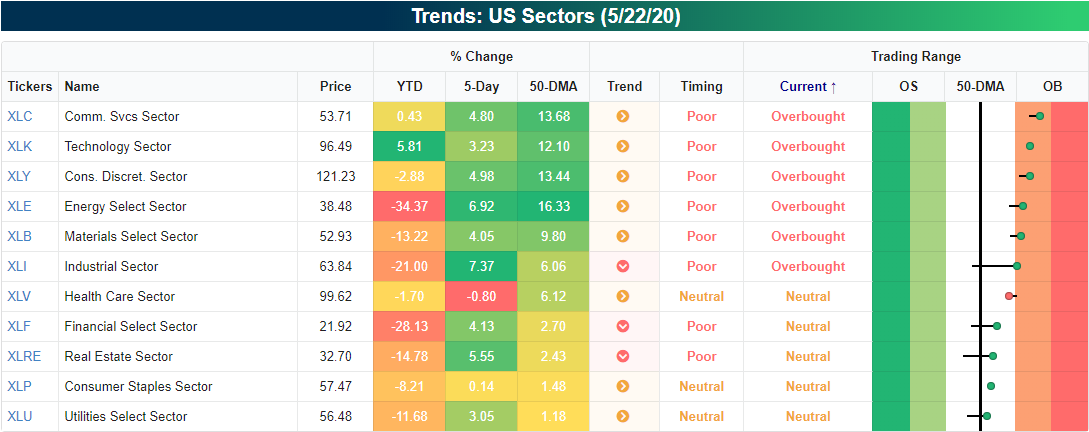
Sectors Moving Towards Overbought
The S&P 500 has managed to trade in overbought territory for most of the past week. Looking across the eleven major S&P 500 sectors, six are overbought (over 1 standard deviation above its 50-DMA) at the moment while five are neutral (within 1 standard deviation of its 50-DMA). Industrials, a recent laggard, was the best performing sector last week, gaining 7.2%. That rally led the sector to not only take out its 50-DMA but also move into overbought territory. Financials, Real Estate, and Utilities which have also fallen behind performance-wise recently also managed to finish above their moving averages though they have not reached overbought territory just yet. Regardless, conditions across sectors are broadly overbought at the moment if not approaching overbought.
Screens Showing More Good Than Bad
In our Trend Analyzer and Chart Scanner tools, we run daily screens of things like 52-week highs and lows and Golden Crosses and Death Crosses to name a few. Looking across these screens today, there seems to be more good than bad to start off the summer. As of Friday’s close there were a total of 65 new 52 week highs all of which are shown below. Some of these are retailers like BJ’s Wholesale (BJ) and Big Lots (BIG) in addition to several Health Care names. Large-cap Tech also makes the list with names like NVIDIA (NVDA) and Shopify (SHOP). Meanwhile, there have been fewer and fewer stocks making new 52 week lows. In fact, there were only six new 52 week lows on Friday.

Not only are more stocks reaching new highs than lows but there have also been more golden crosses (when a rising 50-DMA moves above a rising 200-DMA) than death crosses (a falling 50-DMA moves below a declining 200-DMA). As of Friday’s close the only death cross across all stocks and ETFs tracked in our tools was for the inverse ETF the UltraPro Short Dow 30 (SDOW). On the other hand, there were 24 golden crosses including equities like Spotify (SPOT) and the S&P Biotech ETF (XBI). In other words, more stocks are not only reaching new highs than lows, but more stocks and ETFs are also seeing their moving averages rising than falling. Start a two-week free trial to Bespoke Institutional to access our interactive Trend Analyzer and screens.

Bespoke’s Morning Lineup – 5/26/20 – And They’re Off
See what’s driving market performance around the world in today’s Morning Lineup. Bespoke’s Morning Lineup is the best way to start your trading day. Read it now by starting a two-week free trial to Bespoke Premium. CLICK HERE to learn more and start your free trial.
You couldn’t ask for a better way to start the unofficial Summer trading season. The S&P 500 is poised to trade back above its 200-day moving average for the first time in weeks. That may sound like an optimistic trend, but as we noted in the text of today’s report, we were surprised to find that it isn’t always the most positive short-term (week and month) trend for equities.
Be sure to check out today’s Morning Lineup for a rundown of the latest stock-specific news of note, news in global markets, global and national trends related to the COVID-19 outbreak, and much more.
The S&P 500 tracking ETF (SPY) is on pace to gap up over 1.8% this morning. In the history dating back to 1993, this will be SPY’s 279th 1%+ upside gap and the 62nd occurrence on a Tuesday. The table below shows the performance of the ETF, broken out by weekday, from the open to close on days when it opens up by at least 1%. Tuesday upside gaps of 1%+ have been followed by an average open to close gain of 0.34% with positive returns just under 59% of the time. In terms of the average change, this ranks as the second-best weekday behind Wednesday (0.43%), and in terms of consistency it ranks as the third-best behind Wednesday and Friday.

Today’s upside gap is also notable in that it is just the 11th 1%+ upside gap following a three-day weekend. It may sound pretty hard to believe, but the last time SPY gapped up more than 1% after a three-day weekend was more than four years ago in February 2016.
In the 10 prior instances where SPY gapped up more than 1% after a three-day weekend, it averaged a rest of day gain of 0.31% (median: 0.16%) with positive returns half of the time. So, basically it was a coinflip.

Bespoke Brunch Reads: 5/24/20
Welcome to Bespoke Brunch Reads — a linkfest of the favorite things we read over the past week. The links are mostly market related, but there are some other interesting subjects covered as well. We hope you enjoy the food for thought as a supplement to the research we provide you during the week.
While you’re here, join Bespoke Premium for 3 months for just $95 with our 2020 Annual Outlook special offer.
Second Order Effects
Fewer Traffic Collisions During Shutdown Means Longer Waits For Organ Donations by April Dembosky (Kaiser Health News)
With far fewer cars on the road, there have been fewer fatal accidents, and as a result there haven’t been as many organs available for transplant. [Link]
U.S. Adults Report Less Worry, More Happiness by Megan Brenan (Gallup)
While many parents report brutal experiences trying to balance careers and children at home from school, since late March/early April there’s been a substantial improvement in levels of happiness, with less worry and boredom as well. [Link]
Markets
The Day Coronavirus Nearly Broke the Financial Markets by Justin Baer (WSJ)
March 16th saw stocks fall at a record pace, huge scrambles for liquidity, and totally broken markets across asset classes that are typically regarded as very safe. [Link; paywall]
Frustrated sports punters turn to US stock market by Richard Henderson (FT)
With no soccer, no baseball, no basketball, and cancelled Olympics, the sports gambling behemoth slowly laid eyes on stocks as an outlet for those regularly risking cash on uncertain outcomes. [Link; paywall]
Options Market Signals a Dire Picture for Stocks by Ash Alankar and Myron Scholes (Bloomberg)
Despite a huge bounce since the March lows, equity options are pricing a relatively dire downside scenario that is more akin to what was priced at the lows than during a typical equity rally. [Link; soft paywall]
Pandemic Flight
First They Fled the City. Now They’re Building $75,000 In-Ground Pools by Gina Bellafante (NYT)
While debates rage over the safety of beaches – let alone public pool facilities – the wealthy are busily bolstering their environments with private swimming facilities. [Link; soft paywall]
Returning New Zealanders push population to record 5m by Jamie Smyth (FT)
Monthly net migration figures show a record 42,800 net additions to the small island nation, driven by citizens flocking back to the oasis of low case counts and remote living in the furthest southern reaches of the Pacific. [Link; paywall]
Economics
An Unemployment Crisis after the Onset of COVID-19 by Nicolas Petrosky-Nadeau and Robert G. Valletta (FRBSF)
Labor markets have taken a massive hit from the COVID crisis, but how fast will they bounce back? This analysis presents a disheartening range of outcomes that tilt firmly against rapid returns to very low unemployment that persisted pre-recession. [Link]
The Irish Shock to U.S. Manufacturing? by Brad Setser (Council on Foreign Relations)
US tax policy is incentivizing a huge shift away from domestic production and towards imports in an industry that doesn’t typically get discussed as a source of the US trade deficit. [Link]
Sports
How MLB’s Old Schedule Makers Would Set Up the 2020 Season by Emma Baccellieri (SI)
A profile of the couple that hand-wrote every MLB schedule from 1982 to 2004, balancing all of the intricate tradeoffs around fairness, weather, TV scheduling, and the myriad other concerns that afflict the 2,430 matchups in a 162 game calendar. [Link]
Minor League Baseball Is in Crisis by Robert Sanchez (SI)
Baseball teams are facing the same challenges as every other business and doing so without the stores of cash that Major League owners can call on. [Link]
Michael Jordan: A history of flight by Wright Thompson (ESPN)
Tracing MJ’s roots in Wilmington, filled with tobacco fields, and the man who The Last Dance only partially captures. [Link; soft paywall, auto-playing video]
Opportunities
Is a Pandemic the Right Time to Start a Business? It Just Might Be by Amy Haimerl (NYT)
While new business formation has slowed substantially, there are many new entrants finding a niche amidst the collapse in activity across the country; as society changes in response to the virus, new forms of opportunity are opening up. [Link]
A pizzeria owner made money buying his own $24 pizzas from DoorDash for $16 by Bijan Stephen (The Verge)
In an effort to win business, DoorDash is pricing some menu items below cost and effectively creating a massive arbitrage opportunity that is possible to bilk for real money. [Link]
Five robots that hope to save the US food supply chain by Patrick McGee (FT)
Cleaning floors, delivering packages, weeding fields, and more: these machines are helping to keep food flowing around the economy amidst the COVID-19 crisis. [Link; paywall]
Retail Reality
Shopping Malls Are Reopening, but Visits Are Still Way Down. Here Are the Numbers. by Evie Liu (Barron’s)
While many malls around the country are starting to reopen thanks to eased stay at home or business closure orders, recent location tracking data suggests that consumers are not exactly beating down the doors to buy. [Link; paywall]
It’s a dogfight at America’s pet stores as COVID-19 upends the $96 billion industry by Phil Wahba (Fortune)
While shelters have been cleared out as Americans respond to COVID loneliness with adoption, pet supply stores are facing monumental challenges after decades of secular growth. [Link]
It Took a Pandemic, but 7-Eleven in Japan Is Letting Stores Take a Break by Hisako Ueno and Ben Dooley (NYT)
Historically 7-11 operators in Japan had to adhere to a brutally strict set of dictates about open hours, but the COVID pandemic is changing much about the country’s approach to retail. [Link; soft paywall]
Home Depot, Lowe’s Primed for Historic Growth During Coronavirus by Matthew Townsend (Bloomberg)
Americans stuck at home under stay at home orders spent a huge amount of time and money upgrading their living space if Q1 results from the home improvement retailers are any indication. [Link; soft paywall]
Fail
Students are failing AP tests because the College Board can’t handle iPhone photos by Monica Chin (The Verge)
AP exam takers were foiled by image formats on their iPhones, because the website portal was not set up to handle the image format used by Apple and more recently Samsung phones. [Link]
Head Of NASA’s Human Spaceflight Program Resigns A Week Before Crucial Launch by Nell Greenfieldboyce (NPR)
The NASA administrator charged with overseeing human space travel has resigned ahead of a May 27th launch of American astronauts that will be the first since 2011. [Link]
Win
America’s most illegal record has been obliterated by Cameron Kirby (Which Car)
The legendary speed run from New York City to Los Angeles has seen no less than seven new records in just over a month as empty roads tempt illicit drivers to take the journey at lunatic speeds. [Link]
Epidemiology
Why do some COVID-19 patients infect many others, whereas most don’t spread the virus at all? by Kay Kupferschmidt (Science)
While average transmission rates are useful for understanding the scale of outbreaks, in reality most COVID patients don’t infect many other people; instead, a few “superspreaders” drive big outbreaks, and understanding when and why that happens is a key to making the world safe until a vaccine can be found. [Link]
Terrorism
FBI finds al Qaeda link after breaking encryption on Pensacola attacker’s iPhone by David Shortell and Evan Perez (CNN)
For the first time since 9/11, a terrorist attack with fatalities directed by foreigners has taken place on American soil, as the FBI discovered links between a Saudi military trainee and al Qaeda in the Arabian Peninsula. [Link]
History
Do civilisations collapse? by Guy D Middleton (Aeon)
A critical treatment of the narrative that many civilizations fall apart due to their own hubris, or a catastrophic reliance on a shifting environment. In reality, easy narrativization is a mistake that obscures more complicated reality. [Link]
Read Bespoke’s most actionable market research by joining Bespoke Premium today! Get started here.
Have a great weekend!