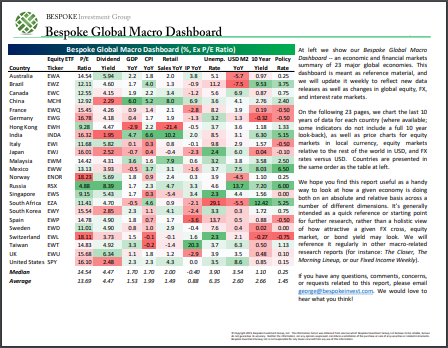
Bespoke’s Global Macro Dashboard — 4/1/20
Bespoke’s Global Macro Dashboard is a high-level summary of 22 major economies from around the world. For each country, we provide charts of local equity market prices, relative performance versus global equities, price to earnings ratios, dividend yields, economic growth, unemployment, retail sales and industrial production growth, inflation, money supply, spot FX performance versus the dollar, policy rate, and ten year local government bond yield interest rates. The report is intended as a tool for both reference and idea generation. It’s clients’ first stop for basic background info on how a given economy is performing, and what issues are driving the narrative for that economy. The dashboard helps you get up to speed on and keep track of the basics for the most important economies around the world, informing starting points for further research and risk management. It’s published weekly every Wednesday at the Bespoke Institutional membership level.
You can access our Global Macro Dashboard by starting a 14-day free trial to Bespoke Institutional now!
The Closer – The End of the Beginning or the Beginning of the End? – 3/31/20
Log-in here if you’re a member with access to the Closer.
Looking for deeper insight on markets? In tonight’s Closer sent to Bespoke Institutional clients, we recap the S&P 500’s worst and most volatile quarter on record before reviewing today’s consumer confidence numbers from the Conference Board. We then take a look at equities’ inability to move above their 50-DMAs. Next, we look at quarterly BEA data on the net international investment position of the US and the latest in the Fed’s liquidity provisions. Looking to tomorrow, we close out tonight’s note with the typical intraday pattern of the first day of the new quarter.

See today’s post-market Closer and everything else Bespoke publishes by starting a 14-day free trial to Bespoke Institutional today!
Bespoke Market Calendar — April 2020
Please click the image below to view our April 2020 market calendar. This calendar includes the S&P 500’s average percentage change and average intraday chart pattern for each trading day during the upcoming month. It also includes market holidays and options expiration dates plus the dates of key economic indicator releases. Start a two-week free trial to one of Bespoke’s three research levels.

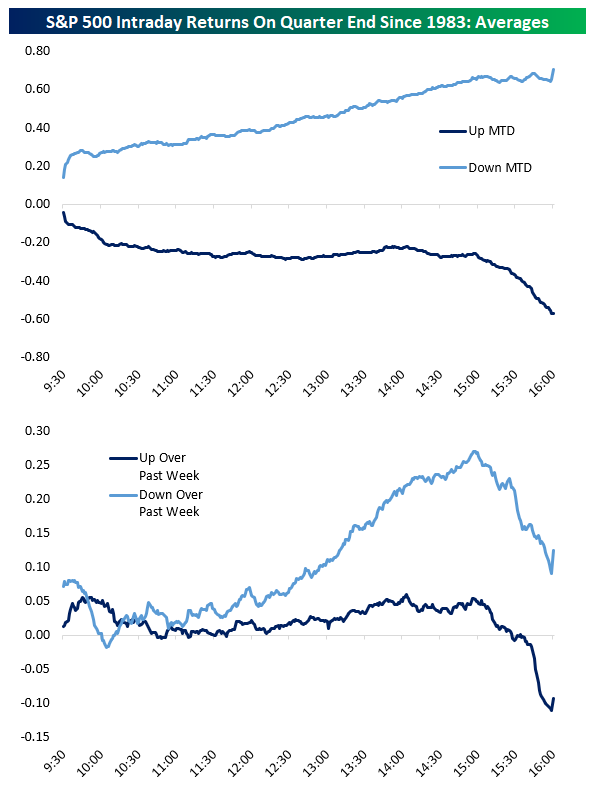
Quarter-End Market Performance: Intraday Rallies But A Brutal Last Hour
Since 1983, intraday performance on quarter end has had a dramatic set of swings: from a boring morning to a dramatic afternoon rally and brutal selloff into the close. In the chart below, we show the average and median performance of the S&P 500 (as a percentage change versus the prior day’s close) for all quarter ends since 1983. The market tends towards little change in the morning before running all the way to session highs at 3:00 PM across the course of the afternoon. That tends to preclude an unwind into the close, though, with stocks dropping all the way to flat to down just before the close. The key takeaway for today? Don’t get lulled into complacency by a boring morning or solid start to the afternoon. Start a two-week free trial to Bespoke Institutional to access our interactive economic indicators monitor and much more.

Conditions headed in to the last day of trading tend to be very important as well. Since 1983, months with stocks down on a month-to-date basis heading in to the final day have seen steady rallies and a close at the highs. The opposite is true for periods when stocks have been up month-to-date on the last trading day. In both cases, quarter-end rebalancing is likely playing a large role. On the other hand, shorter-term rallies like the move seen this week have less of an impact, generally.
The Few, The Proud, The Overbought Stocks
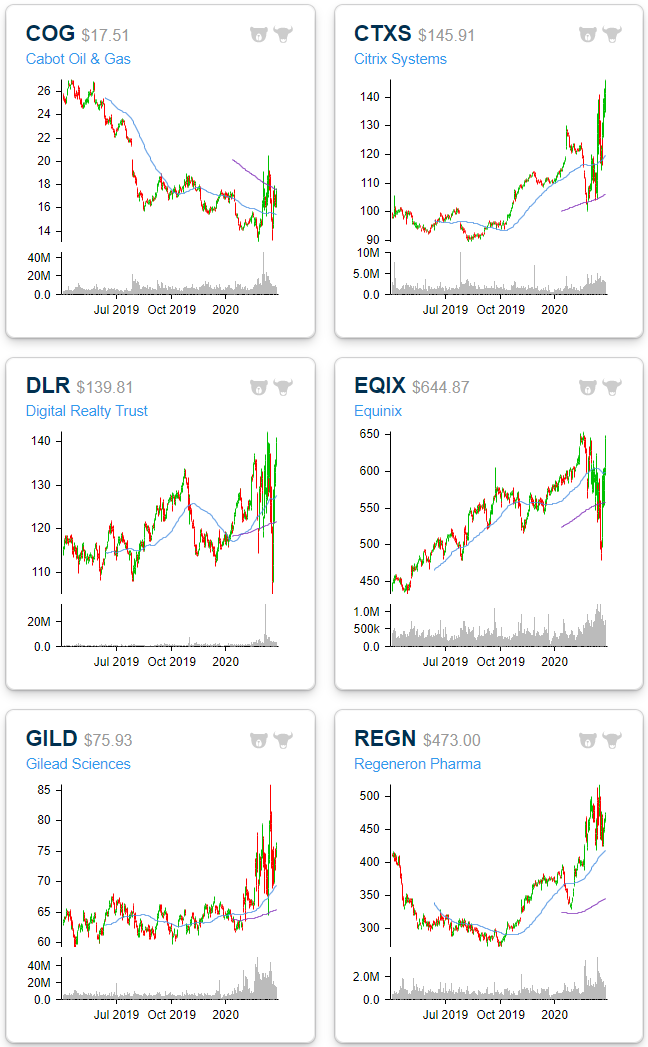
As we have been highlighting in our Sector Snapshot over the past few weeks, finding a stock that is overbought in the current environment has been like searching for a needle in a haystack. There were a few days earlier this month that not a single stock in the S&P 500 was overbought, and even today after a sizable rally in the past week just 1.2% of stocks in the index – 6 stocks- are overbought. In the snapshot from our Trend Analyzer below we show these stocks. While there are some new arrivals to the overbought club, Gilead Sciences (GILD) and Regeneron (REGN), two companies seeking a medical solution to the COVID-19 virus, have been the few names teetering in and out of overbought territory for the past month now. While those two have been overbought on an off and on basis, they are not the most overbought. Citrix Systems (CTXS) holds that title after finishing the day yesterday nearly 3 standard deviations above its 50-DMA. No other stock is nearly as overbought with Digital Realty Trust (DLR) the next most overbought at 2 standard deviations above its 50-DMA. For DLR, along with peer Equinix (EQIX) and Energy stocks Cabot Oil and Gas (COG) the picture today is very different than one week ago when each one was oversold.
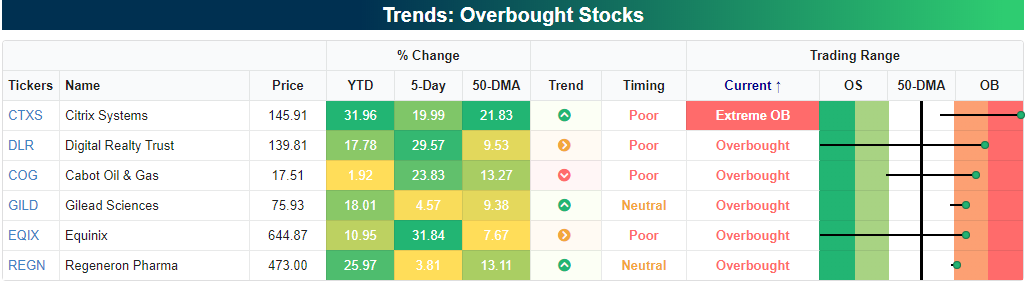

Below, we show the chart of these same six stocks. Like the broader market, each one has been very volatile recently but over the past year have generally remained in uptrends with the exception of COG which, like the rest of the sector, has been in a prolonged downtrend. Start a two-week free trial to Bespoke Institutional to access our Trend Analyzer, Chart Scanner, and more.

Some Charts Hanging In There
Given the route of equities across sectors over the past month and a half as well as the subsequent rally in the past week, most charts out there look very messy. Most have fallen off of a cliff, breaking any notable support levels in the process but others have held up relatively well during the COVID-19 collapse or have at least finally found support like Seagate Tech (STX).
The nature of the businesses of names like Clorox (CLX), Campbell Soup (CPB), Hormel Foods (HRL), and Kroger (KR) never led them to see the same type of massive declines of many other cyclical stocks. Instead they continued to roughly trade within their uptrends and even surge to fresh highs in the beginning of March. After the rotation into the more beaten down names in the past week, these stocks are no longer as extended as they were but they now sit closer to the bottom of their uptrends. For example, earlier this month CPB broke out of the range it had been in for most of 2019 before it sold off back below that range. The past few days’ rally has brought it back into this range. The same can be said for other names like Microsoft (MSFT), Netflix (NFLX), or NVIDIA (NVDA). These stocks had broken their uptrends but the moves had not been sustained to the downside as the past week’s rally has kept those uptrends somewhat in tact. Start a two-week free trial to Bespoke Institutional to access our custom portfolios, Chart Scanner, Trend Analyzer, and much much more.

Daily Economic Data Shows Scale Of COVID-19’s Impact
Since COVID-19 activity shut-downs started to roll across the country back in early March, a number of industries have taken massive hits. Restaurants and travel have been especially hard-hit, but the scale of declines is so large it can be hard to grasp in the abstract. Below we show how activity indicators for key sectors of the economy are down 60% or more on a YoY basis, a shock that’s completely unprecedented in a modern services economy. Granted, these declines are in large part by design, and some of them can bounce back significantly. On the other, these drops indicate revenue not available to meet costs that include payroll, rent, and interest. A 93% decline in travel volumes, 100% decline in seated restaurant meals, 55% decline in overall restaurant revenue, and 67% decline in a subset of small business hours worked are all statistics that capture just how badly broad swathes of economic activity are being hit. Start a two-week free trial to Bespoke Institutional to access our interactive economic indicators monitor and much more.

Bespoke’s Morning Lineup – 3/31/20 – Bad Headlines Spook Market
See what’s driving market performance around the world in today’s Morning Lineup. Bespoke’s Morning Lineup is the best way to start your trading day. Read it now by starting a two-week free trial to Bespoke Premium. CLICK HERE to learn more and start your free trial.
Futures were higher earlier but have been losing ground relatively quickly as a number of negative headlines have crossed the tape. First, Spain reported its highest number of casualties since the crisis began. Closer to home, it has been a harrowing day in the New York City area as the city saw its number of fatalities increase 16% in the span of just six hours! That’s right, as of 10:30 AM on Monday, the death toll in NYC stood at 790, but by 4:30 PM the total number of fatalities has increased for 914.
On the economic front, Goldman Sachs has revised its forecast for Q2 GDP down to 34%! We have long stated that the market would bottom when it could look through headlines that were only going to get worse, and headlines like the ones we have seen this morning and will likely see in the coming days/weeks will provide a test the resolve of the market’s recent rally.
Read today’s Bespoke Morning Lineup for a discussion of the latest trends and statistics of the outbreak, overnight moves in the market, and a great state by state summary of the latest Covid-19 trends in the United States.

We almost got there yesterday, but couldn’t quite make it. What we’re referring to is the S&P 500 moving out of oversold territory. After several days of off the chart oversold readings, the S&P 500 almost moved into neutral territory after yesterday’s rally. With futures drifting lower into the open, though, that move into neutral territory may not come today. For the sake of reference, the S&P 500 has been trading at oversold levels since 2/25/20 or 25 straight trading days.

The Closer – Small Caps in the Cold – 3/30/20
Log-in here if you’re a member with access to the Closer.
Looking for deeper insight on markets? In tonight’s Closer sent to Bespoke Institutional clients, we begin with a look at small caps which are once again lagging. We then review positioning around Eurodollar futures before show our complete Five Fed Manufacturing Composite for March. Delving deeper into regional Fed data, we show the results of the various supplemental questions related to COVID-19 that the Dallas Fed asked in this month’s survey.

See today’s post-market Closer and everything else Bespoke publishes by starting a 14-day free trial to Bespoke Institutional today!
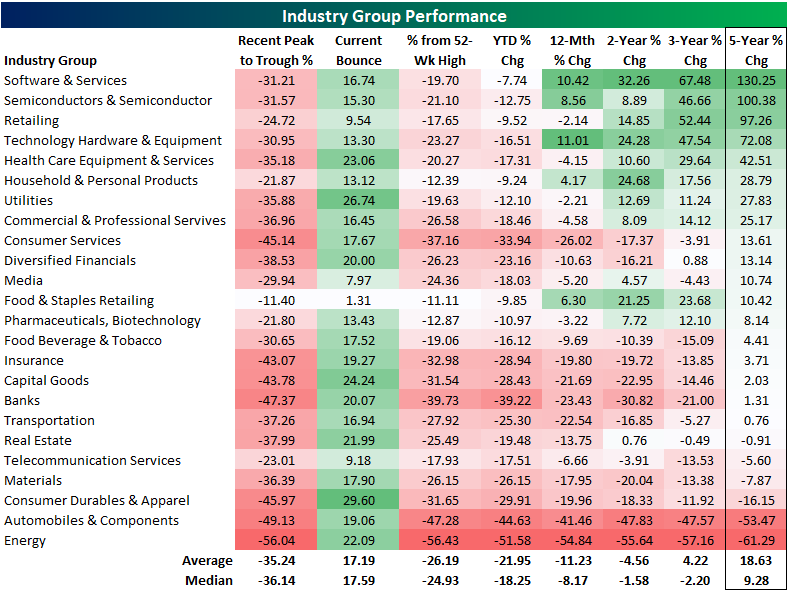
S&P 500 Industry Group Performance Numbers After COVID Crash
Looking at the S&P 500’s industry groups, every one is now up over the last week since last Monday’s low. The only standout is the Food & Staples Retailing group which is only up 1.3%. But as we frequently highlighted last week, that is a result of it being the group that also held up the best during the time between the 2/19 peak through last Monday’s low. In fact, that industry is currently the one that is closest to its 52 week high at 11%. The Consumer Durables and Apparel group, on the other hand, has performed the best over the past week rising nearly 30%. That comes as it was one of the most beaten down sectors, nearly being cut in half during the initial COVID crash. Even with the recent rally, that still leaves it another 31.65% below its 52-week high.
The size of the declines over the past month and a half have erased a lot of the past few years of progress. There are currently only five industry groups higher than they were one year ago. Only half are up over the past two and three years. Fortunately, over a longer time horizon—the past five years—the majority of industries are still higher with some industries like Software and Services, Semiconductors, and Retailing still up around 100% or more. Autos and Energy, however, are both down more than 50% over the last five years. Start a two-week free trial to Bespoke Premium to see our list of “Stocks for the COVID Economy.”