Homebuilder Sentiment Surges
Homebuilder sentiment came in significantly better than expected in October rising from 68 up to 71 compared to expectations for the index to remain unchanged at 68. With October’s gain, overall sentiment is currently at its best level since February 2018. Also notable is the fact that over the last ten months, the NAHB Homebuilder Sentiment index is up 15 points. That’s the strongest ten-month rate of change in more than six years. With homebuilder sentiment so strong, it’s hard to imagine that the economy is on the cusp of a downturn.

Looking at the internals of the report, strength was broad-based at a national level as Present and Future Sales as well as Traffic all saw impressive gains. On a regional level, though, it was a bit of a mixed picture. While sentiment in the South and West increased, sentiment in the Northeast and Midwest declined. In the case of the South, though, sentiment hit its highest level since June 2005 (chart below)! Start a two-week free trial to Bespoke Premium to sample our actionable research. If you use this checkout link, you’ll receive a 10% discount on an annual membership if you stick with it past your trial period.


Bespoke’s Global Macro Dashboard — 10/16/19
Bespoke’s Global Macro Dashboard is a high-level summary of 22 major economies from around the world. For each country, we provide charts of local equity market prices, relative performance versus global equities, price to earnings ratios, dividend yields, economic growth, unemployment, retail sales and industrial production growth, inflation, money supply, spot FX performance versus the dollar, policy rate, and ten year local government bond yield interest rates. The report is intended as a tool for both reference and idea generation. It’s clients’ first stop for basic background info on how a given economy is performing, and what issues are driving the narrative for that economy. The dashboard helps you get up to speed on and keep track of the basics for the most important economies around the world, informing starting points for further research and risk management. It’s published weekly every Wednesday at the Bespoke Institutional membership level.
You can access our Global Macro Dashboard by starting a 14-day free trial to Bespoke Institutional now!

Bespoke Morning Lineup – 10/16/19
See what’s driving market performance around the world in today’s Morning Lineup. Bespoke’s Morning Lineup is the best way to start your trading day. Read it now by starting a two-week free trial to Bespoke Premium. CLICK HERE to learn more and start your free trial.

The Closer – Earnings, Curve, Banks, Inflation Expectations – 10/15/19
Log-in here if you’re a member with access to the Closer.
Looking for deeper insight on markets? In tonight’s Closer sent to Bespoke Institutional clients, we evaluate the potential of a bounce in small caps as well as what the solid results from JPM, C, UNH, and JNJ could mean for the rest of earnings season. Later on we show the breakout for banks and forward performance of the S&P 500 following similarly strong starts to earnings season. We also look at the move in Treasuries including the 3m10y curve closing in positive territory. We finish with a review of the New York Fed’s data on inflation expectations.

See today’s post-market Closer and everything else Bespoke publishes by starting a 14-day free trial to Bespoke Institutional today!
Semis – New All-Time Highs…Barely
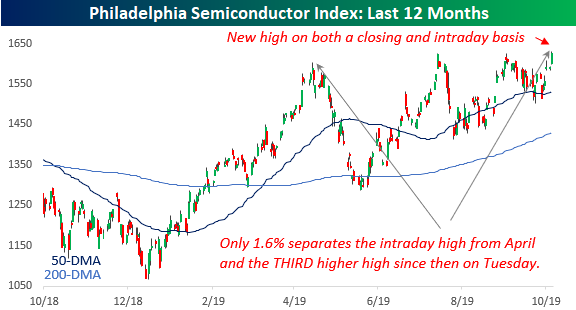
Semiconductors outperformed the overall market on Tuesday (10/15), with the Philadelphia Semiconductor index (SOX) rallying 2.22%. The chart below shows the performance of the SOX over the last year, and while you have to squint, Tuesday’s move saw new all-time highs on both a closing and intraday basis. What’s really amazing about this chart is that while the current high represents the third higher high for the SOX since its peak earlier this year in April, the percentage spread between the April high and Tuesday’s high is just 1.6%. Or to put it another way, July’s high was 1.28% above the April high, September’s high was 0.003% above July’s high, and the current high is just 0.3% above the September high. It doesn’t get much more narrow than that!
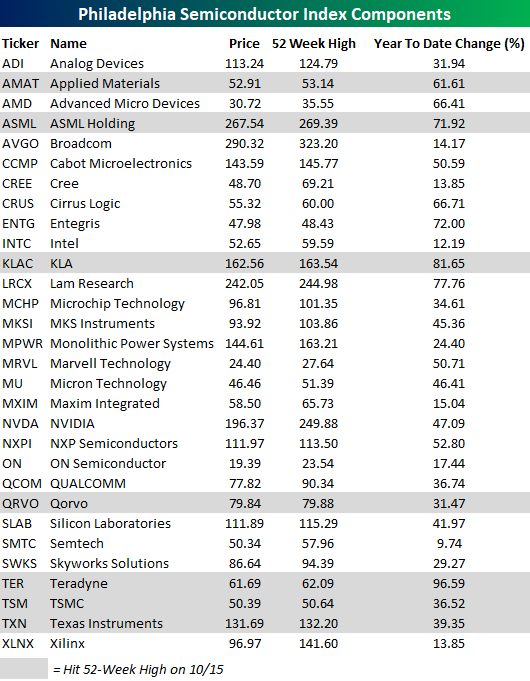
While the SOX hit a new high Tuesday, only a handful of names in the index managed to do so as well. The chart below shows how far each stock in the index finished the day from its 52-week high. Of the 30 stocks in the index, just seven (less than a quarter) hit new highs. Besides the seven new highs (shaded in the chart below), there are only six other stocks in the SOX that are within 5% of a 52-week high, so more than half of the index’s components are more than 5% below 52-week highs. Stocks that are the furthest below their respective highs are Xilinx (XLNX), Cree (CREE), and NVIDIA (NVDA). All three of these names are still down more than 20% from their respective highs, while other big names in the index like QUALCOMM (QCOM), Advanced Micro (AMD), Intel (INTC), and Broadcom (AVGO) are still down over 10% from 52-week highs. So there’s still room for upside in the index if these big names can play more catch up.

The table below lists each of the 30 stocks comprising the SOX along with their YTD change through 10/15. So far this year, the average YTD performance of the stocks in the SOX is a gain of 43%! The top-performing stocks in the index so far have been Teradyne (TER), which has nearly doubled, KLA-Tencor (KLAC), and Lam Research (LRCX). All three are up over 75% YTD. On the downside, there aren’t any, but Semtech (SMTC) is the only stock in the index that’s up less than 10%. Start a two-week free trial to Bespoke Premium to sample our actionable research. If you use this checkout link, you’ll receive a 10% discount on an annual membership if you stick with it past your trial period.
Dividend Stock Spotlight: Johnson & Johnson (JNJ) and UnitedHealth (UNH)
Earnings season kicked off this morning with a number of big banks’ third-quarter results such as JPMorgan (JPM) and Goldman Sachs (GS). Two other Dow components, both Health Care stocks, also had notable reports: Johnson and Johnson (JNJ) and UnitedHealth (UNH). These two were the first triple plays of this earnings season. A triple play is when EPS and revenues are above analyst estimates while the company also raises forward guidance.
Despite some recent legal headwinds, Johnson and Johnson (JNJ) showed a strong quarter with EPS coming in 11 cents above estimates along with revenues that also topped estimates. JNJ also raised guidance making it the first triple play for the stock in two years (the last being in October of 2017) and only the ninth since 2000 (as highlighted in the table from our Earnings Explorer snapshot below). In terms of the stock price reaction, normally JNJ has generally not been very volatile with an average full-day gain of just 17 bps in reaction to earnings across all quarters. In quarters when the company has reported a triple play, though, the stock has performed even better with an average full-day gain of 1.2%. Today, JNJ is on pace to do even better having already gained 2.2%.

From a technical standpoint, the stock remains stuck in its recent range even after today’s rally. At current levels, though, JNJ yields 2.85% which is more than the S&P 500’s 1.9% yield and the average for other Health Care stocks (1.68%). Furthermore, of all 61 S&P 500 Health Care stocks, JNJ has the seventh-highest yield. Johnson & Johnson is also a dividend aristocrat with a long history of paying and growing its dividend, something it has no done for 58 consecutive years. Given the payout ratio is still relatively low at 44.9%, the company should be able to keep that streak going even if earnings growth stalled out.

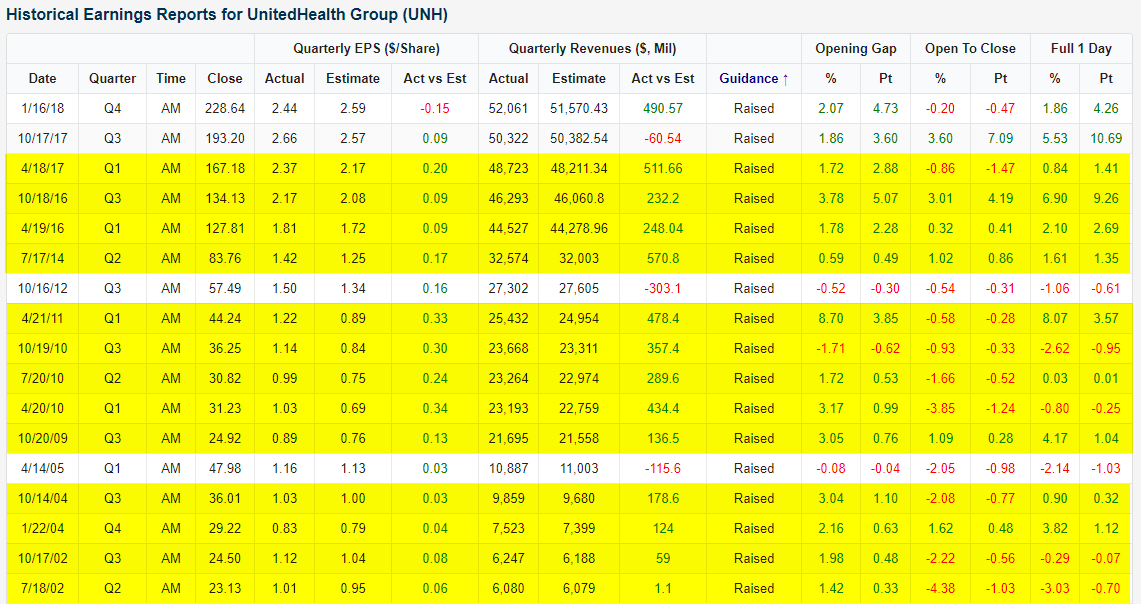
UnitedHealth’s (UNH) price action has been a bit more exciting than JNJ as it has ripped higher in today’s session. The stock is up over 7.5% after exceeding EPS estimates by 12 cents, topping revenues by over $500 million, and raising guidance. This is the company’s fourth-best reaction to any quarter’s earnings since 2001 and is the 14th triple play in that time. The only one of these past triple plays that saw a stronger stock price reaction to earnings was the first quarter of 2011 when UNH finished the day 8.07% higher.
While JNJ is still within its uptrend, this strong response for UNH has actually broken the past few months’ downtrend line. UNH is now back to where it was in mid-August. From a dividend perspective, UNH is not as attractive as JNJ as it only yields 1.83%, slightly below that of the S&P 500. The company also does not have as long of a track record (only 9 consecutive years) of increasing its dividend. Granted, UNH does have a slightly lower valuation with a P/E of 14.6 compared to JNJ’s 14.8. Both of these are also below the 19x average for all S&P 500 Health Care stocks. Start a two-week free trial to Bespoke Premium to sample our actionable research. If you use this checkout link, you’ll receive a 10% discount on an annual membership if you stick with it past your trial period.
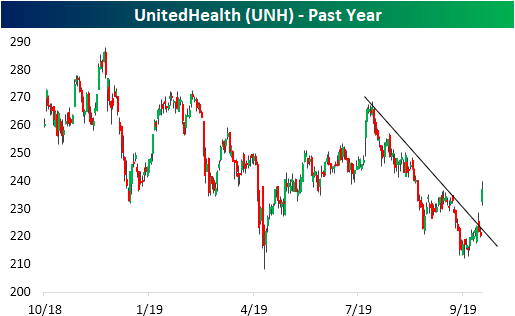
Chart of the Day: Volume. Where is It?
Today’s Chart of the Day is now available for members.
As stocks have rallied off their recent lows from October, we’ve heard a number of comments from investors regarding the lack of volume accompanying the move. These critics aren’t wrong. In the four trading days since the 10/8 closing low, volume in SPY has come in below its 50-day moving average by an average of 18%, and there has only been one day of those four where volume was actually above average. The day isn’t over yet, but volume so far is tracking below average again even as the S&P 500 is up over 1%.
Does low volume matter, and if so how much should we be worried? In today’s Chart of the Day, we look to shed some light on that question. To read this report and access everything else Bespoke’s research platform has to offer, start a two-week free trial to Bespoke Premium. You won’t be disappointed!

Bespoke CNBC Appearance (10/14)
Bespoke co-founder Paul Hickey appeared on CNBC’s Closing Bell yesterday (10/14) to discuss the upcoming earnings season. To view the segment click on the image below. Stay on top of everything earnings-related this earnings season, and start a two-week free trial to Bespoke Premium to sample our actionable research. If you use this checkout link, you’ll receive a 10% discount on an annual membership if you stick with it past your trial period.

Energy Sector Depleted
With the bond market closed for the Columbus Day holiday, it was a very quiet day in the equity market yesterday. As we noted in last night’s Closer report, it was the lowest volume full day of trading since December 2017. With the lack of any big moves, the lists of new highs and new lows were very small as well. In the S&P 1500, which includes large-cap (S&P 500), mid-cap (S&P 400), and small-cap (S&P 600) stocks, there were just eight 52-week highs and 18 new lows. One standout sector on the list of new lows, though, was Energy. As shown in the table below, eleven of the eighteen stocks on the list of new lows were from the Energy sector. Also, it’s not as though Energy is a big sector within the index as it accounts for less than 6% of the index’s constituents.

The fact that so many stocks from the Energy sector make up the list of new lows shouldn’t come as too much of a surprise after looking at a chart of the sector over the last year. While the S&P 500 is within 2% of new highs, Energy is within 10% of a 52-week low. While the Energy sector remains mired in a long-term downtrend, it is interesting to note that it is showing some early signs of a double-bottom following its recent sell-off. With the sector so close to 52-week lows and sentiment being so negative, any positive news would provide a big boost. An example of that negative sentiment is the latest release of the BofA Merrill Fund Manager Survey which showed that overall asset allocation towards the Energy sector is further below its historical average than any other sector/asset class. Start a two-week free trial to Bespoke Premium to sample our most actionable investment research. If you use this checkout link, you’ll receive a 10% discount on an annual membership if you stick with it past your trial period.

Bespoke Morning Lineup – 10/15/19
See what’s driving market performance around the world in today’s Morning Lineup. Bespoke’s Morning Lineup is the best way to start your trading day. Read it now by starting a two-week free trial to Bespoke Premium. CLICK HERE to learn more and start your free trial.