
Massive Outperformance From Renewables and Banks
With the Democratic party looking to pick up two more seats in the Senate, investors are flocking to names that would benefit from the party’s agenda; namely renewable energy stocks. While valuations in the renewables space have already been stretched in the past year as we noted in last night’s Closer, today the multiple expansion has only accelerated as these names are having a banner day. The Invesco Solar ETF (TAN) as well as the Invesco WilderHill Clean Energy ETF (PBW) are up around double-digit percentages or more in today’s session and are on pace for the best day since March 24th of last year- the first day of the current bull run.
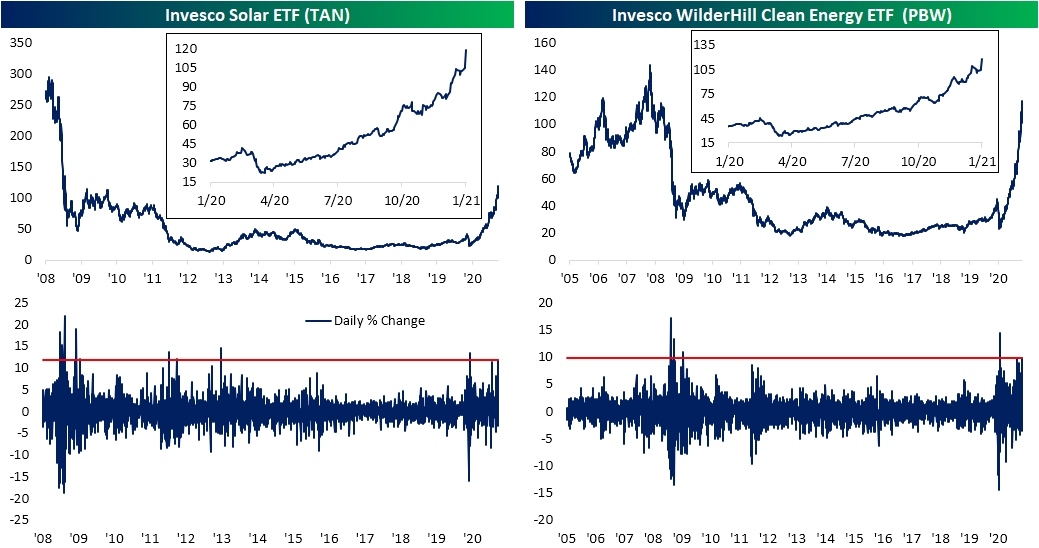
Relative to the broader market, today’s performance is even more spectacular. In the charts below, we show the ratio of TAN and PBW relative to the S&P 500. For TAN, the move higher in the ratio today surpasses any day of the past year. In fact, the 10.39% rise in the ratio today is on pace to be the largest single-day increase since April of 2013. For PBW, the increase in the ratio is second only to March 26th of 2009.

Another area of huge outperformance today is the banks. The 10-year yield has topped 1% for the first time since March. With yields providing a more welcoming environment for the industry, the S&P Regional Banking ETF (KRE) is up 8.5%. That is the best day since November 9th when the ETF popped over 15%. While nearly half of that day’s rally, KRE’s performance today still stands in the top 1% of all days since it began trading in 2006.

Again, just like the renewable energy ETFs, the strong performance of banks relative to the broader market is historic today. Prior to today, the ratio of KRE to SPY has only seen a larger daily increase five times since 2006. One of those days was the aforementioned rally in November with the other days occurring in July and September of 2008 and March of 2009. Click here to view Bespoke’s premium membership options for our best research available.

Bespoke’s Morning Lineup – 1/6/21 – Small Caps Surge; Growth Thumped
See what’s driving market performance around the world in today’s Morning Lineup. Bespoke’s Morning Lineup is the best way to start your trading day. Read it now by starting a two-week free trial to Bespoke Premium. CLICK HERE to learn more and start your free trial.
“What is now proved was once only imagined.” – William Blake
Georgians went to the polls yesterday, and in what proved to be extremely tight races, the Democratic candidates have come out on top. While the results aren’t official, both Warnock and Ossoff look to have the necessary votes to win the election to the US Senate. We’re seeing some big reactions in the market this morning as growth stocks are getting hit hard on the prospect of higher rates, while small caps surge on hopes of more spending and stimulus.
There will be all sorts of takes from both sides that the results mean this or that for the prospects of the market, and while the policies of a Washington fully controlled by the Democrats will have some good and bad impacts at the margin, as we noted in the Washington section of our 2021 Annual Outlook, the market is much bigger than the politicians in DC. The secular trends that have been in place leading up to this election are still in effect now.
Be sure to check out today’s Morning Lineup for updates on the latest market news and events, the results of the Georgia races, an update on the latest national and international COVID trends, and much more.

As noted above, we’re seeing some big moves in markets this morning as investors digest the results of the Georgia elections. As a case in point, this morning the Russell 2000 is on pace to open up over 2% while the Nasdaq 100 is indicated more than 1.5% lower. That spread, if it continues through the opening bell, will mark just the fifth time since 2000 that the performance spread between the two ETFs that track these indices was more than 3.5 percentage points at the open. The first was in September 2008, while there were three last year (one in May, one in June, and one in November).

ISM Prices and Production Packing a Punch
This morning saw the release of an impressive reading on the manufacturing sector from ISM’s Manufacturing PMI for the month of December. For the seventh month in a row, the index was consistent with growth in the manufacturing sector (readings above 50 generally indicate month over month growth). Not only did the ISM’s reading show yet another month of growth but that growth accelerated as the index rose to 60.7 – the highest level since August of 2018. Prior to that, you would need to go all the way back to January and May of 2004 to find readings as high as this past month.

Chart Source: https://www.ismworld.org/
Along with one of the highest readings in two decades for the headline index, breadth in the report was very strong. The only indices to fall were those for Exports and Imports, and even those declines were minor. Meanwhile, the indices for Production, New Orders, Order Backlogs, and Supplier Deliveries all came in the top decile of readings of their respective histories. To summarize, overall conditions continued to improve with strong demand and production on the rise to meet that demand. There are some supply issues like low inventories and longer lead times, though and that’s contributing to sharply rising prices.
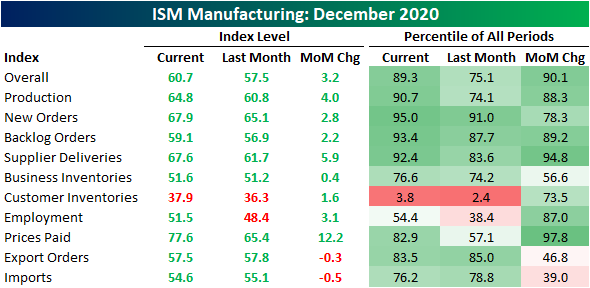
Table Source: https://www.ismworld.org/
The commentary section gives a bit more color into this. Comments frequently mention that there are supply chain issues due to recent COVID outbreaks. Such issues include logistics and supplier delays, as well as labor shortages. On the bright side, there are also several mentions that sales have not only gotten back on track but have actually passed levels from prior to COVID.

The data from the report backs up that strength in sales noted in the commentary section. The New Orders Index rose 2.8 points to 67.9. That is back up to where the index stood in October which was/is also the highest level since late 2003/early 2004. As New Orders have come in at such a strong pace, order backlogs have continued to rise. The index for Backlog Orders rose to 59.1 in December, the highest level since June of 2018.
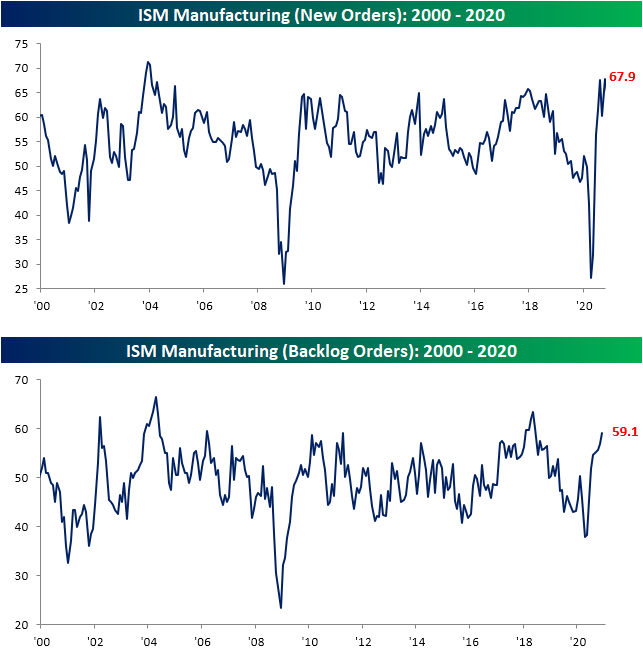
Chart Source: https://www.ismworld.org/
Counterintuitive Rise in New Highs
Although equities fell out of bed yesterday with the S&P 500 dropping nearly 1.5% on bad breadth, counterintuitively, there was a pick up in the percentage of stocks that had reached new 52 week highs on an intraday basis. With stocks initially gapping up at the open before tumbling throughout the morning and early afternoon, there were 54 S&P 500 stocks that traded at new 52-week highs intraday. Conversely, in spite of the broad declines and weak breadth, there were no stocks in the S&P 500 that made a new 52 week low. On a net basis, therefore, over 10% of the index made a new 52-week high on the first trading day of 2021. That’s the highest reading in net new 52 week highs for the S&P 500 since November 24th and the eighth-highest reading of all days since the bear market low on March 23rd of last year. On an individual sector basis, as shown in the charts from our Sector Snapshot below, Consumer Discretionary, Financials, Health Care, Materials, and Tech are all to thank. Financials perhaps had the most impressive reading. At 13.85%, there was a higher percentage of new highs from sectors like Materials (28.57%) or Technology (21.9%), but that reading for the Financials sector was the highest since February 14th of last year. For the other sectors, these were only the highest readings of only the past couple of months.

Again, Monday’s new highs were on an intraday basis meaning these stocks did not exactly close at those highs. Furthermore, with the selling throughout the session, of the 54 stocks that traded at new 52-week highs, only 10 managed to even close in the green on the session. Tapestry (TPR) had risen the most of these rising over 5%. While none of the other stocks closed with as large of a gain as TPR, at their intraday highs, Freeport-McMoRan (FCX), Albemarle (ALB), and Tesla (TSLA) were all up over 5% and in what was a broadly weaker tape, they all still managed to close in the green. Click here to view Bespoke’s premium membership options for our best research available.

Bespoke’s Morning Lineup – 1/5/21 – Georgia on Everyone’s Mind
See what’s driving market performance around the world in today’s Morning Lineup. Bespoke’s Morning Lineup is the best way to start your trading day. Read it now by starting a two-week free trial to Bespoke Premium. CLICK HERE to learn more and start your free trial.
“the most important election that has taken place since the adoption of the federal constitution.” – Pittsfield Sun, 1813
The media and politicians have literally been telling us for centuries that “this election” is the most important of our lifetimes, and they’re at it again with Georgia. Given the implications for control of the Senate, this election is important in some respects, but if you really think it’s the most important election of your lifetime, we suggest you find a hobby.
Futures have been trading on either side of the flat-line this morning and are currently on the south side of unchanged. After the opening bell, we’ll finally start to get some important economic data with the ISM Manufacturing report at 10 AM Eastern. Economists are expecting a modest decline from last month’s reading of 57.5, but still a level well above 50 (56.5).
Be sure to check out today’s Morning Lineup for updates on the latest market news and events, economic data out of Europe, an update on the latest national and international COVID trends, and much more
Whether it’s the most important election of our lifetimes or not, today’s run-off Senate elections in Georgia probably are the most important elections taking place today, and the race is extremely close. According to the website, electionbettingodds.com, Republicans are slightly favored to hold on to the Senate with 53% odds. As for the individual races, Republican Senator Perdue is slightly favored to retain his seat, while the current incumbent Republican Kelly Loeffler is a relatively sizable underdog against Democratic challenger Raphael Warnock. Given the closeness of both races, though, it entirely likely that tomorrow morning at this time we won’t know who will have control of the Senate in the upcoming session of Congress.

ASHR Arises While SPY Stumbles
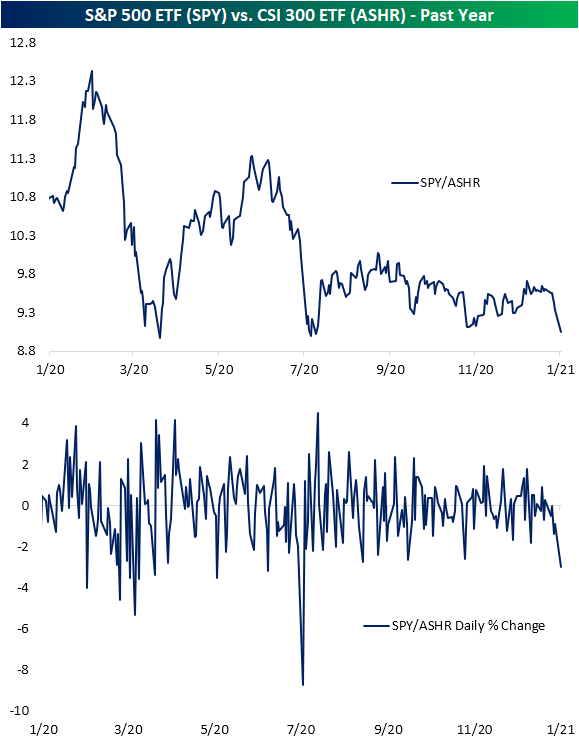
US equities are stumbling out of the gate to start 2021 as the S&P 500 (SPY) is on pace to finish the first trading day of 2021 down 1.8%. Meanwhile, Chinese equities have caught a bid. The Xtrackers CSI 300 ETF (ASHR) is up 1.5% today. Today is actually set to be the third day in a row that ASHR has risen well over 1%, the first such streak since September. That brings ASHR to its highest level since August of 2015. That compares to SPY which is looking to have one of its worst days since late October.
On a relative basis, the ratio of SPY to ASHR has now hit its lowest level since July. In the same vein, the move in this ratio today is on pace to be the largest single-day decline since July 6th when ASHR had risen double digits in just one session. During the COVID Crash last year there were also a handful of days in which the ratio had experienced similarly sharp declines. But overall, today’s drop in SPY relative to ASHR stands in the bottom 4% of all daily moves since ASHR began trading back in 2013. Chinese equities have taken an early lead against US markets to start 2021. Click here to view Bespoke’s premium membership options for our best research available.
Stocking Up the Gun Safes
While 2020 will be remembered for any number of milestones, one that stands out is the explosion in gun sales. While financial markets may hate uncertainty, gun sales thrive on it. Fueled by the pandemic, civil unrest, and Biden’s victory in the November election, Americans sought out to purchase firearms at record rates in 2020.
The chart below shows monthly FBI background checks for the purchase of firearms. After surging during the pandemic, background checks initially peaked in June at a rate of 3.93 million. As tensions around the country cooled down and the virus numbers stabilized, the pace of background checks fell sharply over the next three months, but with Biden’s election in November, the pace of background checks quickly reversed course on concerns by gun owners of more restrictive policies with a Democratic administration. In December, those concerns helped to propel the number of background checks to a record 3.94 million.

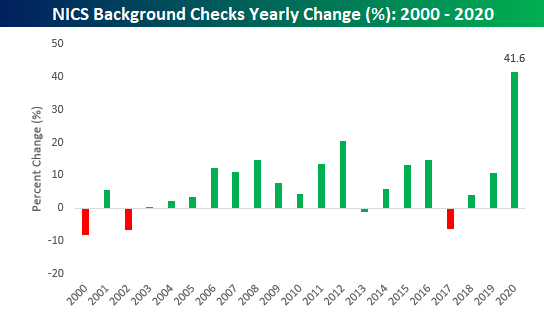
On an annual basis, gun sales have steadily trended higher over the years, but the step-up in background checks in 2020 was unlike anything we’ve seen in at least 20 years.

For the year, total background checks surged over 40%. Since 2000, that’s more than twice the percentage increase of the next closest year (20.6% in 2012)!
Despite the large increase in background checks, the stocks of the two publicly traded firearms producers haven’t followed the upward trend. In the cases of both Smith and Wesson (SWBI) and Sturm Ruger (RGR), their stocks surged during the first half of the year as uncertainty was on the rise, but this latest wave of political uncertainty hasn’t provided nearly the same boost to their stocks. Like what you see? Click here for a free trial to any of one of Bespoke’s premium membership options.


Bespoke Market Calendar — January 2021
Please click the image below to view our January 2021 market calendar. This calendar includes the S&P 500’s average percentage change and average intraday chart pattern for each trading day during the upcoming month. It also includes market holidays and options expiration dates plus the dates of key economic indicator releases. Start a two-week free trial to one of Bespoke’s three research levels.

They’re Selling Winners Early In 2020
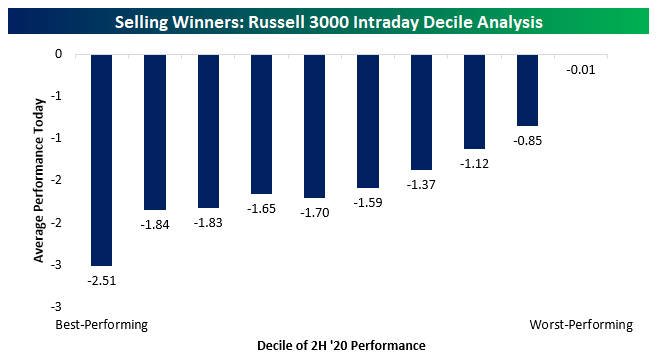
So far price action today is showing a pretty heavy New Years hangover for investors with markets dropping steadily across the first half of the first trading day of 2021. What’s interesting is how much this looks like profit-taking in the wake of a spectacular second half last year. Obviously, there was a big bounce off the lows back in March, but even stripping out that initial bounce by looking just at the second half of the year, there’s a clear pattern in today’s trading for big winners leading the way lower. In the chart below, we show the average intraday performance of stocks in the Russell 3000, grouped by their performance last year. This broad index includes both large and small-cap stocks. As shown, by far the biggest losers today are the stocks that were the biggest gainers in the second half of last year. Conversely, stocks that were at the bottom in terms of performance in the second half of last year are nearly unchanged so far today. Investors accumulated a lot of gains in the second half of 2020, and based on today’s performance, it appears as though they were waiting for the calendar to turn before locking in some of those gains. Like what you see? Click here for a free trial to any of Bespoke’s premium membership options, including our nightly Closer note that regularly features decile analysis of this kind.
Bespoke’s Morning Lineup – 1/4/21 – Picking Up Right Where 2020 Left Off
See what’s driving market performance around the world in today’s Morning Lineup. Bespoke’s Morning Lineup is the best way to start your trading day. Read it now by starting a two-week free trial to Bespoke Premium. CLICK HERE to learn more and start your free trial.
“An end is only a beginning in disguise.” – Craig D. Lounsbrough
It’s still early, but based on early indications in the market, 2021 is picking up right where 2020 left off. Futures are indicated higher, COVID numbers remain right at or near their highest levels of the pandemic, and President Trump is still dominating the headlines. Besides the year on the calendar, one of the few differences between now and 2020 is that bitcoin is trading down sharply from its highs over the weekend. Despite the 8% decline, though, it is still trading higher than where it closed out 2020.
Be sure to check out today’s Morning Lineup for updates on the latest market news and events, a recap of the latest PMI Manufacturing reports for the month of December, an update on the latest national and international COVID trends, and much more.
Heading into the first trading day of the year, the majority of sectors remain at overbought levels with just four that aren’t overbought (Utilities, Real Estate, Industrials, and Energy). Of those four sectors, two (Utilities and Industrials) now actually have “Good’ timing scores while every other sector enters 2021 at neutral levels.
