Bespoke’s Morning Lineup – 2/24/22 – The Nasdaq Bear Growls
See what’s driving market performance around the world in today’s Morning Lineup. Bespoke’s Morning Lineup is the best way to start your trading day. Read it now by starting a two-week trial to Bespoke Premium. CLICK HERE to learn more and start your trial.
“Do not try to make circumstances fit your plans. Make plans that fit the circumstances”. – George S. Patton
It’s setting up to be a painful morning for investors in the US and around the world as financial markets are reeling in every corner of the world. It’s safe to say that markets weren’t expecting such a rapid escalation and Russian airstrikes throughout Ukraine, so the negative reaction is warranted. That being said, it’s not as though markets were anywhere near their highs heading into today. The Russell 2000 was already in a bear market, the Nasdaq was knocking on the door, and the S&P 500 was in correction territory.
Economic data this morning was mixed with jobless claims coming in lower than expected, but inflation-related indices like the GDP Price Index and Core PCE both came in higher than expected. Given the macro headlines, though, futures have seen little in the way of an impact.
Read today’s Morning Lineup for a recap of all the major market news and events from around the world, including the latest US and international COVID trends.
Based on where futures stand now, the Nasdaq will open for trading with a decline of about 3%, putting the index down 21% from its record high back in November. In the history of the index dating back to 1971, this will be the 12th drawdown of 20%+ from a record high. What’s also worth highlighting is that the current drawdown represents the 3rd 20%+ drawdown from a record high in the last 3.5 years.
On a related note, today could mark the fifth straight 1%+ decline for the Nasdaq which would be the longest streak of 1% daily declines since October 2008.

Start a two-week trial to Bespoke Premium to read today’s full Morning Lineup.
Russia (RSX) Falling Off the Table
As it is the last Wednesday of the month, earlier today we published our Global Macro Dashboard offering a glance at the economic and market data of 22 major global economies. Looking across the US-listed ETFs tracking each of these country stock markets, it should come as no surprise as to which country currently finds itself at the bottom of this list, and it isn’t even close: Russia (RSX). RSX is now down 42% from its 52-week high set back in October and is down 27.59% year to date. That leaves the ETF over three standard deviations below its 50-DMA, but only one week ago, it was actually above its 50-DMA!
As for the rest of the countries tracked, half are oversold with multiple others including Germany (EWG) and China (MCHI) over two standard deviations below their 50-DMAs. The United States (SPY) actually ranks as the third-worst country of these with regards to year-to-date performance. Brazil (EWZ), South Africa (EZA), and Malaysia (EWM) are overbought and sitting on some of the largest (and only) year-to-date gains.
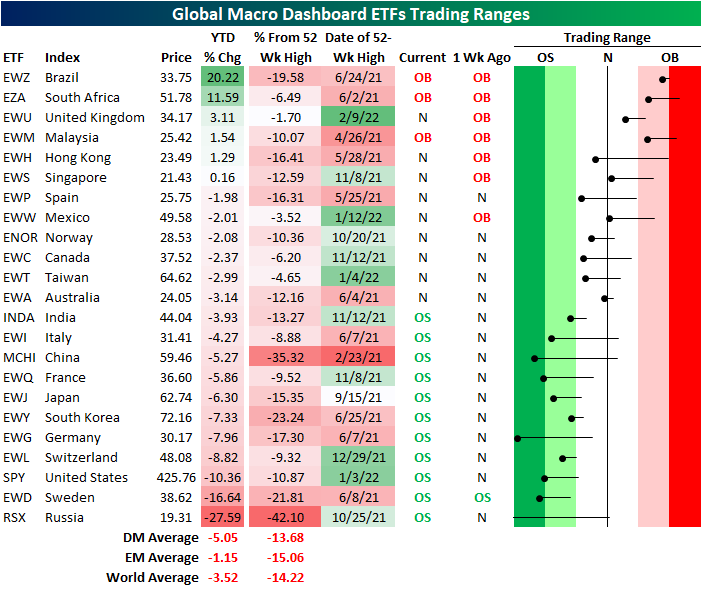
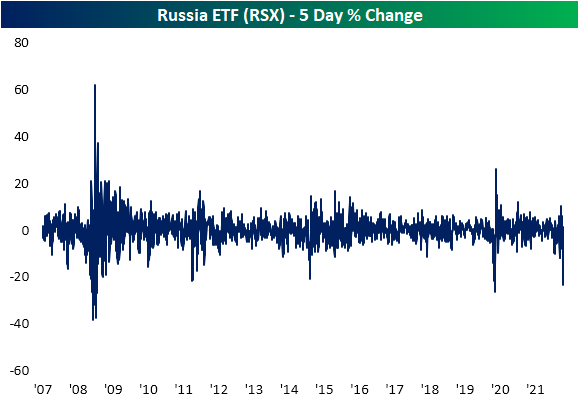
The BRIC countries find themselves on opposite ends of the spectrum of performance. While RSX and MCHI are at or close to 52-week lows, and India (INDA) is near multi-month support, Brazil (EWZ) is sitting on a sizable 20% YTD gain. That being said, it also still remains nearly 20% below its 52-week high set last spring even after the massive rally this year. Taking a look at the chart of RSX, it has been in a downtrend since last fall, and right before the Ukraine episode began, it was actually looking like it had a chance to break out as it ran up to its 50-DMA. After failing to move above that moving average coincident with rising geo-political tensions, RSX has absolutely fallen off the table over the last couple of weeks.

As for just how steep of a drop RSX has faced, the ETF has shed 23.42% in the past five sessions alone. Since the ETF began trading in the mid-2000s, there have only been a handful of other periods in which it has fallen by as large of a degree in only five days. The most recent of these was in the spring of 2020 at the onset of the pandemic. While the decline wasn’t as large as now, 2014 was another period that saw RSX fall over 20% in five days as geopolitical tensions arose in Ukraine. 2008 and 2011 were the only other periods prior to that in which RSX has experienced such a large decline in as short of a span. Click here to view Bespoke’s premium membership options.
Tech’s About Face
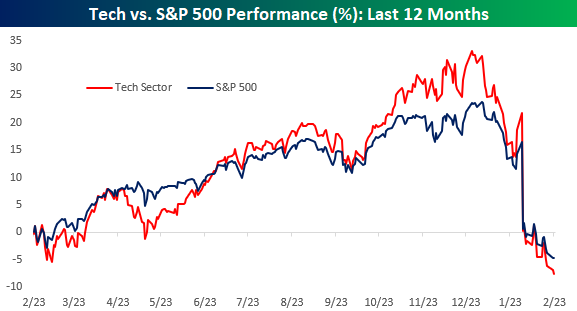
It has been quite a tumultuous four months for the Technology sector. The chart below shows the cumulative performance of the S&P 500 and the Technology sector over the last year. From late February through early October, the performance of the two were basically in line with each other, but beginning in October, tech took off while the rally in the S&P 500 was much more muted. At one point in December, the performance spread between tech and the S&P 500 from 2/23/21 widened out to just under ten percentage points. In the span of just about two months, though, that entire spread has evaporated and the S&P 500 is actually outperforming tech over the last year. Maximum bullishness in technology came late last year, but as tech has hit the skids this year, investor sentiment is starting to follow suit.
Another way to look at the recent performance disparity is to compare the 50-day performance spread between the S&P 500 Technology sector and the S&P 500. In the chart below, we show the 50-day spread going back to 2010 where negative readings indicate tech underperformance while positive readings indicate outperformance. Just today, tech’s underperformance over the last 50 trading days dropped down below 5 percentage points which is the widest degree of underperformance over a 50-trading day span since last May. Going back to 2010, though, there have only been a handful of other periods where the spread reached as negative levels as it is now.
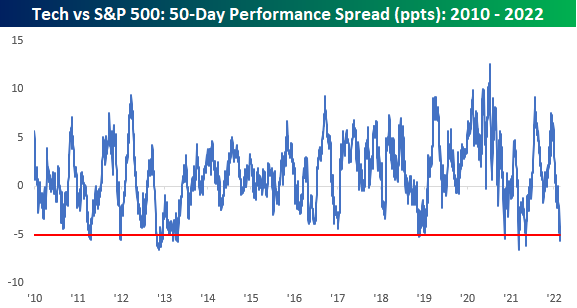
Looking at the above chart, periods like the last 50 trading days where tech underperformed by such a wide margin appear uncommon, but taking a wider angle view shows that it hasn’t always been this way. The chart below is the same one as the above but goes all the way back to 1990 rather than 2010. While the performance spread between tech and the S&P 500 has been relatively narrow to both the upside and downside in the last 15 years or so, prior to 2005, the range of out or underperformance was routinely in a wider range back then compared to the range it hasmoved between since 2005. Click here to view Bespoke’s premium membership options.

Bespoke’s Morning Lineup – 2/23/22 – Turnaround Wednesday?
See what’s driving market performance around the world in today’s Morning Lineup. Bespoke’s Morning Lineup is the best way to start your trading day. Read it now by starting a two-week trial to Bespoke Premium. CLICK HERE to learn more and start your trial.
“Shut your eyes and see.” – James Joyce
Futures are trading higher heading into the opening bell…for now. It used to be that a positive tone in the futures market would suggest a positive tone to the upcoming trading day, but lately, futures are indicative of the market’s present tone and nothing else. Close your eyes or step away from the desk for a minute and the picture may look completely different when you get back. Along with futures in the green, bitcoin is trading up 3% and back near or above $39K (depending on when you look), crude oil is down slightly, and the 10-year yield is back up to 1.98%.
The only economic data point on the calendar was weekly mortgage applications which showed a decline of 13.1% compared to last week’s drop of 5.4%. Mortgage applications can be volatile, but last week’s drop was the steepest since April 2020 at the heart of the COVID lockdowns.
Read today’s Morning Lineup for a recap of all the major market news and events from around the world, including the latest US and international COVID trends.
If the S&P 500 was going to bounce one of these days, current levels provide a logical starting point as the S&P 500 closed yesterday just above 4,300 which is a level that has acted as support in the past eight months. How long that support holds in the current environment remains to be seen.

While YTD performance has essentially been a bloodbath for most stocks in the S&P 500 this year, stocks in the Energy sector have been living in an alternate reality. With an average YTD gain of 20.2%, stocks in the Energy sector are leading every other sector’s average YTD change by at least 20 percentage points! Stocks in the Financials sector have managed an average YTD gain of 0.2% this year, but every other sector’s average YTD change is negative. Sectors that have been the biggest laggards include Technology, Consumer Discretionary, and Real Estate where the average YTD change of each one’s components has been a decline of over 10%. Even in a traditionally defensive sector like Utilities, its components have already declined an average of 5.7% YTD.

Start a two-week trial to Bespoke Premium to read today’s full Morning Lineup.
The Closer – Ukraine Update, 2y Sale, Crude Crosscurrents, CoT – 2/22/22
Log-in here if you’re a member with access to the Closer.
Looking for deeper insight into markets? In tonight’s Closer sent to Bespoke Institutional clients, we begin tonight with a quick update on the situation in Ukraine and sanctions that were put into place today. We also touch on the market reaction to this news. Next, we recap some earnings news out after the closing bell and take a look at crude oil markets. We then dive into the solid 2-year note auction followed by a look at today’s economic data including home prices, consumer sentiment, preliminary Markit PMIs, and an update of our Five Fed Manufacturing composite. We finish with an update of the most recent CoT data.

See today’s post-market Closer and everything else Bespoke publishes by starting a 14-day trial to Bespoke Institutional today!
Ukraine: Now vs 2013-2014
In late 2013 and for the majority of 2014, Ukraine was central in the geopolitical news cycle, as Russia moved to annex Crimea. There was a large divergence within the country between pro-Russian separatists and Ukrainian loyalists, which caused months of unrest. In November of 2013, the Ukrainian President abandoned a favorable trade deal with the EU in favor of Russia, which sparked protests in Kyiv and other major cities. To make Ukrainian citizens feel better about their inherent reliance on Russia, Putin’s Russian government retired $15 billion of Ukrainian debt and reduced the price of oil being supplied to the nation. However, just a few months later, protests began turning deadly as the two groups once again collided. It soon became clear that Russia had a serious opportunity to make a move into land that was previously held by the USSR, and this caused consternation and outrage in Western nations. The Russian parliament soon approved the use of force in Ukraine to protect Russian interests, and it wasn’t long until sanctions were imposed by the US and Europe. Sanctions issued to Russia by the US in 2014 included travel restrictions, limited financing for Russian financial and energy companies, and additional measures to impact Putin’s ‘inner circle’.
In March of 2014, President Obama urged Moscow to “move back its troops” and ease tensions, but there was little change on the Russian front. In April, the US, EU, Ukraine, and Russia met in Geneva to attempt to de-escalate the situation diplomatically while Ukraine’s acting President authorized the use of military force against pro-Russian militants in Eastern Ukraine after Crimea voted to secede from Ukraine in what the West considered a highly manipulated referendum. While Russia’s actions led to a tense situation, conditions eased after Crimea was officially annexed. In June 2014, Russia canceled the authorization of military forces in Ukraine, and soldiers were soon returned to their bases. As troops were withdrawn, Ukraine signed a truce with pro-Russian militants, and the situation appeared resolved. Russia gained Crimea, but the rest of Ukraine (with a few exceptions) remained independent from the Russian Federation.
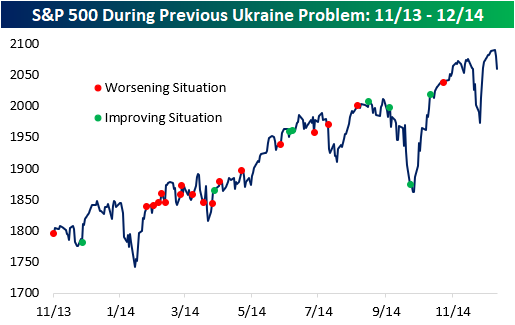
During this time period, the S&P 500 experienced increased volatility, but investors rushed to buy the dips. Between November of 2013 and 2014, the S&P 500 gained 13.5% and averaged a daily absolute change of 51 basis points (bps). During this time period, the S&P 500 traded down at least 5 percent from a high two times, but the index traded over 3% below highs for 12.2% of trading days (30/245). It is worth noting that only one pullback came immediately after headlines were published about a deteriorating situation, so from the perspective of US investors, there was little concern over the Ukraine situation.
Although the situation is certainly different this time around, the backdrop is relatively similar. Russia is becoming increasingly aggressive in its efforts to annex part or all of Ukraine, and troops are aligning across the border. Putin has made countless threats regarding Ukraine joining NATO, stating that this action would result in a European-Russian war. Due to the nature of the NATO agreement, this would essentially result in a global war, but since Ukraine is not currently part of NATO, it is highly unlikely that the US or EU will intervene militarily. However, the US and EU have threatened more severe sanctions than were seen in 2014, including prohibiting new investments, trade, or finance activities to bad actors in Ukraine. Most notably, there have been threats made to Russia regarding sanctions that would cut off Russia from access to the US Dollar system, which would significantly derail the Soviet economy.
With the situation more severe now than it was in 2014 and the threatened sanctions being quite different, equity market performance during this crisis has been far worse. 2014 was not an environment where the Fed was hiking rates, so the two occurrences have diverging macroeconomic backdrops. Nonetheless, this time around, the market does seem far more concerned about the Ukrainian situation than it did in 2014. The average absolute daily percent change of the S&P 500 since November 10th, when the crisis first started to flare up, has been 91 basis points, which is well above historical averages. The biggest selloff in this time period, which occurred between 1/14 and 1/21, came on the back of the headline that Russian troops began to arrive in Belarus for ‘military drills’. Also in this period, the US announced an additional $200 million in security aid to Kyiv, and NATO troops were placed on standby to bolster the EU’s Eastern defense. Since the first headline regarding Russian aggression in Ukraine emerged, the S&P 500 has shed 7.1% and is currently sitting at its lowest level since the news emerged, and there have been two separate 5%+ declines from a short-term high.
Again, it’s hard to properly weigh what impact various factors have had on the market’s decline in the last few months, but the market certainly appears much more concerned with how the situation will play out this time around than it was regarding Crimea in 2013 and 2014. Click here to view Bespoke’s premium membership options.

To look at this another way, in the chart below we compare the S&P 500’s cumulative performance during each of the Ukraine crises. For the current period, we used 11/10/21, which was when the first headlines surfaced regarding Russian troop buildups near the Ukrainian border. For the 2013/2014 period, the start date used was 11/21/13 which was when protestors began to gather in Kyiv after President Viktor Yanukovych abandoned an agreement on closer trade ties with the EU opting instead for another deal favoring Russia.
When comparing the cumulative equity market returns during the two periods, for the first two months, the pattern tracked each other pretty closely. Beginning in the last couple of weeks when the US publicly ramped up concerns that a Russian invasion of the region was imminent, though, any hopes of a continued bounce have been dashed. Again, Ukraine hasn’t been the only issue impacting markets in the past few days. The recent leg lower also began right around the time that St.Louis Fed President James Bullard began calling for a 50 bps rate hike, and Ukraine or not, that type of headline wouldn’t be supportive of equity prices. Click here to view Bespoke’s premium membership options and to sign up for a trial to any of them.

Richmond Optimistic In Spite of the Present
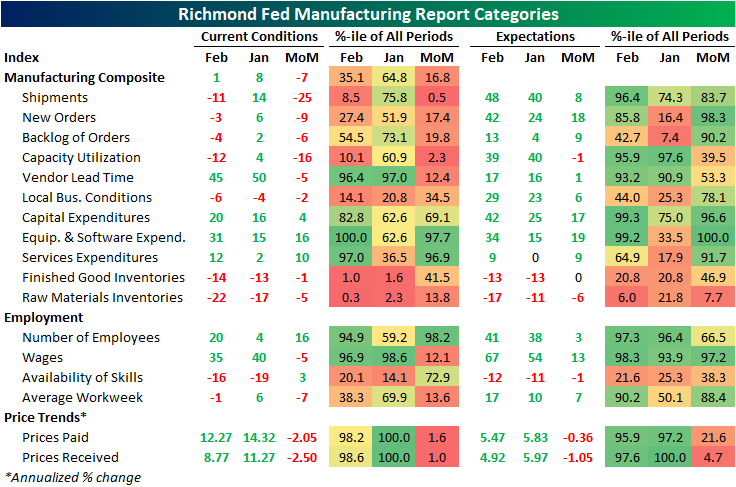
While the preliminary reading on US manufacturing from Markit released this morning showed activity grew at an accelerated pace in February, the Richmond Fed’s reading was yet another regional Fed indicator showing a deceleration in activity. The headline number was forecasted to rise two points to 10 but instead fell to a barely expansionary reading of 1.

Given the decline, breadth was weak this month with most categories falling month over month including a handful of dramatic declines from indices like Shipments and Capacity Utilization. While the composite reading remains in expansion, there were five categories that fell from expansionary to contractionary readings.
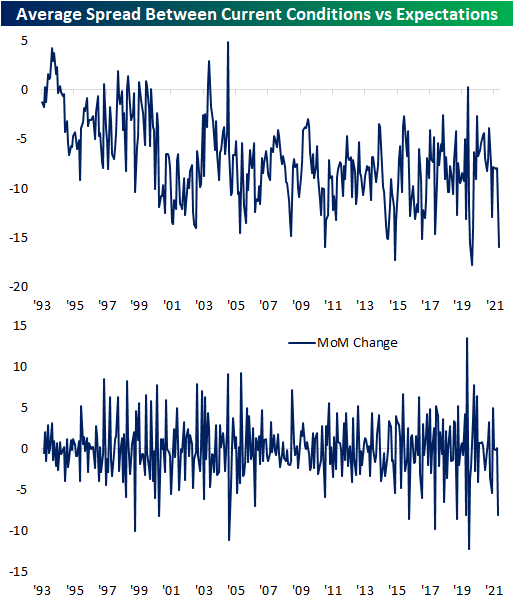
Although there was a material deterioration in current condition indices, expectations have held up remarkably well. In fact, most of these indices were higher month over month with many remaining in or moving into the top decile of historical readings. To illustrate, in the chart below we show the average spread across each category’s index for current conditions and expectations. Historically, expectations indices tend to have higher readings than current conditions, but currently, that reading is right around -16 which is the lowest reading (meaning expectations are higher than current conditions to the widest degree) since the spring of 2020. Prior to that, only the fall of 2015 has seen as low of a reading. Not only are the levels of these indices historically disconnected, but the month-over-month change in this average spread has also been one of the biggest drops on record.
Shipments was one of the worst categories in this month’s report having fallen from a healthy upper quartile reading of 14 all the way down to -11 which is in the bottom decile of all months on record and the third-largest m/m decline on record. In spite of that, expectations hit a new high of 48 and now are at the most elevated reading since July 2020. Albeit the readings and moves were less historic, other demand-related indices like New Orders and Backlog of Orders similarly fell into contraction after sizable declines even as expectations rose to recent highs. As for supply chains, this month showed an improvement as the index for Vendor Lead Times fell to a still elevated, but improved reading of 45.

The employment picture was a bit mixed in the month of February. While hiring increased with the index for Number of Employees recovering much of the January drop, wages grew at a slower rate and the average workweek fell into contraction for the first time since May 2020. The index for Availability of Skills was also improved and is now in the middle of its post-pandemic range.

Expenditures were another particularly interesting area of the report. Across these categories, there was a significant uptick this month with Equipment and Software Expenditure hitting a new record high and expectations for the category experiencing a record month over month gain and leaving it just shy of a record high. Click here to view Bespoke’s premium membership options.

Bespoke’s Morning Lineup – 2/22/22 – Geopolitics Takes Over
See what’s driving market performance around the world in today’s Morning Lineup. Bespoke’s Morning Lineup is the best way to start your trading day. Read it now by starting a two-week trial to Bespoke Premium. CLICK HERE to learn more and start your trial.
“Do you believe in miracles?” – Al Michaels
Today marks the 42nd anniversary of the ‘Miracle on Ice’ when the US men’s Olympic ice hockey team stunned the world with an upset over Russia and Al Michaels uttered the now-famous question “Do you believe in miracles?” The investment community is hoping for its own miracle in Ukraine this morning as geopolitical concerns regarding a potential Russian invasion roil markets. Futures have been lower ever since they opened for trading and Putin’s speech yesterday that recognized separatist Ukrainian regions. Things could be worse, though, as futures currently trade well off their overnight lows as conditions remain fluid.
It’s a busy morning for data as we’ve already had a decent amount of earnings reports, including Home Depot (HD), which is trading down over 2.5%. On the economic calendar, later this morning we’ll get flash readings on Manufacturing and Non-Manufacturing PMIs from Markit along with Consumer Confidence and the Richmond Fed
Read today’s Morning Lineup for a recap of all the major market news and events from around the world, including the latest US and international COVID trends.
Taking a look at where the major indices stand heading into the week, the picture isn’t pretty. Starting off with the Russell 2000 (IWM), which has been the weakest of the major indices, it is actually the least in danger of making an imminent lower low relative to January, even as it is down more than any of the other three. The Nasdaq 100 (QQQ) will likely open below its closing low from January this morning, and whether it takes out its intraday low remains to be seen. Lastly, the S&P 500 (SPY) will likely manage to open above its closing January low this morning, and we’ll see how things play out from there. One question you may be asking yourself this morning is why the futures aren’t trading even lower this morning. To help answer that question look no further than the charts below. As shown, stocks have already been selling off sharply heading into this weekend’s events, and while we wouldn’t go as far as to say that a Russian move into Ukraine is fully priced in, markets have been anticipating this for the last several weeks.

Start a two-week trial to Bespoke Premium to read today’s full Morning Lineup.
Bespoke Brunch Reads: 2/20/22
Welcome to Bespoke Brunch Reads — a linkfest of the favorite things we read over the past week. The links are mostly market related, but there are some other interesting subjects covered as well. We hope you enjoy the food for thought as a supplement to the research we provide you during the week.
While you’re here, join Bespoke Premium with a 30-day free trial!
Europe
Top European Court Rules E.U. Can Freeze Aid to Poland and Hungary by Matina Stevis-Gridneff, Moika Pronczuk, and Benjamin Novak (NYT)
The European Court of Justice ruled that the EU is allowed to withhold funding from countries that fail to meet and uphold basic rule of law standards, opening the door to bloc withholding billions from Hungary and Poland over efforts to pack courts and hide spending details. [Link; soft paywall]
Frustrated Ukrainians Are Caught Between America’s War Hype and Russia’s Constant Lies by Jack Crosbie (Rolling Stone)
On the ground in Ukraine, ordinary people are frustrated by the escalation of tensions by Russia and the aggressive rhetoric about that escalation from Ukraine’s allies in the West. [Link]
Supply Chain Frustration
Guacamole’s Days Are Numbered at Eateries With Avocados Scarce by Leslie Patton and Allison Nicole Smith (Bloomberg)
The USDA halted imports of avocados from Michoacán after a supervisor was threatened over a refusal to certify a shipment, and the result is a death of avocados for smaller buyers that can’t secure large supplies. [Link; soft paywall]
4 Bed, 3 Bath, No Garage Door: The Unlikely Woes Holding Up Home Building by Emily Badger (NYT)
Individual finishes for houses are facing idiosyncratic shortages that are preventing completions. Garage doors are by far the most acute shortage for now, with lead times reaching into the months for what used to be a widely available and easy to secure commodity. [Link; soft paywall]
Autos
Teens Find Rising Used-Car Prices Dash Hopes of First Car by Nore Eckert (WSJ)
Older teens are having a hard time getting their hands on their first set of wheels as soaring prices and tight supplies in the used auto market mean waiting a while to hit the road in a traditional rite of passage. [Link; paywall]
Market Insights – 2/15/2022 (Black Book)
Through the week of Valentine’s Day, wholesale used car prices fell 67 bps WoW versus a 36 bps decline on average for that week in 2017-2019. That’s among the steepest declines since the pandemic hit and suggests that the tight conditions in used auto markets are starting to alleviate. [Link]
Ford’s Mustang Mach-E beats Tesla’s Model 3 as Consumer Reports’ top electric vehicle for 2022 by Phil LeBeau (CNBC)
Ford’s Mustang Mach-E has beaten out the Tesla Model 3, with reliability data proving the defining difference between the two entry-level electric vehicles. [Link]
Wall Street
JPMorgan Jumps Into Metaverse Ahead of Its Peers by Alex Padalka (Financial Advisor)
The first major US bank is jumping in to the decentralized metaverse with a “lounge” in Decentraland; it includes a picture of CEO Jamie Dimon and a tiger. [Link]
Carl Icahn Won’t Stop Till He Gets What He Wants by Scott Deveau (Bloomberg)
A light profile of an investor who compares himself to Alexander the Great and has recently relocated to Florida. [Link; soft paywall, auto-playing video]
Snow Business
Vail Resorts Sold a Record Number of Passes. Now Their Ski Areas Are Facing a Logistical Nightmare. By Max Ufberg (Outside Online)
The forty resorts owned by Vail Resorts have seen an avalanche of pass sails after cutting prices 20%, leading ski slopes and lift lines jammed with customers as the company didn’t add capacity to meet the huge expansion in customers. [Link]
Read Bespoke’s most actionable market research by joining Bespoke Premium today! Get started here.
Have a great weekend!
Crude Oil Snapping a Historic Winning Streak
With front-month WTI futures lower again today and in addition to the losses earlier this week, black gold declined over 2% this week. As shown below, this week’s decline looks to be breaking the commodity’s uptrend that has been in place since late last year which has brought it up to some of the highest levels in several years.
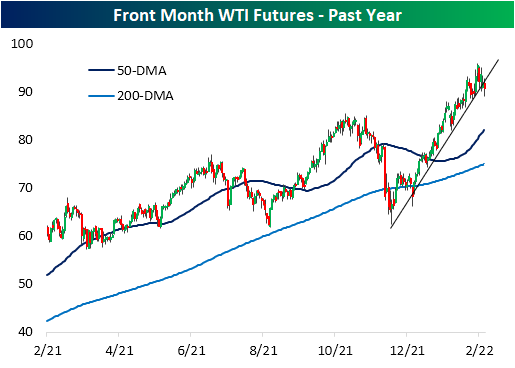
The rally over the past few months has been very consistent for crude oil. In fact, crude oil is on pace for its first weekly loss in eight weeks. Historically, it has been uncommon for crude oil to rally for such a long span. Since 1983, there have only been five other weekly winning streaks that have also gone on for at least 8 weeks in a row. The most recent of these ended at nine weeks last October.

Below we show the performance of crude oil following each time that it has ended a winning streak of at least 6 weeks, of which there have been 24 since 1983. Performance following the end of these streaks has been mixed with positive performance around 50% of the time one week, one month, six months, and one year later across these instances. Three returns, however, have more consistently seen positive returns which have on average been larger than the norm. Click here to view Bespoke’s premium membership options.
