IPOs in Worst Drawdown Since the Dot Com Bust
In an earlier post, we noted the dramatic underperformance of IPOs in the past year using the Renaissance IPO ETF (IPO) as a proxy for newly listed companies. One downside of using the IPO ETF is that it only began trading in 2013. To get a gauge on IPOs going further back, below we have created an index using the Bloomberg IPO index starting in August 1994 through October 2017 when it was discontinued, then switching to the performance of the IPO ETF in the time since then. The two measures of IPOs are not perfectly like for like given differences in methodology (for example, the Bloomberg index only tracked companies that debuted in the past year versus three years for IPO), but combining the two still helps us compare the current drawdown versus prior ones dating back to the early 1990s.
Since peaking with the rest of the most aggressively valued stocks in early 2021, IPOs as a group are in a 60%+ drawdown! While we’ve seen multiple drawdowns of at least 30% for IPOs over the years (during the Financial Crisis, the late 2018 sell-off, and the COVID Crash), the current drawdown has been bigger than any period except for the Dot Com bust from 2000-2002. In case you weren’t aware of how painful the declines have been in “growth” areas of the market like IPOs, one look at the second chart below should do the trick. Click here to learn more about Bespoke’s premium stock market research service.

Retail Sales: Bricks Leading Clicks
For an economy dominated by consumer spending, the April Retail Sales report scheduled for Tuesday (5/16) promises to be an important one. On the surface, Retail Sales have slowed considerably from their peak readings during the era of stimulus, but even now that the impacts of government checks have moved out of the year look-back, sales have managed to remain relatively strong – at least on a nominal basis. Retail Sales for March were up nearly 7% y/y, although anyone paying attention knows that after factoring in the effects of 8%+ inflation, real Retail Sales would actually be negative.

While Retail Sales have continued to grow at a healthy clip, there’s been an interesting shift between the drivers of the strength. The chart below breaks down the y/y change in sales for online vs non-online sales. For the latest numbers through March, non-online sales were up 7.72% y/y while online sales were only up 1.8%. Looking at this chart over time, one near-constant right up through the early months of the pandemic was that online sales growth was faster than growth in non-online sales. For the last year, though, the roles have been reversed. In fact, in the last 12 months, there has only been one month where the y/y change in online sales was greater than the y/y change in non-online sales.
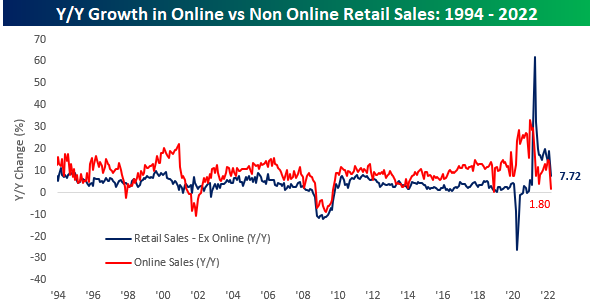
The chart below shows the monthly spread in the y/y change of online versus non-online sales going back to 1994. In looking at the chart, ever since 2000, months where the y/y change in non-store was higher than the y/y change in online were few and far between. While there have been 11 months in the last 12 where non-online sales grew at a faster y/y pace than online, in the 20 years before the pandemic, there were only 18 months where non-online sales grew at a faster rate than online. Click here to learn more about Bespoke’s premium stock market research service.

IPOs Rarer and Hurting
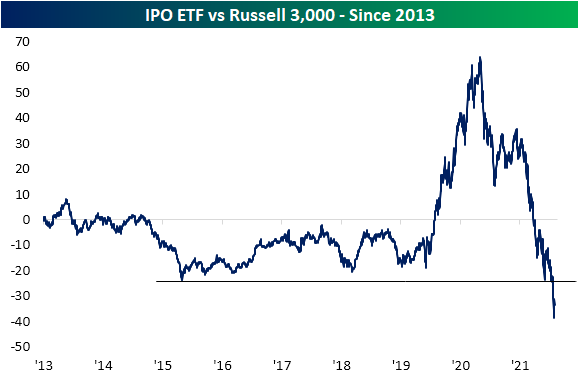
It has now been over a year since the Renaissance IPO ETF (IPO)—an ETF tracking a basket of the largest and most liquid stocks that recently debuted—peaked in February 2021. While it then trended sideways through last fall, IPO has been on a one-way trip lower since. Currently, the ETF is down over 57% versus its 52-week high in September. In that same time, the Russell 3,000 is down only around 12%. As shown in the second chart below, IPOs saw a massive string of outperformance from mid-2020 through early 2021, but the past year has erased any and all of that. In fact, the ratio of IPO to the Russell 3,000 has in the past couple of weeks collapsed to record lows going back to late 2013 when it began trading.

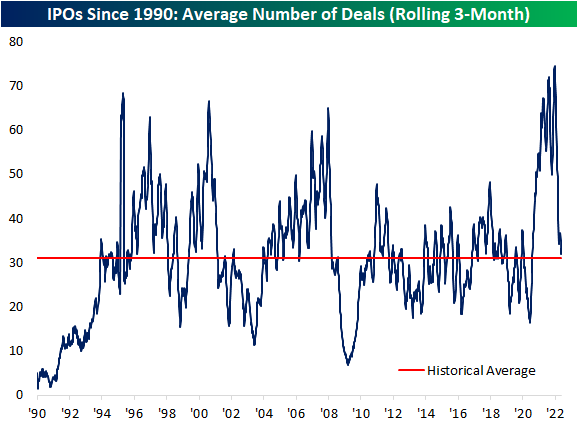
Not only are recent IPOs generally performing poorly, but issuance itself has also dried up. Below we show the average number of IPOs over a rolling 3-month span since 1990. The post-pandemic period saw an explosion of IPOs with the average deal count actually surpassing that of the 1990s or the similarly high reading leading up to the financial crisis. This year, that count has fallen sharply and is currently right back in line with the historical average. Click here to learn more about Bespoke’s premium stock market research service.
B.I.G. Tips – Top Earnings Triple Plays (Q1 ’22)
Today we published our newest Top Triple Plays report. This season we identified 11 earnings triple plays that may be worth taking a closer look at.
What is a triple play? When a stock reports quarterly earnings, it registers a “triple play” when it beats analyst EPS estimates, beats analyst revenue estimates, and raises forward guidance. We coined the term back in the mid-2000s, and you can read more about it at Investopedia.com. We consider triple plays to be the cream of the crop of earnings season, and we’re constantly finding new long-term opportunities from this basket of names each quarter. You can track the newest earnings triple plays on a daily basis at our Triple Plays page if you’re a Bespoke Premium or Bespoke Institutional member. To read our newest report and see the triple plays that we think look the best right now, start a two-week trial to Bespoke Premium!

Empire Fed Goes From One End To The Other
May’s first reading on regional manufacturing activity out of New York showed significant deterioration. The New York Fed’s Empire State Manufacturing survey’s headline index dropped from a solid reading of 24.6 last month down to -11.6 in May. That is only slightly above the low from two months ago that had marked the first significant contraction in activity since the spring of 2020.

Not only are General Business Conditions back into contractionary territory, but the double-digit negative reading sits in the bottom decile of all months on record going back to the start of the index in 2001. That compares to last month’s reading which was just shy of the top decile. Given the total reversal within the historical range, the month-over-month decline of 36.2 points is now the second-largest one-month drop on record behind the 56.7 point decline in April 2020.
Only New Orders and Shipments fell enough to reach contractionary levels this month, but most other categories also saw large month-over-month declines. Expectations similarly saw broad declines, however, the categories that saw the biggest deteriorations in current conditions (General Business Conditions, New Orders, and Shipments) saw improvements in six-month expectations.
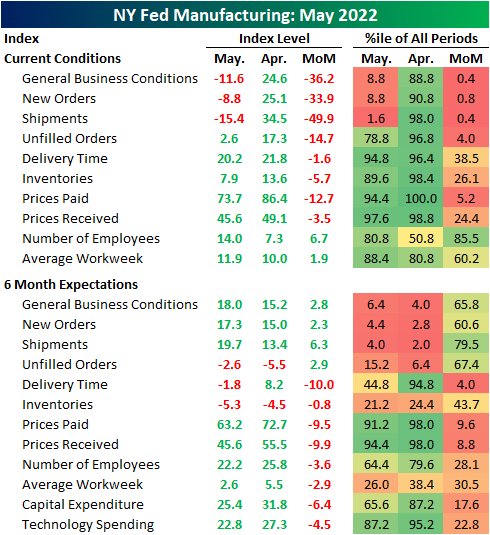
As previously mentioned, the most shocking declines were in demand-related categories, namely New Orders and Shipments. These two indices fell by 33.9 and 49.9 points, respectively. For New Orders, that was the third-largest decline on record outside of the 56-point drop in April 2020 and a 43.1-point decline in the wake of September 11, 2001. The only larger decline in Shipments happened, again, in April 2020. Unfilled Orders also fell dramatically, though the month-over-month decline was not as close to a record, and the actual level of the index is still relatively elevated in the top quartile of its historical range. Although more New York area firms reported declines in new orders and shipments, expectations were each higher month-over-month following sharp declines leading into this month’s report.

Perhaps in part due to that slow down in demand, Delivery Times continue to decelerate with the index dropping another 1.6 points. That follows a much larger double-digit decline in April. In what could be either a positive sign as a result of finally alleviated supply chains or a negative sign given slowing demand, responding firms also reported that they expect delivery times to finally decline in six months. That was the first negative reading in expectations since October 2020.

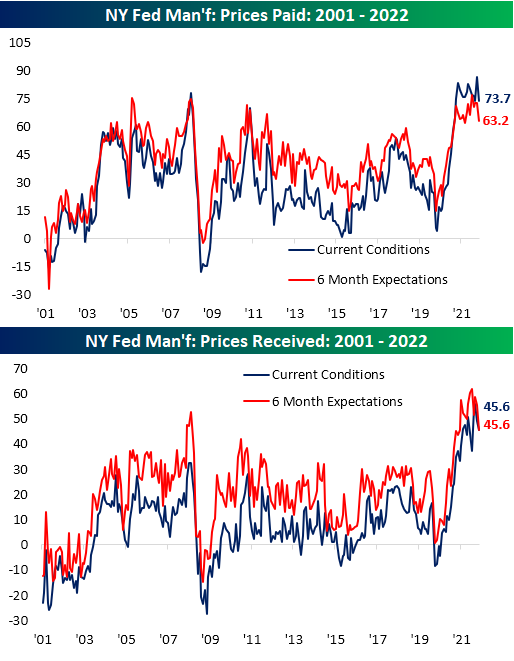
Additionally, inflationary pressures appear to be easing as both indices for Prices Paid and Received declined across current conditions and 6-month expectations. Those declines are only small dents in what have been extremely strong runs over the past two years.
Perhaps the only silver lining in this month’s report was in regards to employment. New York area firms accelerated both net hiring and the average workweek. Again though, expectations were less optimistic as those indices continue to roll over alongside plans for Technology Spending and Capital Expenditures. In other words, the employment situation may have improved in May, but that is not expected to improve dramatically in the months ahead as demand has weakened. Click here to learn more about Bespoke’s premium stock market research service.

Bespoke’s Morning Lineup – 5/16/22 – Seventh Time The Charm?
See what’s driving market performance around the world in today’s Morning Lineup. Bespoke’s Morning Lineup is the best way to start your trading day. Read it now by starting a two-week trial to Bespoke Premium. CLICK HERE to learn more and start your trial.
“If you have the right attitude, interesting problems will find you.” – Eric S. Raymond

Below is a snippet of content from today’s Morning Lineup for Bespoke Premium members. Start a two-week trial to Bespoke Premium now to access the full report.
Markets are getting off to a slow start this week. Futures, which were modestly lower most of the morning and overnight, have turned modestly higher as we type this. Given the horrendous data coming out of China overnight and the fact that Europe lowered economic growth forecasts, that’s actually not so bad. Treasury yields are basically flat while crude oil prices are modestly lower but still trade just below $110 per barrel. The only economic report on the calendar this morning is the Empire State Manufacturing Index which will give us the first read on data for the month of May. Economists are expecting the headline index to decline from last month’s reading of 24.6 down to 15.
In today’s Morning Lineup, we recap the continued developments in the crypto space (pg 4), market action in Asia and Europe (pg 4), the lousy economic data out of China (pg 5), and a lot more.
After six weeks in a row of declines, will the seventh time be the charm as bulls look to eke out a week of gains for a change? In last Thursday’s reversal, the S&P 500 managed to find some support right around the highs from early Q1 2021 even as it traded to 52-week lows. At the index level, this support level works out to roughly a range of 3,800 to 3,850.

At the sector level, the only one to finish last week in positive territory was Consumer Staples, and just barely at that. On the downside, Real Estate, Consumer Discretionary, Financials, and Technology all fell by more than 3%. Energy was also down substantially but still managed to close out the week at overbought levels. Sectors like Consumer Discretionary, Communication Services, Financials, Real Estate, and Technology all finished off last week more than 8% below their 50-DMAs, so if the momentum from late Thursday and Friday can continue, these sectors have the most room to rally.

Start a two-week trial to Bespoke Premium to read today’s full Morning Lineup.
Bespoke Brunch Reads: 5/15/22
Welcome to Bespoke Brunch Reads — a linkfest of the favorite things we read over the past week. The links are mostly market related, but there are some other interesting subjects covered as well. We hope you enjoy the food for thought as a supplement to the research we provide you during the week.
While you’re here, join Bespoke Premium with a 30-day free trial!
Inflation
How the Inflation Rate Is Measured: 477 Government Workers at Grocery Stores by Rachel Wolfe (WSJ)
A look at the small battalion of price-checkers who wander from store to store looking for the prices of goods and services that feed into the consumer price index. [Link; paywall]
The Physical Capacity Shortage View of Inflation by Alex Williams (Employ America)
Recent inflation data suggests that physical limitations are a larger constraint on inflation than availability of labor inputs, with logistics and plant capacity more relevant than the unemployment rate. [Link]
Fuel
Why the Northeast is quietly running out of diesel by Rachek Premack (FreightWaves)
Very low diesel inventories are sparking concerns that the East Coast may run out of diesel fuel, though so far tight supplies haven’t led to actual shortages thus far despite a dearth of supply amidst high prices. [Link]
NYC Billionaire Catsimatidis Warns of Looming East Coast Diesel Rationing by Lucia Kassai (Bloomberg)
The CEO of United Refining Co, an East Coast oil refiner and fuel station operator, tight diesel markets will mean an absolute shortfall of the fuel over the summer. [Link; soft paywall]
Ford F-150 Lightning First Drive: Quiet Storm by Andrew J. Hawkins (The Verge)
Reviews are flowing in from Ford F-150 Lightning media events in Texas held last week, and the results are an interesting insight into the unique offering that doesn’t try and reinvent the wheel, while completely reinventing the fuel source. [Link]
Medical Scans
MIT, Harvard scientists find AI can recognize race from X-rays — and nobody knows how by Hiawatha Bray (Boston Globe)
Machine learning programs can generate some strange results, as in this case where a program designed to read x-ray and CT scans manages to identify the race of the patient at a 90% accuracy. [Link]
Covid shutdowns in China are delaying medical scans in the U.S. by Christopher Rowland (WaPo)
A GE Healthcare factory in China stopped producing contrast media, imperiling the ability of hospitals in the United States to do otherwise routine scans. [Link; soft paywall]
New York
NYC Rent Guidelines Board votes to increase tenants’ rents by up to 6% by Gwynne Hogan and Catalina Gonella (Gothamist)
The oversight board which approves the rate at which stabilized rent apartments can raise prices; they will rise 2% to 4% for one year leases and as much as 6% for 2 year leases. [Link]
Countdown Starts for NYC Businesses Required to Post Salary Ranges on Job Ads by Jeff Green (Bloomberg)
A New York City law will require employers to disclose pay in job postings, joining CO, WA, CT, and four other states in enacting salary transparency rules of one kind or another. [Link; soft paywall]
Acceptance Letters
This Year’s College Admissions Horror Show by Nicole LaPorte (Yahoo!/Town & Country)
Elite high schools promised students – and more relevantly, perhaps, their parents – a path to elite college admission. But changing criteria and a smaller acceptance class this year mean many hopefuls didn’t get their hope-for invitations. [Link]
China
China’s Economic Slowdown Is Rippling All Around the World by Jason Douglas and David Harrison (WSJ)
The massive boom that has pulled hundreds of millions of Chinese citizens into the global middle class has faltered, with companies across the world warning activity is plunging. [Link; paywall]
Labor Markets
Target Workers Are Joining the Union Wave by Bryce Covert (The New Republic)
The 21,000 pit stop on I-81 in southwest Virginia is a strange place for unionization to spread, but Target is facing a unionization vote in the tiny outpost. It would be the first store to unionize nationally, and as many as six other stores are considering similar moves. [Link]
Fiscal Policy
Monthly Budget Review: April 2022 (CBO)
The federal deficit for the October-April fiscal period of 2022 showed an 84% decline in the federal deficit relative to October-April of 2021, one of the largest and fastest declines ever recorded. [Link]
Read Bespoke’s most actionable market research by joining Bespoke Premium today! Get started here.
Have a great weekend!
The Bespoke Report – 5/13/22 – Down, Down, Down, Down, Down, Down & Quarterly Macro Outlook
This week’s Bespoke Report newsletter is now available for members.
For both the S&P 500, Nasdaq, and the Russell 2000, 52-week lows were the norm this week, and in the case of the Nasdaq and Russell 2000, the recent plunges took them back to levels not seen since around the November 2020 election. Who would have ever thought that coming out of COVID would prove to be more difficult for markets than COVID itself?
Following up on last week’s Pros and Cons presentation, for this week’s report, we are including a macro update on global markets and the economy that was put together by our macro strategist George Pearkes. Therefore, this week’s Bespoke Report provides just an abbreviated recap of markets this week.
The current backdrop could easily be the most complicated backdrop that investors have ever faced, so our hope is to put things into perspective. The bottom line? Supply chains and inflation remain in flux, but there are signs that these issues could start to work themselves out in the second half. If they do, a less hawkish FOMC could be the market surprise for the second half. A key risk, though? Economic activity remains strong, but there are legitimate signals that demand has peaked.
In addition to this week’s Bespoke Report, we have also included our updated quarterly macro overview (“Capped Inflation & Capped Hike Pace Uncap Returns”). To read this week’s full Bespoke Report and access everything else Bespoke’s research platform has to offer, start a two-week trial to one of our three membership levels.

S&P 500 Up 2% At Noon
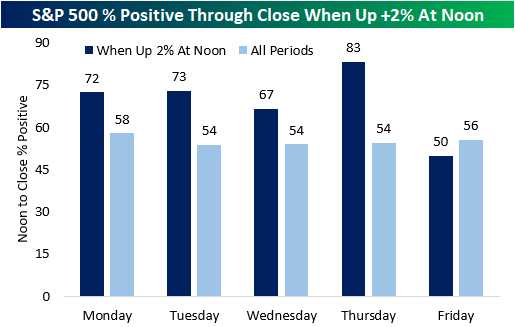
After a tumultuous week, the S&P 500 gapped higher this morning and continued to rip throughout the morning. As of noon, the S&P 500 was up 2.2%, a much-needed rally after a week of pain. Since the start of 1983, the S&P 500 has been up by 2%+ at noon 110 different times, 22 of which have occurred in the pandemic era. There has been only one occurrence this year (3/9) and two in 2021 (3/1/21 and 12/7/21). On a median basis, the S&P 500 averages a noon-to-close gain of 54 basis points (bps) when it rallies 2%+ in the morning, which is over ten times the median of all periods (5 bps). However, looking at just Friday occurrences, the S&P 500 has had a median drawdown of 9 bps from noon to the close, which is 11 bps weaker than that of all periods. Additionally, Friday was the only weekday with median noon-to-close returns below that of all periods when the index had gained at least 2% by noon.

Friday is also the only day of the week with lower than average positivity rates following 2%+ morning rallies. Thursday is the strongest with a positivity rate of 83%. Overall, the index has performed positively from noon to close 70% of the time following these occurrences. click here to become a Bespoke premium member today!
Stocks Near Pre-COVID Highs – 5/13/22
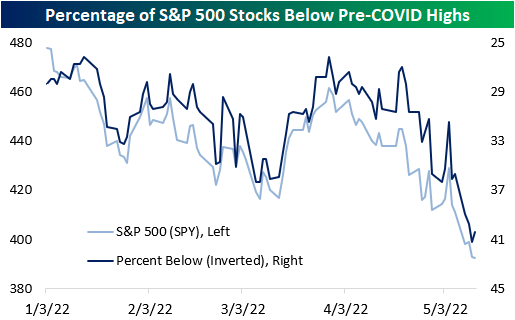
Two days ago, we outlined the percentage of stocks in each S&P 500 sector that were below their pre-COVID highs to show that many of the stocks that surged due to pandemic effects have significantly fallen off, netting long-term holders a negative return since the onslaught of the pandemic. Over the course of the next few weeks, we will be outlining the S&P 500 stocks that are breaking below/above their pre-COVID highs, as we did yesterday. Yesterday, the S&P 500 fell by 10 basis points to close at a new 52-week low, but the index is still up over 15% relative to pre-COVID highs. As of yesterday’s close, 40.4% of S&P 500 stocks were below this critical level, an 80 basis point improvement relative to the close on 5/11. 71.4% of utilities and 66.7% of communication services stocks were below their respective pre-COVID highs as of yesterday’s close. On the other hand, only 18.5% and 23.8% of S&P 500 stocks in the materials and energy sectors were below their respective highs between the start of 2019 and the end of February 2020. Additionally, 7.8% of S&P 500 stocks were between 0-5% above their pre-COVID highs (39 members).
Only one stock crossed below its pre-COVID highs for the first time since breaking above that level: MGM Resorts (MGM). However, the stock gapped higher by over 3% today, thus returning above this level. The weak performance as of late is due to a variety of factors including China’s zero-Covid policy, the broader market drawdown, and a weak reaction to the latest earnings report, even though the company beat on the top and bottom line.

One stock traded lower to enter a +2% channel relative to pre-COVID highs for the first time in a couple of months: Jack Henry (JKHY). JKHY is a payment processing and lending firm and competes with the likes of Block (SQ) and Toast (TOST). To gain access to our chart scanner tool, click here to become a Bespoke premium member today!
