Bespoke’s Morning Lineup – 3/7/23 – Powell Takes the Mound
See what’s driving market performance around the world in today’s Morning Lineup. Bespoke’s Morning Lineup is the best way to start your trading day. Read it now by starting a two-week trial to Bespoke Premium. CLICK HERE to learn more and start your trial.
“Observation is a dying art.” – Stanley Kubrick

Below is a snippet of content from today’s Morning Lineup for Bespoke Premium members. Start a two-week trial to Bespoke Premium now to access the full report.
It’s been a wild ride for natural gas over the last two trading days. After an 8% rally Friday, natural gas plunged more than 14% on Monday for its largest one-day decline since June 30th and its 15th worst day since 1990. 2023 is barely more than two months old, but yesterday’s decline was the 5th time this year that natural gas had a single-day move (up or down) of 10%+, and that follows last year when there were a record 18 daily 10%+ moves. If the pace of volatility that natural gas has seen so far this year were to continue for the remainder of the year, there would be 28 single-day moves of 10%+. For some perspective, before last year there were just three years (1996, 2001, and 2009) where natural gas experienced ten or more single-day moves of 10%+.

The record volatility of natural gas can be further illustrated by looking at the commodity’s average daily move over a rolling 200-trading day period. Before 2022, the average daily percentage move in natural gas prices never exceeded 3.8% and from 2012 right up until COVID, the average daily move never exceeded 2.6%. Covid and the war in Ukraine changed all that, and nowadays, on any given day, a daily move of 4.6% in natural gas has become the norm as this degree of volatility in the commodity has never been experienced before.

Our Morning Lineup keeps readers on top of earnings data, economic news, global headlines, and market internals. We’re biased (of course!), but we think it’s the best and most helpful pre-market report in existence!
Start a two-week trial to Bespoke Premium to read today’s full Morning Lineup.
B.I.G. Tips – Q4 2022 Earnings; Triple Plays
Today we published our newest Earnings Triple Plays report. This season there were a total of 105 earnings triple plays out of just under 2,000 individual quarterly earnings reports from US-listed stocks.
What is a triple play? When a stock reports quarterly earnings, it registers a “triple play” when it beats analyst EPS estimates, beats analyst revenue estimates, and raises forward guidance. We coined the term back in the mid-2000s, and you can read more about it at Investopedia.com. We consider triple plays to be the cream of the crop of earnings season, and we’re constantly finding new long-term opportunities from this basket of names each quarter. You can track the newest earnings triple plays on a daily basis at our Triple Plays page if you’re a Bespoke Premium or Bespoke Institutional member. To read our newest report and see some of the triple plays with intriguing charts at the moment, start a two-week trial to Bespoke Premium!

Bespoke’s Morning Lineup – 3/6/23 – Take Two of These and Call Me in the Morning
See what’s driving market performance around the world in today’s Morning Lineup. Bespoke’s Morning Lineup is the best way to start your trading day. Read it now by starting a two-week trial to Bespoke Premium. CLICK HERE to learn more and start your trial.
“Nothing a couple of aspirin can’t cure.” – Peggy Olson, Mad Men
Below is a snippet of content from today’s Morning Lineup for Bespoke Premium members. Start a two-week trial to Bespoke Premium now to access the full report.
The headlines say that the market’s fate all comes down to the next 13 trading days, but this ‘important’ period for the market is starting off slowly. Equity futures are oscillating around the unchanged line even as Treasury yields and commodities have pulled back. Crude oil down over 1% while natural gas plunges more than 12% on little news. Just to illustrate how quiet things are this morning, bitcoin is down less than 5 dollars – not percent – but dollars!
It may be quiet this morning, but the market has been giving headaches to both bears and bulls in the last several weeks. A quick look at a chart of the S&P 500 illustrates the frustration being felt on both sides. On a side note, it was ironic to see this morning that Bayer filed its patent for the ultimate headache cure (or at least one of them), aspirin, on this day in 1899.
In late January/early February, the S&P 500 broke above its December highs and its 200-day moving average forming what looked like the first real higher high since the peak in early January. At that point, the S&P 500 was further above its 200-DMA than at any point since it first broke below that level early last year. Then, the January employment report was released.
January’s much stronger-than-expected employment report coupled with a strong Retail Sales report and higher-than-expected inflation data, shifted the narrative quickly back to one where things were overheating and inflation was going to turn higher. The market quickly reacted with a radical shift in market pricing for Fed policy as Treasury yields surged. Stocks immediately reversed much of the gains from January, and the Dow actually ticked into the red for the year. The S&P 500’s pullback wasn’t as bad, but late in the month, it was back below its 50-DMA and once again testing its 200-DMA.
An intraday bounce on that first test briefly rekindled some optimism, but by last Thursday morning, the S&P 500 was back below its 200-DMA and both bears and bulls started to prepare for another leg lower. As hope was fading, stocks staged an intraday rebound that continued right into Friday. Now, heading into the new trading week, the S&P 500 is back above its 200-DMA and 3% above Thursday’s lows. Bulls are feeling confident again, but with Jay Powell scheduled to testify tomorrow, the employment report coming out Friday, and then CPI next week, don’t start snorting at the bears just yet, they may just need that aspirin back by next week.

Our Morning Lineup keeps readers on top of earnings data, economic news, global headlines, and market internals. We’re biased (of course!), but we think it’s the best and most helpful pre-market report in existence!
Start a two-week trial to Bespoke Premium to read today’s full Morning Lineup.
Bespoke Brunch Reads: 3/5/23
Welcome to Bespoke Brunch Reads — a linkfest of the favorite things we read over the past week. The links are mostly market related, but there are some other interesting subjects covered as well. We hope you enjoy the food for thought as a supplement to the research we provide you during the week.
While you’re here, join Bespoke Premium with a 30-day trial!
Climate Disruption
As Oil Companies Stay Lean, Workers Move to Renewable Energy by Clifford Krauss (NYT)
While energy companies avoid adding headcount and keep a laser focus on cashflows, renewables are rapidly scaling up and are poaching talent in the process, meaning American jobs are rapidly shifting from the oilpatch to wind and solar farms. [Link; soft paywall]
California senate pushes to stabilize the homeowners insurance market by Morgan Rynor (MSN/KFMB San Diego)
After a catastrophic run of forest fires, fire insurance in California is either not available at all or becoming prohibitively expensive, making homeowners far more vulnerable to the still-significant fire risk that has beset much of the state. [Link]
Prices
Column: With winter almost over, Europe’s gas stocks are at seasonal record high by John Kemp (Reuters)
With winter winding down, EU and UK gas storage is still 61% full, with more than 680 terawatt hours worth of gas in inventory. That offers hope that building supplies ahead of next winter will be a much easier task. [Link]
Sellers’ Inflation, Profits and Conflict: Why can Large Firms Hike Prices in an Emergency? by Isabella M. Weber and Evan Wasner (UMass Amherst Economics Working Papers)
New research that argues post-COVID inflation is mostly about expanding market power and margins rather than excessive demand. [Link]
Lilly to cut some list prices by 70% and offer $25 insulin by Bhanvi Satija and Patrick Wingrove (Reuters)
After a $35 price cap on insulin was extended to most Americans who have insurance, drugmakers have made equivalent cuts to the out-of-pocket costs of their drugs in a move that will make it much easier for diabetics to access insulin. [Link; registration required]
Ukraine
In an Epic Battle of Tanks, Russia Was Routed, Repeating Earlier Mistakes by Andrew E. Kramer (NYT)
The latest egregious blunder from Russian war planners: massed tank attacks with little infantry support or tactical flexibility to deal with ambushes, mines, and Ukrainian anti-tank doctrine. [Link; soft paywall]
Trapped In The Trenches In Ukraine by Luke Mogelson (NYer)
Remarkable dispatches from the front lines of the war in Ukraine. A very long read, but filled with incredible and engaging detail about the soldiers and environment on the battlefield. [Link; soft paywall]
National Defense
‘Havana Syndrome’ Not Caused By Energy Weapon Or Foreign Adversary, Intelligence Review Finds by Shane Harris and John Hudson (WaPo)
The malady blamed on some sort of energy weapon wielded by foreign adversaries is much more quotidian than science fiction, an embarrassing challenge to a narrative that had treated ‘Havana syndrome’ as some sort technological wonder. [Link; soft paywall]
The First Battle of the Next War by Mark F. Cancian, Matthew Cancian, and Eric Heginbotham (CSIS International Security Program)
This report summarizes the findings of a wargame run by the CSIS and designed to simulate Chinese invasion of Taiwan. The result of US/Taiwanese/Japanese resistance to a Chinese invasion is typically success but at massive cost; generally, the failure is thanks to stiff Taiwanese resistance once Chinese troops have landed. [Link; 165 pg PDF]
Crypto
Crypto Companies Behind Tether Used Falsified Documents and Shell Companies to Get Bank Accounts by Ben Foldy and Ada Hui (WSJ)
One of the owners of Tether Holdings, issuer of the tether stablecoin, admitted an effort to “circumvent the banking system by providing fake sales invoices and contracts for each deposit and withdrawal” per emails review by the WSJ. [Link; paywall]
ETFs
Are you short Jim or long Jim? by Alexandra Scaggs (FTAV)
Want to bet on or against the stocks that are mentioned by CNBC personality Jim Cramer? Luckily there are now ETFs for each. [Link; soft paywall]
Time Marches On
US senators reintroduce bill to make daylight saving time permanent by David Shepardson (Reuters)
A bipartisan group of 12 Senators wants to do away with twice-per-year clock changes in favor of a year-round constant time. [Link; registration required]
Guns
74,000 & growing: Some NC police departments stockpile guns rather than release them by Virginia Bridges (The Charlotte Observer)
Police departments in the 10 largest cities across North Carolina number 74,000 and counting as firearms seized during police actions sit in storage. State law bans cops from destroying guns for any reason. [Link; soft paywall]
Social Media
I Gave Into The New Twitter Algorithm And I Went Way Too Viral by Ryan Broderick (Garbage Day)
An anecdotal but convincing analysis of what is making Twitter’s algorithm tick these days, and a depressing accounting of how much the site has deteriorated. [Link]
Read Bespoke’s most actionable market research by joining Bespoke Premium today! Get started here.
Have a great weekend!
Bespoke’s Morning Lineup – 3/3/23 – Three Was Enough?
See what’s driving market performance around the world in today’s Morning Lineup. Bespoke’s Morning Lineup is the best way to start your trading day. Read it now by starting a two-week trial to Bespoke Premium. CLICK HERE to learn more and start your trial.
“For the execution of the journey to the Indies I did not make use of intelligence, mathematics or maps.” – Christopher Columbus
Below is a snippet of content from today’s Morning Lineup for Bespoke Premium members. Start a two-week trial to Bespoke Premium now to access the full report.
After three weeks of declines, it was looking like March would only add to the tally. Thursday’s rally pushed the S&P 500 into positive territory for the week, though, and with futures indicated higher now, equities are on pace for a positive week…if they can get through today. It’s a relatively quiet day on the economic calendar today with PMIs for the services sector, the only reports scheduled for release. These are important indicators to watch for signs of whether or not the economy is running too hot, and the international versions of these reports released this morning showed strength. January’s economic data fed a narrative that the economy just wouldn’t quit even as the Fed tried its best to squash it. This week’s data for February like Consumer Confidence, Chicago PMI, and ISM Manufacturing, though, weren’t exactly positive, and they all missed expectations.
One area of the markets not rallying this morning is crypto. After a 50% rally through its high over Presidents’ Day weekend, bitcoin has been correcting for the last two weeks capped off with a 4%+ decline in early trading today. After today’s drop, the pullback is close to 10%, and bitcoin is on pace to close below its 50-day moving average (DMA) for the first time in nearly two months.

A break below the 50-DMA is typically considered a bearish signal, but in bitcoin’s case, this type of pattern hasn’t been followed by a clear trend. During the parabolic runup from 2016 through 2017, any time bitcoin closed below its 50-day moving average after trading above it for at least 50 days it almost always immediately recovered to new highs. Beginning in 2018, though, bitcoin was slower to recover following these types of breaks. In three of the four periods since the start of 2018, prices experienced pretty sizable pullbacks at least in the short term, but they were still always followed by new highs. In dollar terms, last year’s pullback in bitcoin was unlike any other, but in percentage terms, it has been in this type of situation before. As bitcoin has ‘matured’ it has tended to follow more typical technical patterns versus the early days when all it did was win, so a pause in this year’s rally, at least in the short-term, wouldn’t be surprising.

Our Morning Lineup keeps readers on top of earnings data, economic news, global headlines, and market internals. We’re biased (of course!), but we think it’s the best and most helpful pre-market report in existence!
Start a two-week trial to Bespoke Premium to read today’s full Morning Lineup.
The Bespoke 50 Growth Stocks — 3/2/23
The “Bespoke 50” is a basket of noteworthy growth stocks in the Russell 3,000. To make the list, a stock must have strong earnings growth prospects along with an attractive price chart based on Bespoke’s analysis. The Bespoke 50 is updated weekly on Thursday unless otherwise noted. There were three changes to the list this week.
The Bespoke 50 is available with a Bespoke Premium subscription or a Bespoke Institutional subscription. You can learn more about our subscription offerings at our Membership Options page, or simply start a two-week trial at our sign-up page.
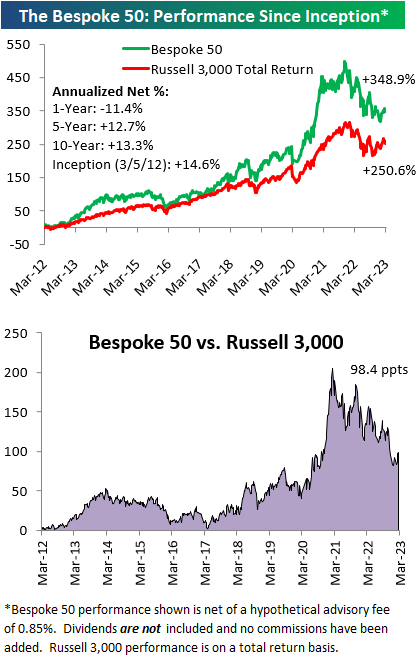
The Bespoke 50 performance chart shown does not represent actual investment results. The Bespoke 50 is updated weekly on Thursday. Performance is based on equally weighting each of the 50 stocks (2% each) and is calculated using each stock’s opening price as of Friday morning each week. Entry prices and exit prices used for stocks that are added or removed from the Bespoke 50 are based on Friday’s opening price. Any potential commissions, brokerage fees, or dividends are not included in the Bespoke 50 performance calculation, but the performance shown is net of a hypothetical annual advisory fee of 0.85%. Performance tracking for the Bespoke 50 and the Russell 3,000 total return index begins on March 5th, 2012 when the Bespoke 50 was first published. Past performance is not a guarantee of future results. The Bespoke 50 is meant to be an idea generator for investors and not a recommendation to buy or sell any specific securities. It is not personalized advice because it in no way takes into account an investor’s individual needs. As always, investors should conduct their own research when buying or selling individual securities. Click here to read our full disclosure on hypothetical performance tracking. Bespoke representatives or wealth management clients may have positions in securities discussed or mentioned in its published content.
Sentiment Back to Bearish
The consistency of declines throughout February and to start the month of March has sent sentiment decisively lower. The latest data from the American Association of Individual Investors (AAII) showed 23.4% of respondents reported as bullish, up modestly from 21.6% last week but still down significantly from 34.1% two weeks ago. With less than a quarter of respondents reporting as bullish, bullish sentiment continues to sit firmly below its historical average of 37.5% for a record 67 straight weeks.

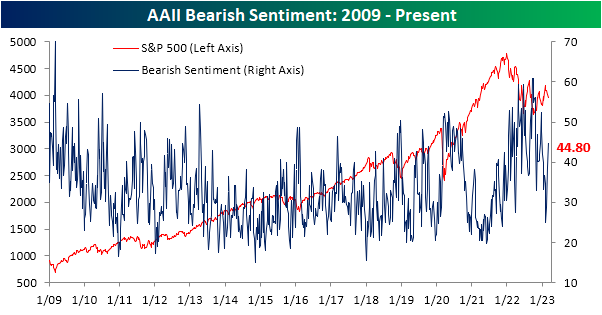
Meanwhile, bearish sentiment has continued to grind higher reaching 44.8% after three straight weeks of increases and hitting the highest level of the short year so far.
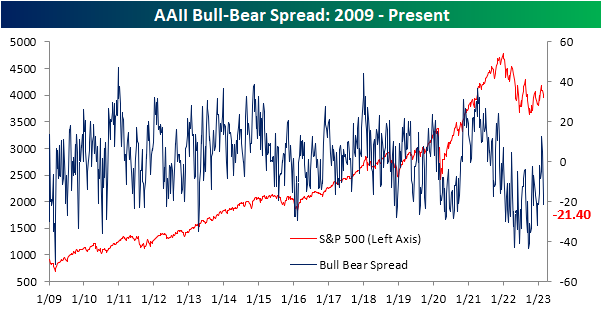
At the start of February, the bull-bear spread ended its record streak of negative readings as bulls finally outnumbered bears. The surge in pessimism in the past couple of weeks, though, has resulted in more negative bull-bear readings.
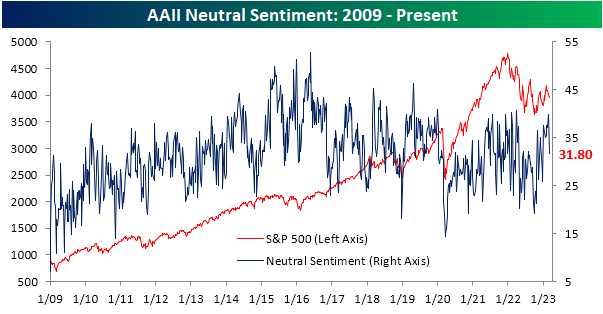
In addition to sentiment taking a more bearish tone, far fewer respondents are reporting neutral sentiment. After the highest reading in nearly a year last week, only 31.8% couldn’t make up their mind this week. That eight percentage point drop from last week was the largest weekly decline since November.
In addition to the AAII survey, other weekly sentiment readings have likewise made a quick reversal back towards negative sentiment. Combining the readings of the AAII survey with the Investors Intelligence survey and the NAAIM Exposure Index, sentiment has gone from the most cheery outlook in over a year down to pessimism right in line with the rest of the past year. In fact, the 1.36 point decline since the high three weeks ago ranks as the seventh largest decline in such a span since the composite begins in 2006.
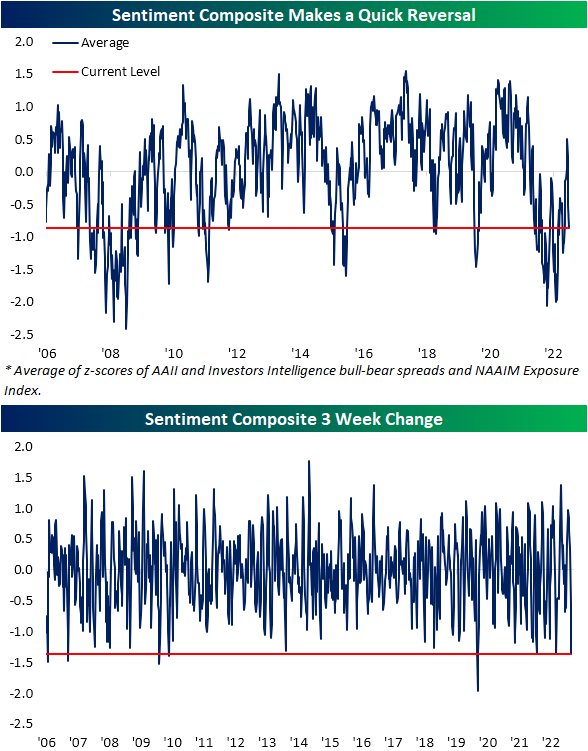
Since sentiment is a contrarian indicator, the sharp bearish turn across these sentiment indicators ‘should’ be a signal for positive forward performance. However, that has not exactly been the case historically. In the table below, we show each prior week that the index has fallen at least 1.25 points without having done so in the prior three months. Of the dozen prior instances, performance has been mixed going forward. Click here to learn more about Bespoke’s premium stock market research service.

Home Prices Falling Fast
Updated data on home prices across the country came out earlier this week when the newest monthly S&P CoreLogic Case Shiller indices were published. This data is lagged by two months, but it gives us a look at where home prices ended the year in 2022.
Below is a table highlighting the month-over-month (m/m) and year-over-year (y/y) percentage change in home prices across the 20 cities tracked by Case Shiller. It also includes the national and composite 10-city and 20-city readings.
Home prices fell sharply from November 2022 to December 2022, with the national index down 0.81% and 11 of 20 cities down more than 1% sequentially. New York and Miami saw the smallest m/m declines with drops of less than 0.3%.
Looking at y/y price changes, while the national index still showed an increase of 5.76% from December 2021 to December 2022, two cities have now seen prices dip into the red on a y/y basis. Seattle home prices fell 1.78% for the full year 2022, while San Francisco prices fell even more at -4.19%. Given the unrelenting pullback in prices over the last six months, we’ll see more and more cities dip into the red on a y/y basis over the next few months.

Where home price trends get interesting is looking at the post-COVID action. In the aftermath of lockdowns, government stimulus, and the shift to “work from home” in many parts of the labor force, home prices across the country absolutely soared. By mid-2022, the national home price index was up 45% from the level it was at in February 2020 just before COVID hit. Areas on the West Coast and in the Southeast saw prices rise even more, with many cities seeing gains of more than 60% at their peaks.
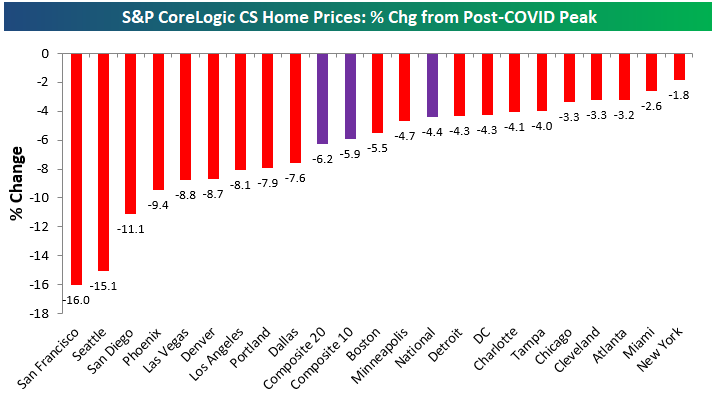
Prices finally peaked last summer, however, as rate hikes by the inflation-fighting Fed quickly pushed mortgage rates to levels not seen in decades. Below is a chart showing how much home prices have fallen from their post-COVID peaks seen in mid-2022. The composite indices are only down 4-6% from their highs, but we’ve seen prices really take a hit out west with cities like San Diego, Seattle, and San Francisco already down double-digit percentage points.
Given the pullbacks in home prices over the past six+ months, below is a look at where prices currently stand relative to their pre-COVID levels at the end of February 2020. Notably, San Francisco — which has seen prices fall the most from their highs — is currently up the least since COVID hit with a gain of 23%. Other cities where home prices are up less post-COVID than the national indices include Minneapolis, DC, Chicago, and Portland. Where home prices are still up the most is in Florida as prices in Tampa and Miami are still up 60% or more. Click here to learn more about Bespoke’s daily premium service.

Another Week Below 200K For Claims
Initial jobless claims continue to impress with this week’s reading being the seventh week in a row of sub-200K prints. Falling another 2K week over week to 190K, adjusted claims are now at the lowest level since the last week of January.

While the seasonally adjusted number is low, before taking that into account claims have actually yet to drop below 200K. Claims are falling as is normal for this point of the year with the past couple of weeks historically being some of the most consistent to experience week-over-week declines on a historical basis. At current levels, claims are comparable to the equivalent week of the year from the past several years excluding 2021.

As for continuing claims, the past couple of weeks have seen the readings begin to pivot lower after rising to the highest level of the year at the start of February. Continuing claims totaled 1.655 million which is the lowest level since the week of 1/21. Albeit claims remain off their best levels of the pandemic (for both initial and continuing claims), they remain healthy headed into next week’s nonfarm payrolls release. Click here to learn more about Bespoke’s premium stock market research service.

Bespoke’s Morning Lineup – 3/2/23 – Leveling Off
See what’s driving market performance around the world in today’s Morning Lineup. Bespoke’s Morning Lineup is the best way to start your trading day. Read it now by starting a two-week trial to Bespoke Premium. CLICK HERE to learn more and start your trial.
“It is amazing how many drivers, even at the Formula One Level, think that the brakes are for slowing the car down.” – Mario Andretti
Below is a snippet of content from today’s Morning Lineup for Bespoke Premium members. Start a two-week trial to Bespoke Premium now to access the full report.
If you’re looking at the positive Dow futures this morning, you’re getting a misleading picture of the setup heading into the trading day. That’s because a 15%+ rally in salesforce (CRM) is responsible for about 100 points of the rally. Without CRM, the Dow would also be poised to open lower. Both the S&P 500 and Nasdaq are trading lower with Tesla (TSLA) acting as a bigger drag on the Nasdaq.
Stocks have been in a bit of a rut ever since the Presidents Day weekend as the S&P 500 has declined over 3% and closed lower than its opening print on all seven trading days. In total now, we’ve seen a pullback of just over 5% since the recent peak in early February. Today, the focus of investors will be on Non-Farm Productivity, Unit Labor Costs, and jobless claims all at 8:30.
The year is only two months old, but already some of the typical seasonal trends in the economy seem to be bucking the trend. Whether it was due to the weather, seasonal adjustments, or just underlying strength, economic data surprised to the upside after a December that was mostly weaker than expected.
One area where the pattern has been the opposite of the seasonal norms at this point in the year is gasoline prices. While national average prices, as tracked by AAA, typically only see marginal gains in the month of January, this year prices surged more than 9%, which ultimately translated to higher levels of inflation. In February, though, we saw much of the increase in prices from January reverse itself, and prices finished the month down more than 4% for the largest February decline since 2006. As a result of that pullback, the national average price, which was up way more than normal YTD at the end of January, is now actually up slightly less YTD this year than in an ‘average’ year. While gas prices were an accelerant for inflation in January, they’re likely to be a damper on it in February.

Our Morning Lineup keeps readers on top of earnings data, economic news, global headlines, and market internals. We’re biased (of course!), but we think it’s the best and most helpful pre-market report in existence!
Start a two-week trial to Bespoke Premium to read today’s full Morning Lineup.