The Triple Play Report — 5/9/23
An earnings triple play is a stock that reports earnings and manages to 1) beat analyst EPS estimates, 2) beat analyst sales estimates, and 3) raise forward guidance. You can read more about “triple plays” at Investopedia.com where they’ve given Bespoke credit for popularizing the term. We like triple plays as an indication that a company’s business is firing on all cylinders, with above-expectations results and an improving outlook. A triple play is indicative of positive “fundamental momentum” instead of pure fundamentals, and there are always plenty of names with both high and low valuations on our quarterly list.
Bespoke’s Triple Play Report highlights companies that have recently reported earnings triple plays, and it features commentary from management on triple-play conference calls, company descriptions and analysis, and price charts. Bespoke’s Triple Play Report is available at the Bespoke Institutional level only. You can sign up for Bespoke Institutional now and receive a 14-day trial to read this week’s Triple Play Report, which features seven stocks. To sign up, choose either the monthly or annual checkout link below:
Bespoke Institutional – Monthly Payment Plan
Bespoke Institutional – Annual Payment Plan

One of the sixteen triple plays featured in our newest report is Manhattan Associates (MANH). MANH has definitely been one of the most consistent reporter of triple plays over the last few years, and its share price is now just 8% below its late 2021 all-time highs after rallying just over 50% from its lows last November.

Manhattan Associates provides software solutions and services to help businesses optimize their supply chain, inventory, and omnichannel operations. Their products include tools for warehouse management, transportation management, order management, and customer engagement, among others. This name has tailwinds as both an infrastructure and an “automation” play. As shown below in the snapshot for MANH in our Earnings Explorer, revenues have re-accelerated to new highs in the last couple of years, even through last year’s bear market for stocks.
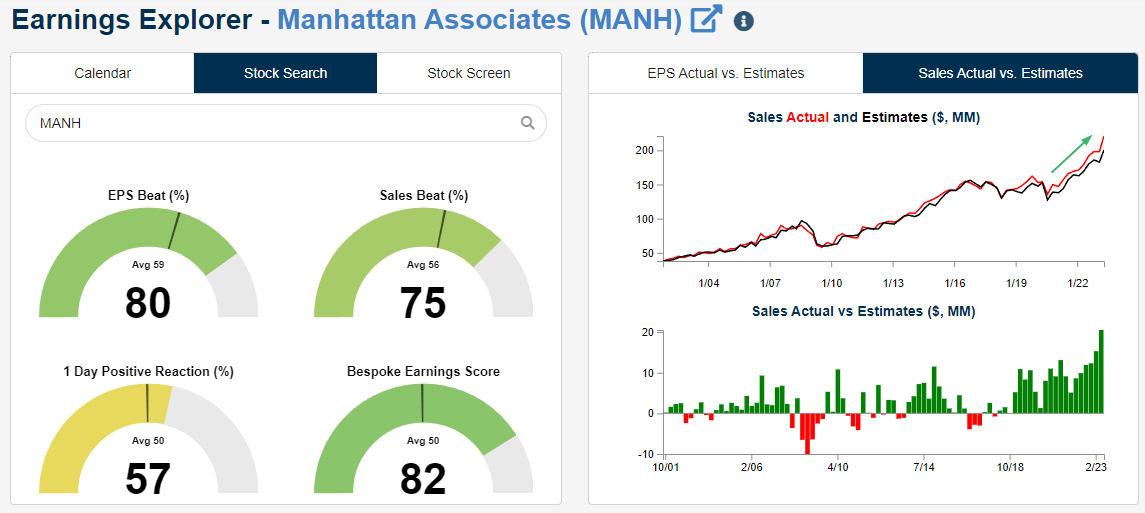
In terms of triple plays, MANH has now reported five in a row and 11 in its last 17 earnings reports, with EPS and revenue beats 17 quarters in a row as well.

For a full analysis of all 16 Tech-sector triple plays featured in this report, simply sign up for a Bespoke Institutional trial today and then read on!
Bespoke Investment Group, LLC believes all information contained in these reports to be accurate, but we do not guarantee its accuracy. None of the information in these reports or any opinions expressed constitutes a solicitation of the purchase or sale of any securities or commodities. This is not personalized advice. Investors should do their own research and/or work with an investment professional when making portfolio decisions. As always, past performance of any investment is not a guarantee of future results. Bespoke representatives or clients may have positions in securities discussed or mentioned in its published content.
Megacaps Still Carrying Their Weight
Heading into earnings season, there was a considerable amount of angst on the part of investors regarding the mecacap stocks and how they would react to their earnings reports. Given their outperformance in Q1, the prevailing view was that the bar was too high, leaving the megacaps susceptible to disappointment when they reported. Within the S&P 500, there are seven companies whose weighting exceeds 1.5% in the index, and in the chart below we list the performance of each company’s stock (largest to smallest) on the earnings reaction day of their most recent report. Of the seven companies highlighted, only two (Alphabet and Amazon.com) declined in reaction to their reports. Two stocks (Nvidia and Meta) surged more than 10%, one (Microsoft) rallied more than 7%, and Apple, with its weighting of over 7%, managed to rise more than 4.5% following its report last week. There’s still a ton of reports left to get through before earnings season winds down, but on a market cap basis, we’re past the peak, and based on the reactions of the largest companies in the market, it’s been a much better earnings season than most investors expected.

Have you tried Bespoke All Access yet?
Bespoke’s All Access research package is quick-hitting, actionable, and easily digestible. Bespoke’s unique data points and analysis help investors better visualize underlying market trends to ultimately make more informed investment decisions.
Our daily research consists of a pre-market note, a post-market note, and our Chart of the Day. These three daily reports are supplemented with additional research pieces covering ETFs and asset allocation trends, global macro analysis, earnings and conference call analysis, market breadth and internals, economic indicator databases, growth and dividend income stock baskets, and unique interactive trading tools.
Click here to sign up for a one-month trial to Bespoke All Access, or you can read even more about Bespoke All Access here.

Bespoke’s Morning Lineup – 5/8/23 – Candy Apple
See what’s driving market performance around the world in today’s Morning Lineup. Bespoke’s Morning Lineup is the best way to start your trading day. Read it now by starting a two-week trial to Bespoke Premium. CLICK HERE to learn more and start your trial.
“If you know the edge of your own ability pretty well, you should ignore most of the notions of our experts about what I call ‘deworsification’ of portfolios.” – Charlie Munger

Below is a snippet of content from today’s Morning Lineup for Bespoke Premium members. Start a two-week trial to Bespoke Premium now to access the full report.
While the S&P 500 was still down for the week, last Friday’s rally did a lot to boost sentiment as it turned a hole of over 2.5% to a weekly decline of less than 1%. For its part, the Nasdaq actually managed to finish the week marginally higher. This morning, the week is starting off on a relatively quiet but positive note as the economic calendar is light, and the pace of earnings slow. Thankfully, there wasn’t even any stress in the banking sector to have to contend with! Looking ahead, though, earnings activity will pick up after the close, and even though the mega-caps are behind us, we’re still in the peak reporting period, so the number of reports won’t slow down. Then, on Wednesday, the April CPI will likely be the major report of the week, and that will likely dictate how we finish the week.
Over the weekend at the annual Berkshire Hathaway shareholders meeting, Warren Buffett referred to Apple (AAPL) as a better business ‘than any we own’. Apple has worked out better than See’s Peanut Brittle for Berkshire shareholders. The chart below shows the quarterly performance of Berkshire Hathaway (BRK/b) over the last 20 years. From 2003 through the end of 2015, before Berkshire started acquiring Apple, the stock’s average quarterly return was a gain of 2.3%. Since 2016, when Buffett first took a bite out of Apple, Berkshire’s average quarterly gain has been more than a full percentage point higher at 3.4%.
Now, to say that the higher average quarterly return is due entirely to Apple would be too simplistic. After all, S&P 500 returns are higher in the post-2016 period (+2.8%) compared to the period from 2003 through the end of 2015 (+2.3%) but given AAPL’s outperformance of the overall market since the start of 2016 (144%) it certainly hasn’t hurt Berkshire, and the stock would almost certainly be lower now had Buffett not placed the bet on Tim Cook.

Not surprisingly, as Apple has become a much larger part of Berkshire, the stock has tended to trade more in line with Apple as well. The chart below shows the rolling 200-day correlation between the daily percentage changes of Apple and Berkshire over the last 20 years. From 2003 through the end of 2015, the average rolling correlation between the two was +0.256. Since Berkshire started acquiring Apple, even though the correlation immediately dipped in early 2016, the overall average correlation has been considerably higher at +0.453.

Start a two-week trial to Bespoke Premium to read today’s full Morning Lineup.
Bespoke Brunch Reads: 5/7/23
Welcome to Bespoke Brunch Reads — a linkfest of the favorite things we read over the past week. The links are mostly market related, but there are some other interesting subjects covered as well. We hope you enjoy the food for thought as a supplement to the research we provide you during the week.
While you’re here, join Bespoke Premium with a 30-day trial!
Hedge Funds
Big Hedge Funds Face New 72-Hour Deadline to Report Losses by Lydia Beyoud (Bloomberg)
A new SEC rule requires large hedge funds to share news of major losses and margin calls with regulators within 72 hours of realizing declines. That would significantly speed disclosure . [Link; soft paywall]
So You Want to Launch a Hedge Fund? by Marc Rubinstein (Net Interest)
A review of the history of the hedge fund industry as well as an outlook on the performance of the industry going forward given a very poor run of performance for leveraged private stock pickers. [Link]
Baseball
Why Did the Umpire Quit Little League? Nasty Parents by Jason Gay (WSJ)
When a small town New Jersey baseball league got tired of poor behavior from parents during games, organizers developed an interesting punishment system for hecklers: time behind the diamond. [Link; paywall]
Alabama baseball coach Brad Bohannon fired after link to suspicious bets, sources say by David Purdum (ESPN)
Video evidence from a sportsbook in Ohio showed a person placing bets against Alabama’s baseball team at the direction of that team’s coach. An independent monitoring firm identified the bets before further investigation. [Link]
Sports Business
FC Barcelona to Pay €94 Million a Year for Debt to Renew Stadium by Irene Garcia Perez (Bloomberg)
A remarkable debt deal will see the iconic Spanish football club pass enormous risk to private investors, who have loaned almost €1.5bn with no recourse to team general revenues. [Link; soft paywall]
The Audience for Women’s Sports Is Surging. Richer Media Deals Could Follow. by Rachel Bachman (WSJ)
From basketball to soccer, women’s sports from college to the pros to international competition have broadcast rights up for sale in coming years, and with viewership surging those contracts could be lucrative indeed. [Link; paywall]
Social Media
Social Media as a Bank Run Catalyst by J. Anthony Cookson, Corbin Fox, Javier Gil-Bazo, Juan Felipe Imbet, and Christoph Schiller (SSRN)
The authors find social media amplifies the risk of bank runs, with banks under deposit stress leading to larger losses when they’re discussed on Twitter, and especially so when discussed by key communities. [Link]
Bluesky’s best shot at success is to embrace shitposting by Amada Silberling (TechCrunch)
The latest social media site aiming to take advantage of challenges at Twitter made a key decision early that has driven lots of activity: inviting users who are ready to stir the pot and post like they’re not going to be able to post for long. [Link]
Tweet Tweet
SEC Issues Largest-Ever Whistleblower Award (SEC)
An anonymous whistleblower received a massive $279mm payout after coming forward with accurate information about potential securities law violations. [Link]
Commercial Real Estate
European commercial real estate dealmaking falls to 11-year low by Joshua Oliver (FT)
Commercial real estate transactions were down 62% YoY in Q1, with high rates stifling both supply and demand of properties; it may take some time before distressed sales start to pick up. [Link; paywall]
After demolishing swaths of San Jose, Google puts campus project on hold by Ron Amadeo (Ars Technica)
Google had planned to build an 80-acre campus in downtown San Jose. But cost cutting imperatives intervened and put the project on ice after demolition had already started. [Link]
Apple
Apple reportedly attracted $1 billion in deposits into its new high-yield savings account in just 4 days by Matthew Fox (Business Insider)
Apple credit card customers are eligible for a 4.15% high yield savings account from Goldman Sachs offered with Apple branding. Results have been good so far with 240k new customers in the first four days of launch. [Link]
Apple CEO Sees India at ‘Tipping Point’ as China Pivot Quickens by Mark Gurman (Bloomberg)
With Chinese supply chains threatened by geopolitics and saturation, India has become a major focus for the $2trn company. [Link; auto-playing video, soft paywall]
Environmentalism
FAA sued over SpaceX Starship launch program following April explosion by Lora Kolodny (CNBC)
A series of nonprofits have sued SpaceX after its Starship launch sent tons of concrete from the inadequately designed launch pad flying into sensitive and protected habitat surrounding the launch site. [Link]
The Politics of Carbon Capture Are Getting Weird by Emily Pontecorvo (Heatmap)
Before the Supreme Court ruled that EPA regulation of carbon had to take place at the emission site, carbon capture was viewed by environmentalists as something of a snake oil pitch. But that’s all changed as the EPA’s clean power plan rulemaking due next week is likely to show. [Link]
Libations
Where Has All the Chartreuse Gone? by Jason Wilson (Everyday Drinking)
Carthusian monks have made the decision to maintain production volumes of famed green and yellow liqueur Chartreuse, meaning availability may start to decline as demand outpaces the willingness of its silent producers to make millions of cases. [Link]
Technology
Can China’s booming EV industry help it avoid the middle-income trap? By Anthony W.D. Anastasi (South China Morning Post)
Emerging market economies often fail to make the leap from rapid growth to developed market income levels; EVs may be one of the keys to continuing China’s growth out of the middle income trap. [Link]
Labor Markets
Low earners in the US enjoy fastest wage growth (FT)
Real incomes have soared for the bottom 10% of earners over the decade, while those at the median have seen more modest growth largely thanks to post-COVID inflation. Real earnings take home the same per hour that they did from 2016-2020. [Link; paywall]
White-Collar Layoffs are Starting to Show Up in the Household Survey by Preston Mui (Employ America)
A detailed look at the details of several government reports on the labor market shows that layoffs announced over the past year are starting to show up, albeit only modestly so far. [Link]
Policing
More people are getting away with murder. Unsolved killings reach a record high by Eric Westervelt (NPR)
The national murder clearance rate fell below 50% in 2020, a record low dating back as far as records are kept. The number is as low as one-third of murders in some cities. [Link]
Read Bespoke’s most actionable market research by joining Bespoke Premium today! Get started here.
Have a great weekend!
The Bespoke Report — 5/5/23 — The Worst Is Over
This week’s Bespoke Report newsletter is now available for members. (Log in here if you’re already a subscriber.)
Don’t be confused by panicked price action in regional banks: the deposit crisis is subsiding. One example can be found in the reduced balances for emergency lending programs at the Fed. Those have fallen by $100bn since the March 22nd peak, a sign that stress is abating, and after the failure of FRC in the latest weekly data, 74% of the balances are now loans to the FDIC rather than funding for banks that have yet to fail.
Data on bank balance sheets tells the same story. Domestically chartered banks saw deposits up WoW by a total of $21bn. What’s even more encouraging is core loan growth. Total lending across consumer, commercial & industrial, and real estate loans rose by $29.4bn in the week of April 26th. That’s a major acceleration and was led by smaller banks in a sign that the liquidity stress of deposit swings are hitting credit creation less than feared.
Of course, that doesn’t change the fact that the KBW Regional Bank index was down 8% this week…and that’s after a 4.7% rally on Friday. For their part, large cap stocks suffered through four straight losses before a 1.9% surge in response to strong payrolls data Friday. This marks the fifth-straight week that the S&P 500 has reversed direction from the prior week. Of course, banks weren’t the only reversal: front-month WTI collapsed 7.3% in thin liquidity around dinner time Thursday night before a sharp 12% rally from that low through the close on Friday. Add in the Fed, which has raised the bar for further hikes, and we have what looks like three different storms passing this week and clearing the skies for stocks.
Continue reading this week’s Bespoke Report newsletter by starting a one-month trial, or click the image below to view our membership options page.

Seasonal Mid Point
Today marks the midpoint of spring, so from here on, we can say that we’re closer to summer than winter. Summer isn’t typically thought of as a positive time for equities, but as highlighted in the “Seasonality” section of our Morning Lineup today, the next three months, which is the period straddling the back half of spring and the first half of summer, has been relatively strong in the last ten years. The table and charts below summarize the performance of the S&P 500 ETF (SPY) and each sector-tracking ETF from the close on May 5th through August 5th. The S&P 500’s median performance during this period over the last ten years has been a gain of 5% with positive returns 90% of the time. Leading the way higher, Health Care (XLV), Real Estate (XLRE), and Technology (XLK) have all experienced median gains of over 5% with positive returns 85% of the time or more. In addition to XLV and XLK, Consumer Discretionary (XLY) and Consumer Staples (XLP) have also been up during this period in nine of the last ten years. On the downside, the only sector that has had a negative return on a median basis has been Energy (XLE). Ironically, even last year when the sector outperformed the broader market by a significant degree, it not only declined (-8.3%), but it also underperformed the S&P 500 by a wide margin during this three-month stretch.
Looking at the last ten years, in every year since 2013, there have only been two years that the majority of sectors in the S&P 500 declined during this period (XLRE price data doesn’t begin until 2016 while XLC didn’t start trading until June 2018). Last year, six of eleven sectors traded lower even as the S&P 500 had a marginal gain, while in 2019, eight of eleven sectors declined as the S&P 500 fell 3%.

Have you tried Bespoke All Access yet?
Bespoke’s All Access research package is quick-hitting, actionable, and easily digestible. Bespoke’s unique data points and analysis help investors better visualize underlying market trends to ultimately make more informed investment decisions.
Our daily research consists of a pre-market note, a post-market note, and our Chart of the Day. These three daily reports are supplemented with additional research pieces covering ETFs and asset allocation trends, global macro analysis, earnings and conference call analysis, market breadth and internals, economic indicator databases, growth and dividend income stock baskets, and unique interactive trading tools.
Click here to sign up for a one-month trial to Bespoke All Access, or you can read even more about Bespoke All Access here.
Bespoke’s Morning Lineup – 5/5/23 – Unlucky Thirteen?
See what’s driving market performance around the world in today’s Morning Lineup. Bespoke’s Morning Lineup is the best way to start your trading day. Read it now by starting a two-week trial to Bespoke Premium. CLICK HERE to learn more and start your trial.
“Employment is nature’s physician and is essential to human happiness.” – Galen
Below is a snippet of content from today’s Morning Lineup for Bespoke Premium members. Start a two-week trial to Bespoke Premium now to access the full report.
You’ve likely seen a few headlines this morning discussing the ‘rebound’ and ‘surge’ in regional bank stocks led by shares of PacWest (PACW) which are trading up 26% in pre-market trading. Any staunching of the bleed in these stocks is welcome, but when PACW is only back to levels where it was trading at in the final hour of trading yesterday and still down over 60% on the week, it’s hard to call it a surge.
With bank stocks showing some stabilization, equity futures are taking the opportunity to rebound. European stocks are all firmly higher this morning, and that comes despite what has been mostly a round of weaker-than-expected economic data as European Retail Sales, German Factory Orders, and Industrial Production in France all came in significantly weaker than expected.
With the Fed on Wednesday and Apple (AAPL) earnings after the close yesterday, you may have forgotten about today’s April Non-Farm Payrolls, but those numbers were just released. Economists were expecting the total change in Non-Farm Payrolls to come in at 185K with the Unemployment Rate increasing to 3.6% from 3.5%. The actual readings came in stronger than expected with payrolls increasing by 253K and the Unemployment Rate falling to 3.4%. Average hourly earnings were also two-tenths stronger than expected at 0.5% m/m. One caveat to the stronger headline print, though, was that prior month readings were revised lower by about 150K.
The monthly payrolls report has been important because, in its quest to bring down inflation, the Federal Reserve has been on a mission to crush employment. Because of that, the chart below continues to give members of the committee nightmares. While other areas of the economy have clearly shown signs of rolling over, up until recently, employment has been humming along. Recently, we have started to see some signs of cooling as jobless claims (after a major revision) have been trending higher while JOLTS has been rolling over, but the Non-Farm Payrolls report has been another story. With this month’s stronger-than-expected print, we have now seen a record 13 straight months where the headline change in Non-Farm Payrolls was better than expected.

Start a two-week trial to Bespoke Premium to read today’s full Morning Lineup.
Bespoke’s Consumer Pulse Report — May 2023
Bespoke’s Consumer Pulse Report is an analysis of a huge consumer survey that we run each month. Our goal with this survey is to track trends across the economic and financial landscape in the US. Using the results from our proprietary monthly survey, we dissect and analyze all of the data and publish the Consumer Pulse Report, which we sell access to on a subscription basis. Sign up for a 30-day free trial to our Bespoke Consumer Pulse subscription service. With a trial, you’ll get coverage of consumer electronics, social media, streaming media, retail, autos, and much more. The report also has numerous proprietary US economic data points that are extremely timely and useful for investors.
We’ve just released our most recent monthly report to Pulse subscribers, and it’s definitely worth the read if you’re curious about the health of the consumer in the current market environment. Start a 30-day free trial for a full breakdown of all of our proprietary Pulse economic indicators.

Initial and Continuing Claims in Opposite Directions
The latest reading on initial jobless claims disappointed coming in at 242K versus expectations of 240K. That is up from last week’s downward revision to 229K. As shown in the inlaid chart below, claims have moved up to some of the highest levels in a over a year with the past several weeks marking relatively range bound readings. This week’s increase to 240K marks a move to the high end of that recent range.

Before seasonal adjustment, claims came in at 219K. That is roughly in line with the readings of the comparable week off the year for the past few years excluding 2020 and 2021 when claims were more elevated due to the pandemic. Claims are also generally following seasonal trends with the current week having consistently seen declines week over week historically. With that said, claims have yet to make a new low on the year.

Whereas initial claims were a slight disappointment, continuing claims surprised with an improvement this week. Rather than the increase to 1.865 million that was expected, they dropped all the way down to 1.805 million, the lowest reading in three weeks. Albeit improved in the near term, the uptrend in continuing claims remains in place as claims are around the highest levels since early 2022.

Have you tried Bespoke All Access yet?
Bespoke’s All Access research package is quick-hitting, actionable, and easily digestible. Bespoke’s unique data points and analysis help investors better visualize underlying market trends to ultimately make more informed investment decisions.
Our daily research consists of a pre-market note, a post-market note, and our Chart of the Day. These three daily reports are supplemented with additional research pieces covering ETFs and asset allocation trends, global macro analysis, earnings and conference call analysis, market breadth and internals, economic indicator databases, growth and dividend income stock baskets, and unique interactive trading tools.
Click here to sign up for a one-month trial to Bespoke All Access, or you can read even more about Bespoke All Access here.
Sentiment Slouches
The S&P 500 has firmly turned lower in the past few days and is nearing the lows from last Wednesday. In spite of that turn lower, bullish sentiment was unchanged at 24.1% per the latest AAII sentiment survey. Although less than a quarter of respondents reported as bullish, that reading is only in the middle of the past year’s range of readings as bullish sentiment has consistently been hard to come by.

With no change to bullish sentiment, all of the moves occurred for neutral and bearish sentiment. Neutral sentiment has declined for three weeks in a row, coming in at a six week low of 31% this week.

All of those declines to neutral sentiment were picked up by bears as that reading rose 6.4 percentage points to 44.9%. That is the highest reading since the end of March and right in line with the average reading of bearish sentiment since the beginning of 2022.

With bearish sentiment moving higher, the bull-bear spread moved more firmly into negative territory. This week, bears outnumbered bulls by 20.8 percentage points; the widest spread in five weeks. That indicates the predominant share of respondents continue to expect the S&P 500 to head lower over the next six months.

That negative outlook by individual investors is nothing new. Following the record streak of 44 straight weeks of a negative bull-bear spread that ended in February, the spread has resumed another lengthy streak of negative readings. This week marked the eleventh straight negative reading in the bull-bear spread. Even in the more recent context of the aforementioned record streak and another double-digit streak in the first quarter of last year, the AAII survey has seldom seen bears outnumber bulls on such a consistent basis.

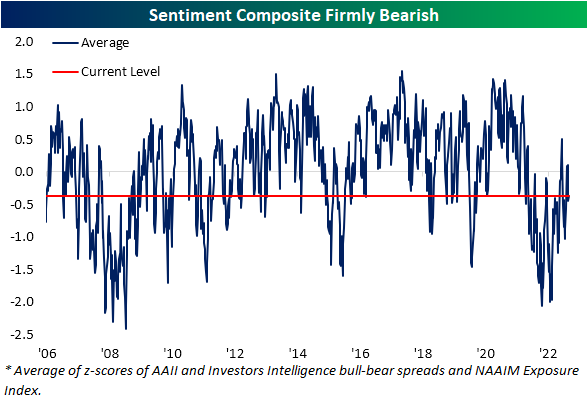
Factoring in other sentiment surveys like those from Investors Intelligence and NAAIM reaffirms the bearish tones of sentiment. With all three surveys combined, our sentiment composite remains firmly negative meaning sentiment is more bearish than average. We would also note that due to the timing of the collection of these surveys, they would have mostly missed any reaction to the FOMC’s rate decision and market response yesterday. As such, next week’s surveys will be the first to fully reflect the latest 25 bps hike and subsequent market declines.
Have you tried Bespoke All Access yet?
Bespoke’s All Access research package is quick-hitting, actionable, and easily digestible. Bespoke’s unique data points and analysis help investors better visualize underlying market trends to ultimately make more informed investment decisions.
Our daily research consists of a pre-market note, a post-market note, and our Chart of the Day. These three daily reports are supplemented with additional research pieces covering ETFs and asset allocation trends, global macro analysis, earnings and conference call analysis, market breadth and internals, economic indicator databases, growth and dividend income stock baskets, and unique interactive trading tools.
Click here to sign up for a one-month trial to Bespoke All Access, or you can read even more about Bespoke All Access here.