Mar 23, 2018
Each weekend as part of our Bespoke Premium and Institutional research service, clients receive our S&P 500 Quick-View Chart Book, which includes one-year price charts of every stock in the S&P 500. You can literally scan through this report in a matter of minutes or hours, but either way, you will come out ahead knowing which stocks, or groups of stocks, are leading and lagging the market. The report is a great resource for both traders and investors alike. Below we show the front page of this week’s report which contains price charts of the major averages and ten major sectors.
It was an extremely poor finish to an already poor week for US equities. While none of the major indices or sectors traded to 52-week lows, if you thumb through our chart book, the number of new lows is starting to add up with 22 this week, and 200-DMAs are being breached to the downside left and right. Consumer Discretionary Amazon, Financials, and Technology had been the stalwarts, but even they started to crack this week. To view our entire S&P 500 Chart Book, sign up for a 14-day free trial to our Bespoke Premium research service.

Mar 9, 2018
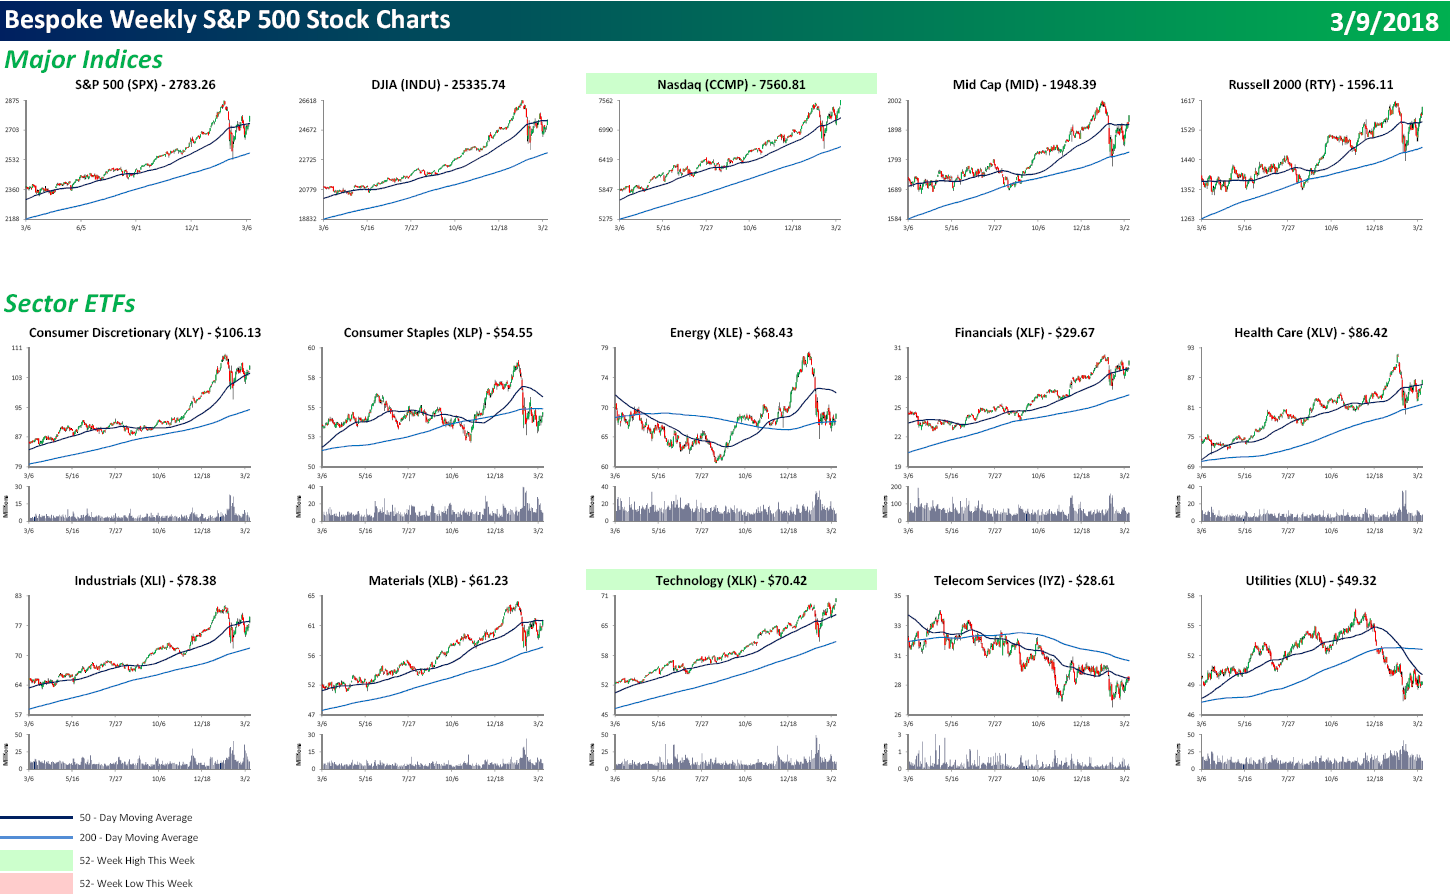
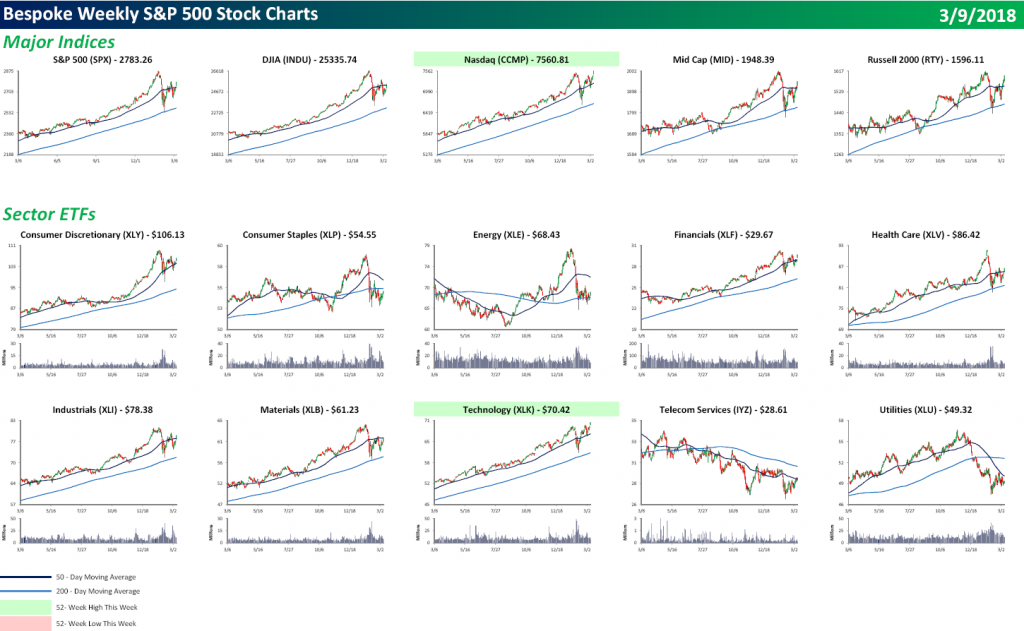
Each weekend as part of our Bespoke Premium and Institutional research service, clients receive our S&P 500 Quick-View Chart Book, which includes one-year price charts of every stock in the S&P 500. You can literally scan through this report in a matter of minutes or hours, but either way, you will come out ahead knowing which stocks, or groups of stocks, are leading and lagging the market. The report is a great resource for both traders and investors alike. Below we show the front page of this week’s report which contains price charts of the major averages and ten major sectors.
It was a strong finish to the week for US equities as all of the major averages finished at their highs of the day. The S&P 500 marginally took out its late February high, and believe it or not, the Nasdaq made a new all-time high. Of the ten major sectors shown, only Technology made a new high. Hmmm. The Nasdaq and Technology making new highs all by themselves? Sounds like the late 1990s. To view our entire S&P 500 Chart Book, sign up for a 14-day free trial to our Bespoke Premium research service.
Feb 23, 2018
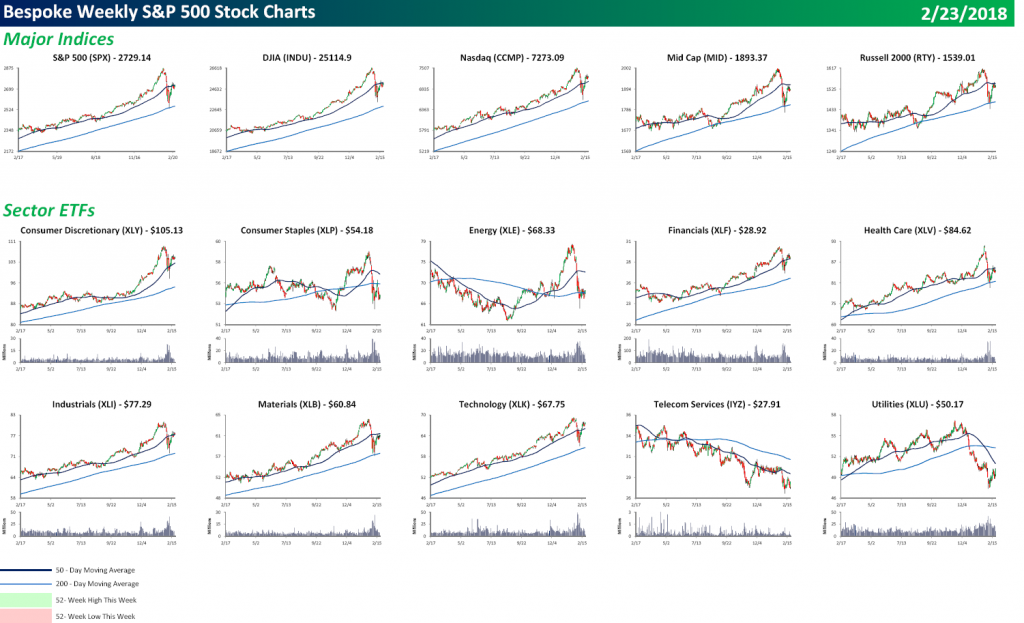
Each weekend as part of our Bespoke Premium and Institutional research service, clients receive our S&P 500 Quick-View Chart Book, which includes one-year price charts of every stock in the S&P 500. You can literally scan through this report in a matter of minutes or hours, but either way, you will come out ahead knowing which stocks, or groups of stocks, are leading and lagging the market. The report is a great resource for both traders and investors alike. Below we show the front page of this week’s report which contains price charts of the major averages and ten major sectors.
For each of the major averages, it’s been a week of consolidation as in most cases, the big rebound off the early February lows has stalled out right around the 50-day moving averages. With the major averages stuck in the middle of a no-man’s land, the number of 52-week highs and lows has declined. As shown below, not a single major index or sector hit a high or a low this week, and in terms of individual stocks, there were just 39 new highs and 13 new lows.
To view our entire S&P 500 Chart Book, sign up for a 14-day free trial to our Bespoke Premium research service.
Feb 16, 2018
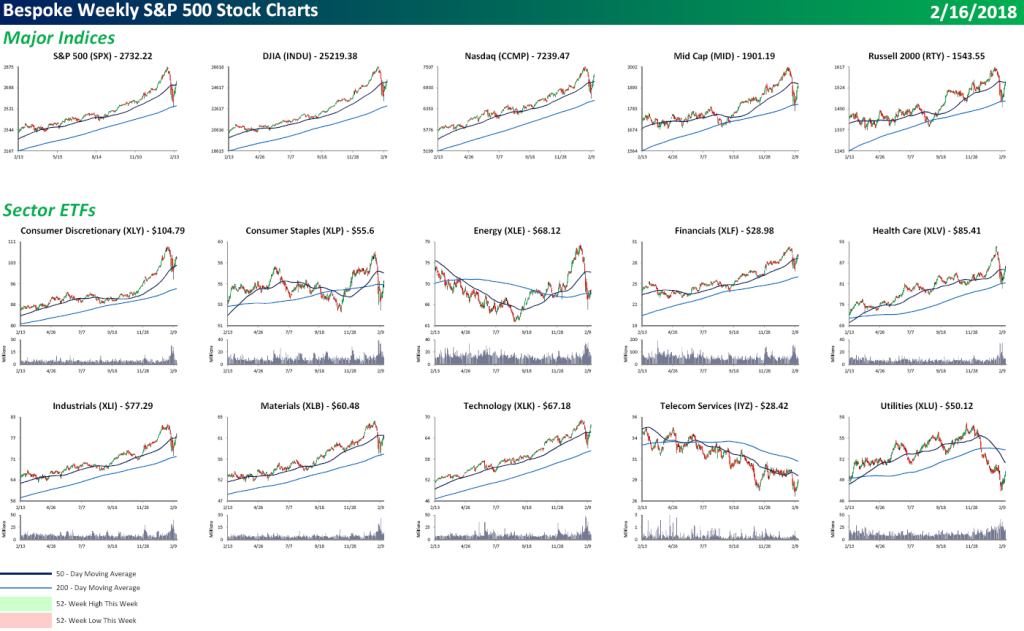
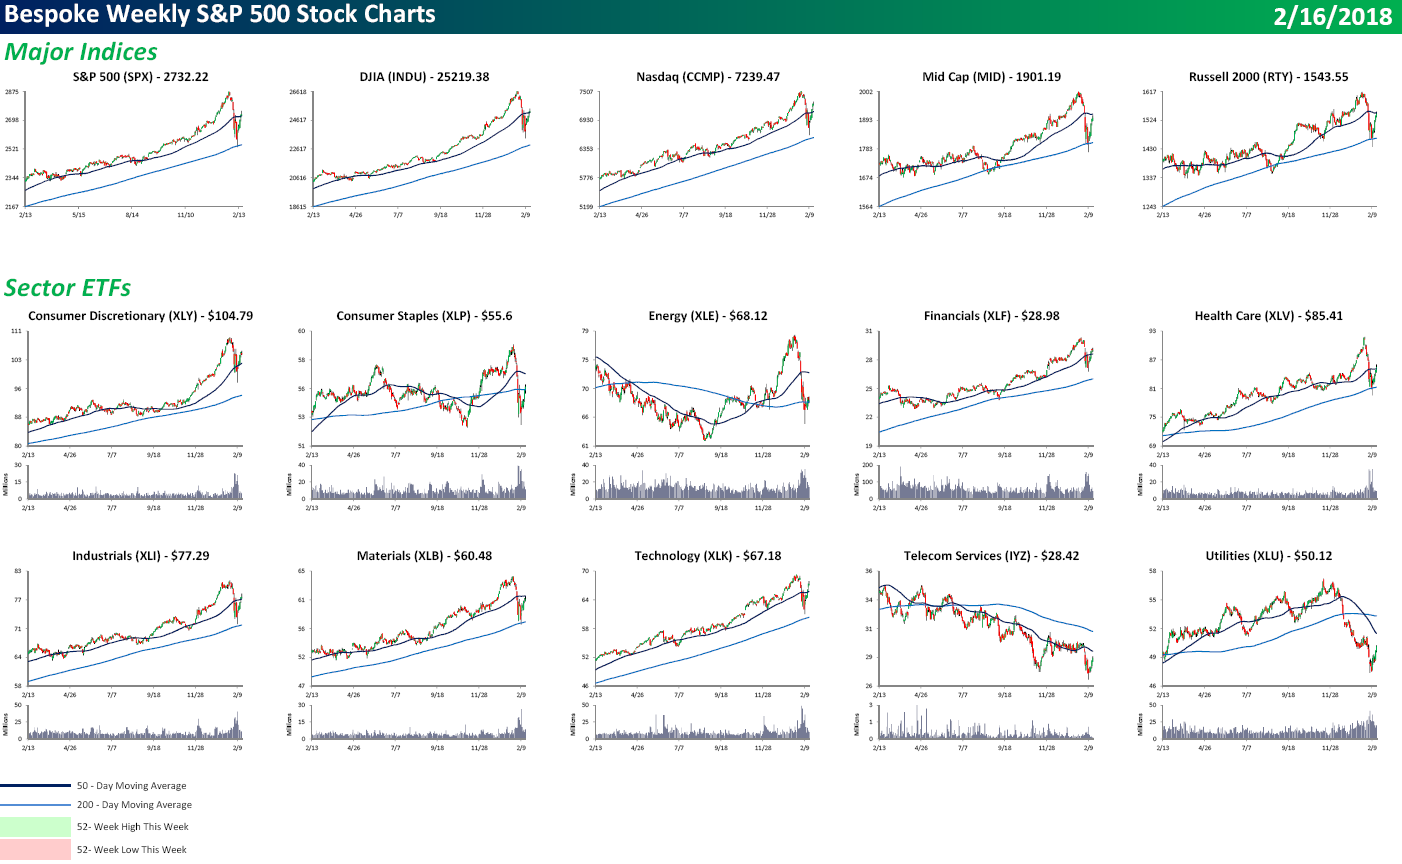
Each weekend as part of our Bespoke Premium and Institutional research service, clients receive our S&P 500 Quick-View Chart Book, which includes one-year price charts of every stock in the S&P 500. You can literally scan through this report in a matter of minutes or hours, but either way, you will come out ahead knowing which stocks, or groups of stocks, are leading and lagging the market. The report is a great resource for both traders and investors alike. Below we show the front page of this week’s report which contains price charts of the major averages and ten major sectors.
Because of the big decline off the January highs, even though most US equities surged this week, there weren’t a whole lot of 52-week highs or lows. What you will see throughout the chart book, however, is a bunch of v-looking formations. Hopefully, they don’t turn in to Ws! Once sector that has seen little in the way of a bounce off the lows is Energy. On a closing basis, the sector is up less than 2% from its recent low.
To view our entire S&P 500 Chart Book, sign up for a 14-day free trial to our Bespoke Premium research service.