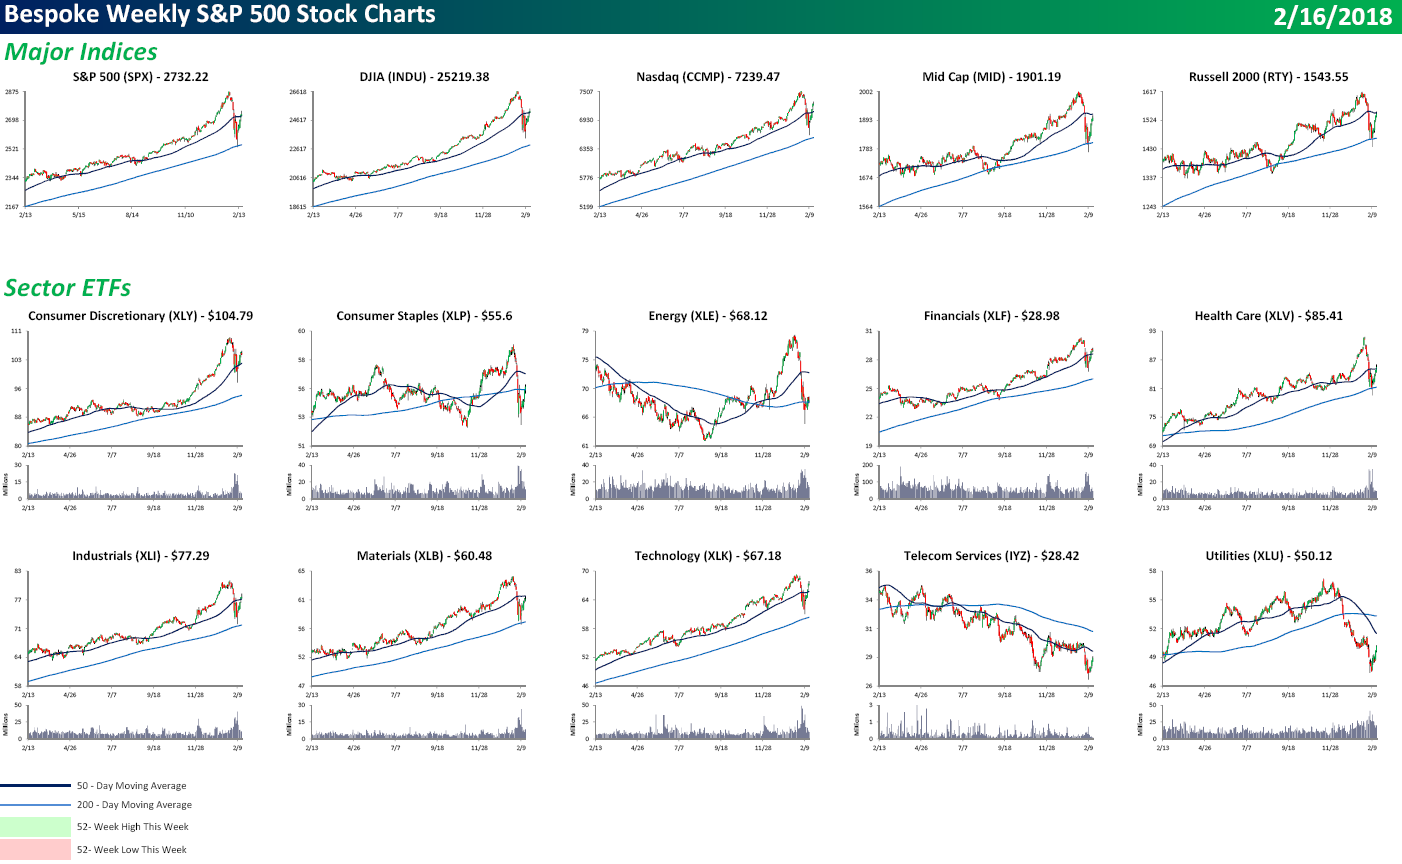
Each weekend as part of our Bespoke Premium and Institutional research service, clients receive our S&P 500 Quick-View Chart Book, which includes one-year price charts of every stock in the S&P 500. You can literally scan through this report in a matter of minutes or hours, but either way, you will come out ahead knowing which stocks, or groups of stocks, are leading and lagging the market. The report is a great resource for both traders and investors alike. Below we show the front page of this week’s report which contains price charts of the major averages and ten major sectors.
Because of the big decline off the January highs, even though most US equities surged this week, there weren’t a whole lot of 52-week highs or lows. What you will see throughout the chart book, however, is a bunch of v-looking formations. Hopefully, they don’t turn in to Ws! Once sector that has seen little in the way of a bounce off the lows is Energy. On a closing basis, the sector is up less than 2% from its recent low.
To view our entire S&P 500 Chart Book, sign up for a 14-day free trial to our Bespoke Premium research service.