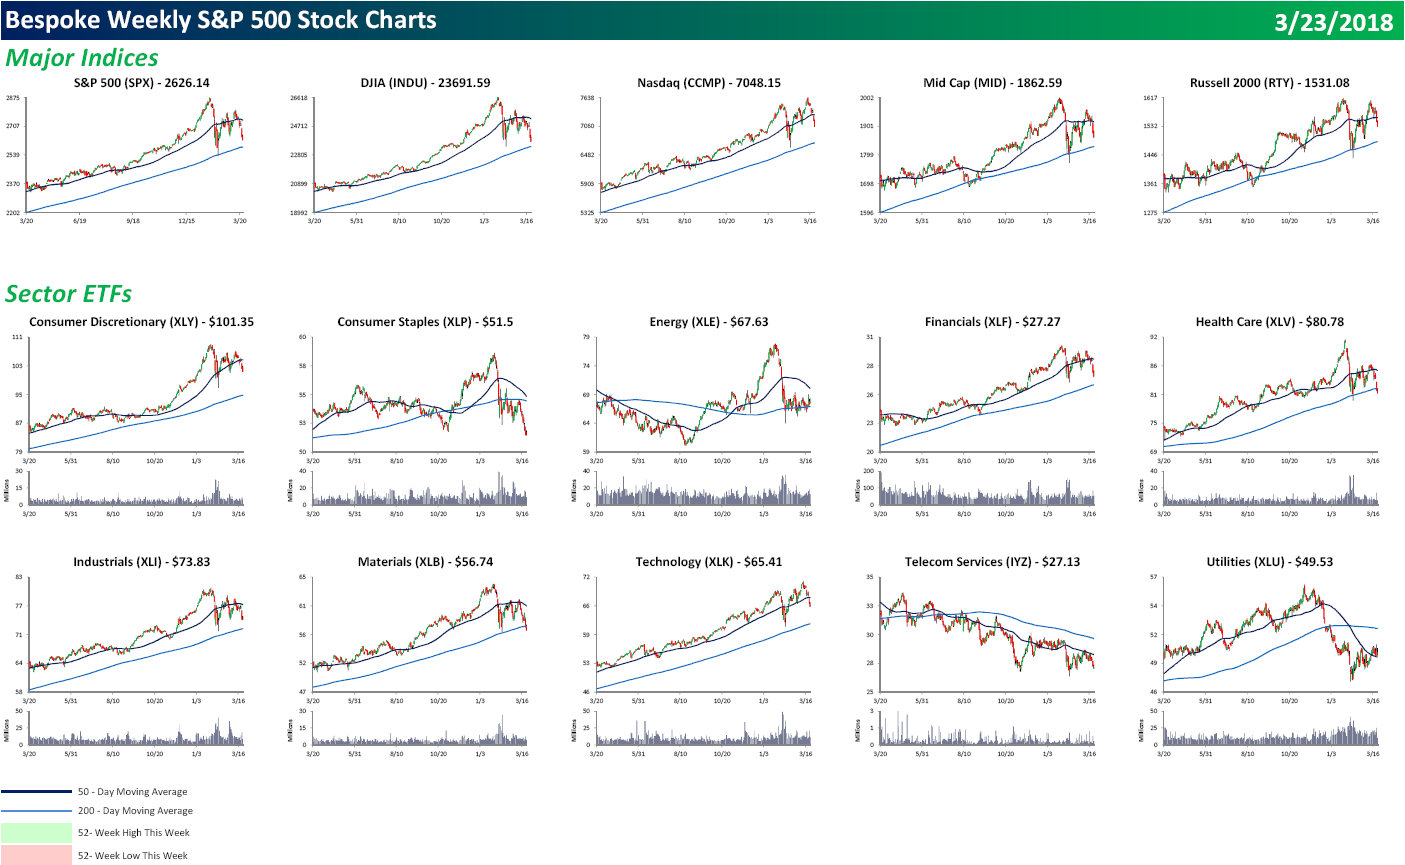
Each weekend as part of our Bespoke Premium and Institutional research service, clients receive our S&P 500 Quick-View Chart Book, which includes one-year price charts of every stock in the S&P 500. You can literally scan through this report in a matter of minutes or hours, but either way, you will come out ahead knowing which stocks, or groups of stocks, are leading and lagging the market. The report is a great resource for both traders and investors alike. Below we show the front page of this week’s report which contains price charts of the major averages and ten major sectors.
It was an extremely poor finish to an already poor week for US equities. While none of the major indices or sectors traded to 52-week lows, if you thumb through our chart book, the number of new lows is starting to add up with 22 this week, and 200-DMAs are being breached to the downside left and right. Consumer Discretionary Amazon, Financials, and Technology had been the stalwarts, but even they started to crack this week. To view our entire S&P 500 Chart Book, sign up for a 14-day free trial to our Bespoke Premium research service.