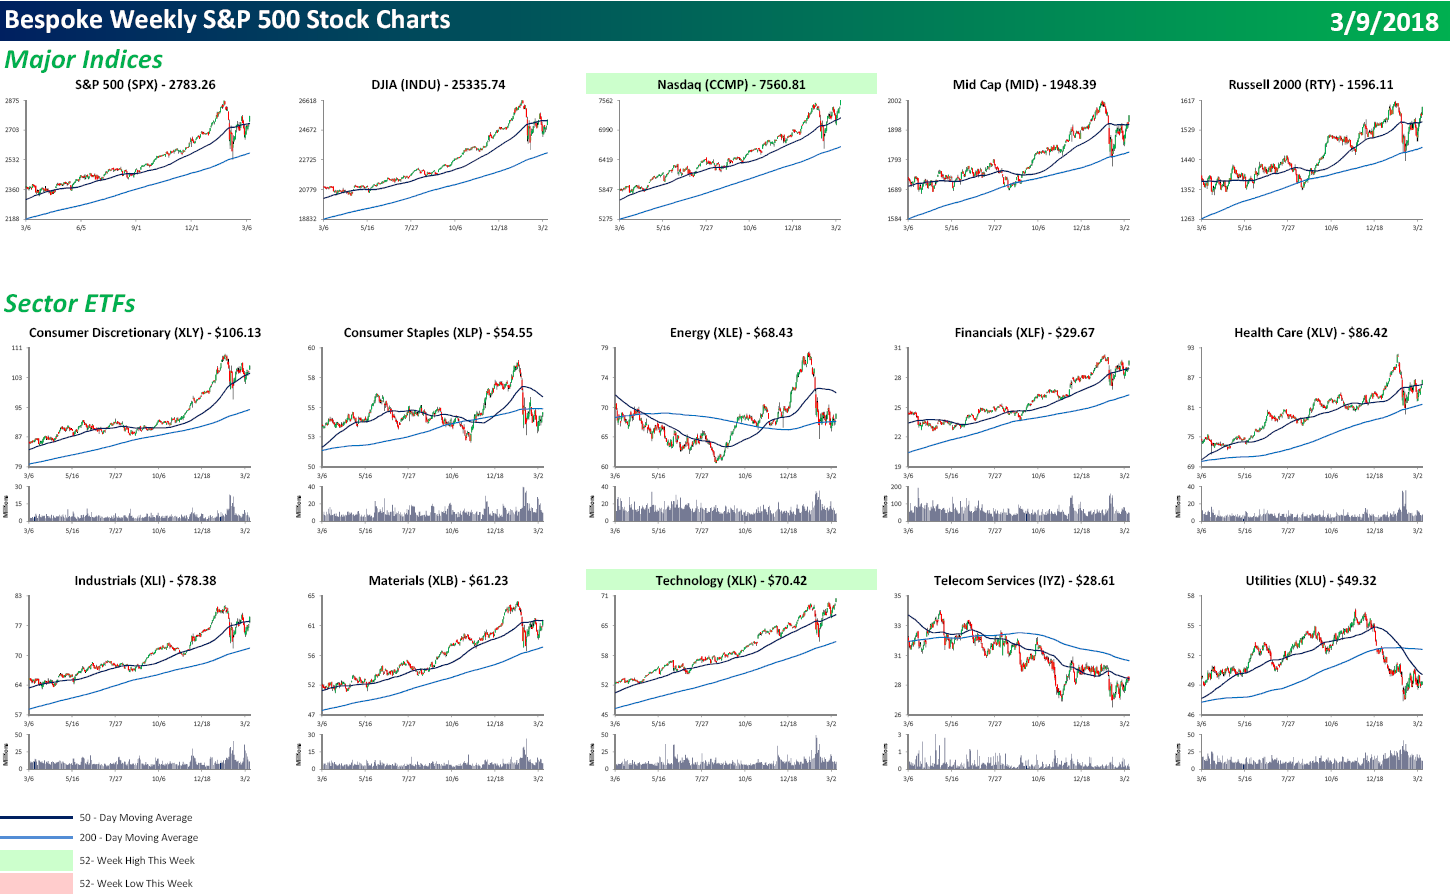
Each weekend as part of our Bespoke Premium and Institutional research service, clients receive our S&P 500 Quick-View Chart Book, which includes one-year price charts of every stock in the S&P 500. You can literally scan through this report in a matter of minutes or hours, but either way, you will come out ahead knowing which stocks, or groups of stocks, are leading and lagging the market. The report is a great resource for both traders and investors alike. Below we show the front page of this week’s report which contains price charts of the major averages and ten major sectors.
It was a strong finish to the week for US equities as all of the major averages finished at their highs of the day. The S&P 500 marginally took out its late February high, and believe it or not, the Nasdaq made a new all-time high. Of the ten major sectors shown, only Technology made a new high. Hmmm. The Nasdaq and Technology making new highs all by themselves? Sounds like the late 1990s. To view our entire S&P 500 Chart Book, sign up for a 14-day free trial to our Bespoke Premium research service.