Jun 2, 2026
See what’s driving market performance around the world in today’s Morning Lineup. Bespoke’s Morning Lineup is the best way to start your trading day. Read it now by starting a two-week trial to Bespoke Premium. CLICK HERE to learn more and start your trial.
“Though a good deal is too strange to be believed, nothing is too strange to have happened.” – Thomas Hardy

Below is a snippet of commentary from today’s Morning Lineup. Start a two-week trial to Bespoke Premium to view the full report.
While Dow futures point to a 0.45% decline at the open, futures on the S&P 500 and Nasdaq are down much less, indicating a decline of less than 0.2%…for now. Crude oil is down 1.5% but still above $90 per barrel, while the 10-year yield declines 5 bps to 4.43%. Gold prices are up over 1% while Bitcoin is down over 3% and back below $70 as traders increasingly lose patience with the crypto space in search of greener pastures.
It’s a quiet day for economic data today, with the 10 AM JOLTS being the only report on the calendar. We’ll also get May vehicle sales data from the major OEMs throughout the day.
Overnight in Asia, it was a mixed session with the Nikkei down 0.3% while Hong Kong and China both rallied. South Korea’s KOSPI experienced a marginal gain of 0.2%, which, relative to recent moves, seems like a decline!
In Europe, the tone is more positive as the STOXX 600 rallies 0.7%, led higher by Italy and Germany. May CPI for the Eurozone increased 3.2% y/y, which was right in line with expectations, while Core CPI was slightly ahead of consensus forecasts (2.5% vs 2.4%).
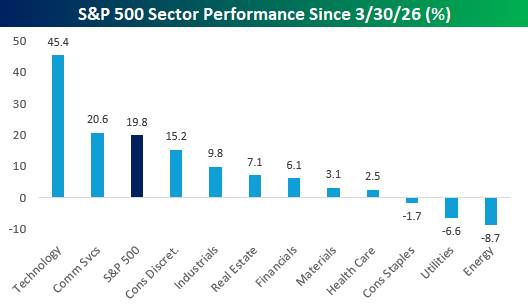
Since the market low at the end of March, the S&P 500 is up just under 20%, but as we are all aware, breadth has been narrow. The lion’s share of the gains has been in the Technology sector, which has rallied over 45%, and the only other sector outperforming the S&P 500 over that time is Communications Services, which is ahead of the index only just barely. The nine other sectors in the S&P 500 are all underperforming the index by a wide margin, including three – Energy, Utilities, and Consumer Staples – which are lower.
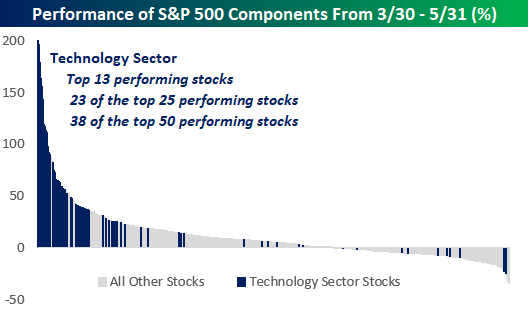
One way to illustrate the dominance of tech since the March low is in the performance of each S&P 500 component. Since the March 30 low, 38 of the top 50 performing stocks are from the Technology sector, including 23 of the top 25 and all of the top 13. It’s been Technology and everyone else.
Of the top performing stocks since 3/30, the tech stocks dominating the list have primarily been – you guessed it – semiconductor stocks, and more specifically memory stocks. Many of these names doubled or tripled in the span of just two months!
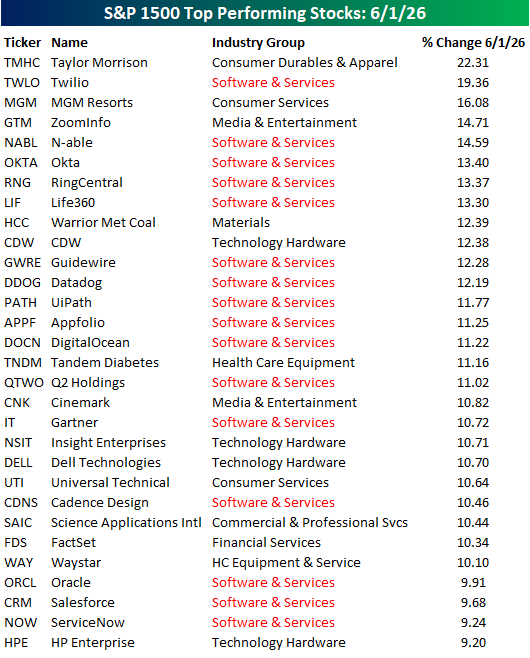
In yesterday’s trading, Technology was once again the top performing sector in the S&P 500 and one of just two sectors to trade higher. In looking at the top performing stocks yesterday, Technology stocks once again dominated the list, but it wasn’t semis. In fact, of the top 30 performing stocks in the S&P 1500 yesterday, not a single semiconductor stock made the list even though Technology was one of only two sectors to trade higher.
As shown in the list below, yesterday’s dominant group within the Technology sector was software stocks. Of the 30 top performing stocks, more than half were from the Software and Services Industry Group.
Start a two-week trial to Bespoke Premium to continue reading today’s full Morning Lineup.
Jun 1, 2026
See what’s driving market performance around the world in today’s Morning Lineup. Bespoke’s Morning Lineup is the best way to start your trading day. Read it now by starting a two-week trial to Bespoke Premium. CLICK HERE to learn more and start your trial.
“People talk about AI reducing jobs – complete nonsense. It’s causing more software engineers to be hired.” – Jensen Huang
Below is a snippet of commentary from today’s Morning Lineup. Start a two-week trial to Bespoke Premium to view the full report.
It’s a new month, but the market rally continues to roll on. S&P 500 futures are priced to open 0.2% higher, while the Nasdaq is fractionally higher. Treasury yields are unchanged right around 4.45% while crude oil trades back above $90, as there don’t seem to be any signs of an imminent peace deal or ceasefire. Gold prices are down 1.4% but still above $4,500 per ounce, while weakness in Bitcoin persists as prices fall to their lowest level since April.
Asian and European markets have been mixed to kick off the month, as manufacturing PMI indices have started to hit the tape. Here in the US, we’ll get the S&P 500 and ISM reads on the manufacturing sector at 9:45 and 10:00 AM, respectively.
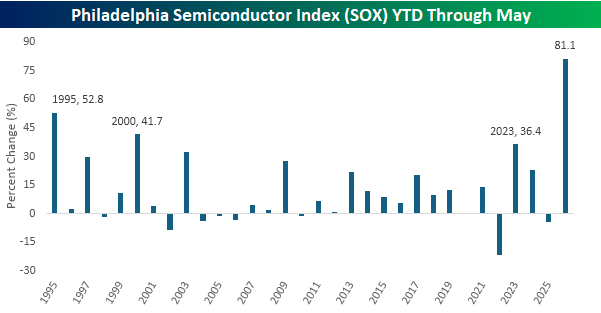
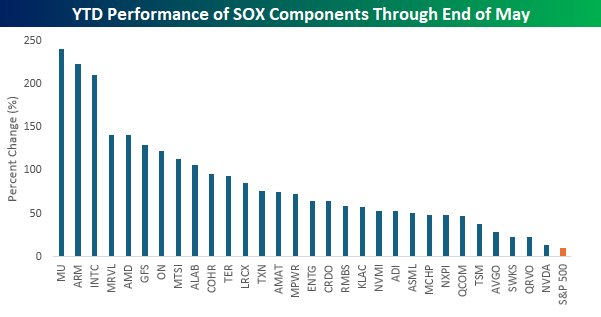
In a speech from Taiwan overnight, Nvidia (NVDA) CEO Jensen Huang called 2026 “the year of agents”. In the evolution of AI, that’s definitely been the case, and the side-effect of that trend in AI is that in the stock market, 2026 has been the year of semiconductors. With a year-to-date gain of 81.1% through the end of May, the Philadelphia Semiconductor Index (SOX) has easily had its best start to a year in its history.
Before 2026, the best start to a year for the SOX was its first full year in 1995, when it rallied 52.8%, or nearly 30 percentage points less than this year’s gain. An 81% gain to start the year is impressive under any circumstances, but when you consider the size of the sector, 81% is almost unbelievable.
Besides having a monster gain at the index level, the rally in semis has been broad. Of the index’s 30 components, eight have more than doubled, including three that are up over 200%. The average gain of all 30 components has been modestly better than the index itself (+87%), indicating that, unlike the S&P 500, it hasn’t been just the biggest stocks in the index driving the gains. Participation has been so broad, in fact, that every stock in the SOX has outperformed the S&P 500 so far this year.
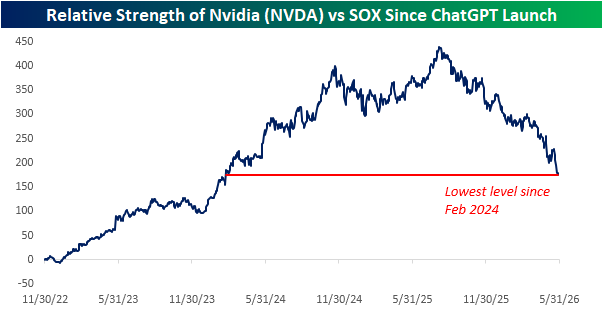
What really stands out about the chart below, though, is NVDA’s performance relative to all the other members of the SOX. With a gain of 13.2% YTD, it’s easily the worst performer in the index and outperforming the S&P 500 by less than three percentage points. So, while all of the major financial outlets are focusing endlessly on last night’s announcements from NVDA out of Taiwan, investors have been looking elsewhere.
Relative to the rest of the semis space, NVDA has been giving up ground for nearly a year now. The chart below shows the stock’s relative strength versus the SOX since the launch of ChatGPT in late 2022. While the stock saw blistering outperformance in the first two years after ChatGPT’s launch, it moved sideways relative to the SOX for nearly a year, and since last August, it has been steadily giving up ground to the index’s other 29 components.
Start a two-week trial to Bespoke Premium to continue reading today’s full Morning Lineup.
May 29, 2026
See what’s driving market performance around the world in today’s Morning Lineup. Bespoke’s Morning Lineup is the best way to start your trading day. Read it now by starting a two-week trial to Bespoke Premium. CLICK HERE to learn more and start your trial.
“In a crisis, be aware of the danger–but recognize the opportunity.” – John F. Kennedy
Below is a snippet of commentary from today’s Morning Lineup. Start a two-week trial to Bespoke Premium to view the full report.
Futures are modestly higher this morning following a mostly positive session in Asia, where South Korea rallied 3.6% to take its weekly gain to 8%. The Nikkei also rallied 2.5% for a weekly gain of nearly 5%. Asia’s positive moves have flowed through to Europe this morning, and the STOXX 600 is up 0.6%, led higher by Spain, Italy, and France.
Outside of equities, treasury yields and crude oil are modestly lower on reports that the Iran-US ceasefire will be extended, and gold is bouncing after briefly trading below its 200-DMA yesterday.
An AI compute deal between Anthropic, Alphabet (GOOGL), Broadcom (AVGO), Apollo (APO), and Blackstone (BX) was reported on by Bloomberg last night. The deal has a lot of moving parts to it, and raises concerns over complex transactions and whether it’s just a lot of smoke and mirrors. We broke it all down in the commentary section of today’s Morning Lineup and explained why it’s nothing like the transactions that took place leading up to the Financial Crisis, so make sure to check that out.
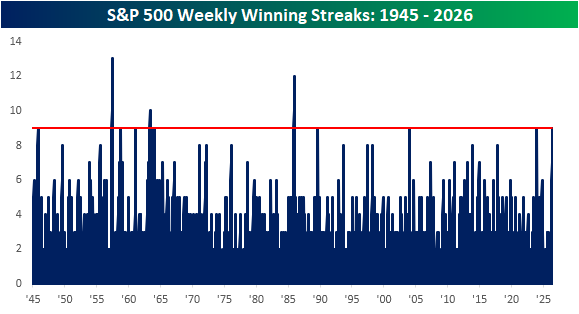
In our experience, we’ve seen enough to know never count anything out, but with the S&P 500 up over 1% already this week, it’s looking likely that the S&P 500 will finish higher this week, extending its weekly streak of gains to nine. The last time the S&P 500 traded higher for nine straight weeks was in December 2023, and the last time there was a longer streak of weekly gains was way back in 1985!
The chart below shows S&P 500 winning streaks in the post-WWII period, and while there have been eleven other nine-week streaks, only four made it to a tenth week or longer. In 1985, the S&P 500 went 12 straight weeks without a decline, and in 1957, the index went 13 weeks, or 3 months, without a weekly decline.
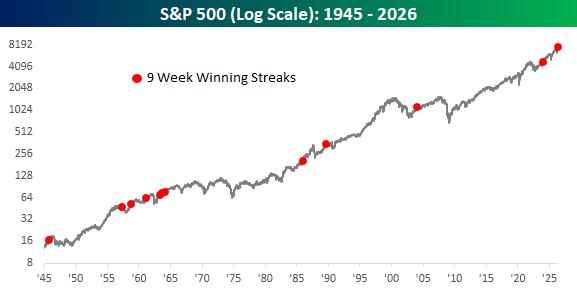
The chart below shows each prior streak on a long-term chart of the S&P 500. Besides the fact that none of these prior periods occurred right near a major top in the market, it’s also interesting to note that they didn’t really occur early on in bull markets coming out of extended bears.
While the S&P 500 keeps chugging along, gold prices have been under pressure for months now, which is a stark contrast to earlier this year when the metal could do no wrong. From the peak in late January, gold prices briefly dropped into bear market territory (on an intraday basis) before rallying intraday. In the process of that decline, gold prices also briefly dipped below the 200-day moving average (DMA) for the first time in 2.5 years.
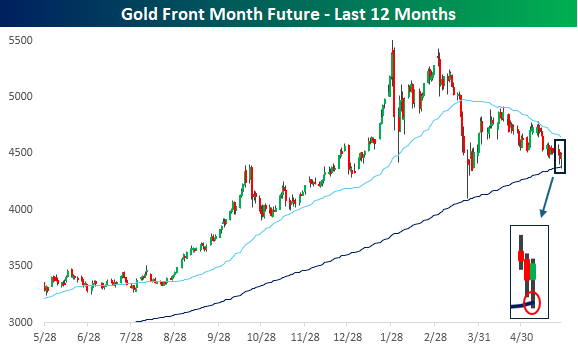
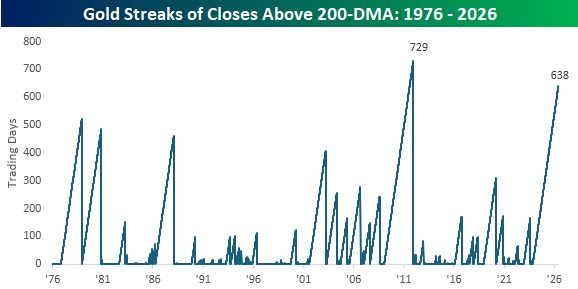
While the streak of trading without a breach of the 200-DMA on an intraday basis ended yesterday, the streak of closes above that level remains intact, and at 638 trading days, it ranks as the second-longest streak on record, trailing only a 729 trading day streak that ended in December 2011. In order for the current streak to break the record, gold would have to stay above its 200-DMA through the summer months and into late October, but it has been an impressive streak.
The decline in gold since its January high, however, should serve as an important reminder that the tide on a trade that can seemingly do no wrong can quickly go out.
Start a two-week trial to Bespoke Premium to continue reading today’s full Morning Lineup.
May 28, 2026
See what’s driving market performance around the world in today’s Morning Lineup. Bespoke’s Morning Lineup is the best way to start your trading day. Read it now by starting a two-week trial to Bespoke Premium. CLICK HERE to learn more and start your trial.
“The distance between insanity and genius is measured only by success” – Ian Fleming
Below is a snippet of commentary from today’s Morning Lineup. Start a two-week trial to Bespoke Premium to view the full report.
Markets are taking a breather this morning as the US and Iran trade missile and drone strikes. The S&P 500 looks poised to open 0.2% lower, while the Nasdaq is down 0.33%. After a brief excursion below $90, WTI crude oil is back above $90, gold is down over 1%, and the 10-year yield is up 3 bps to 4.51%.
Asian stocks were mostly lower overnight, with the Nikkei down 0.5% and Hong Kong falling 1.3%. The Shanghai Composite bucked the trend, finishing with a marginal gain, but even South Korea finished the session lower, falling 0.5%. South Korea down? Outside of the rising tensions between the US and Iran, there was no obvious catalyst for the declines in the region.
In Europe, events in the Middle East have also weighed on equities. The STOXX 600 is down close to 1%. Led lower by the UK, while Italy bucks the trend with a gain. Hawkish comments from the ECB’s Chief Economist also haven’t helped.
In the US today, there’s a monster slate of data on the calendar with Personal Income, Personal Spending, PCE, Jobless Claims, Durable Goods, and GDP all at 8:30, followed by New Homes Sales at 10 AM, as well as Energy inventories at 10:30 and 12:00.
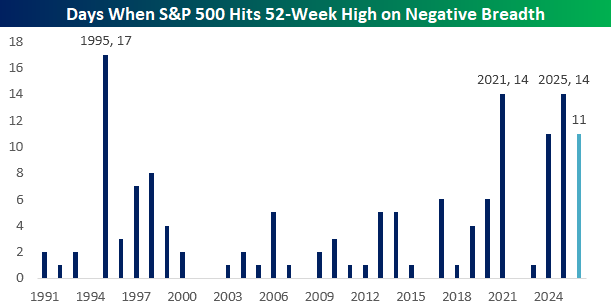
Yesterday was another one of those days when the S&P 500 hit a 52-week high, but breadth was negative. So far this year, these types of daily divergences have occurred 11 times, and if that brings back memories of the late 1990s, it shouldn’t.
As shown in the chart below, we’re not even fully five months into the year, but this year already ranks tied for fourth in the number of days when the S&P 500 closed at a 52-week high but breadth was negative. The only years with more occurrences were 1995 (17), 2021, and 2025, with 14. If you look at the late 1990s, though, in 1998 it happened only eight times all year, in 1999 there were only four occurrences, and in 2000, it only happened twice.
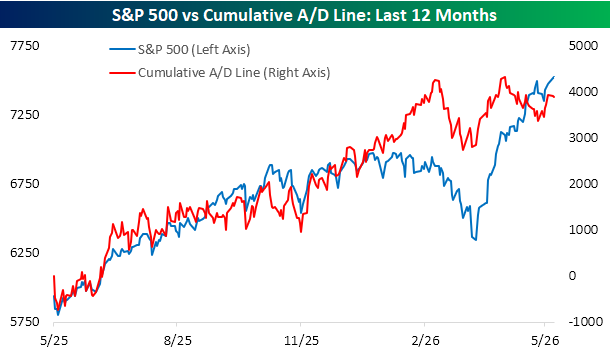
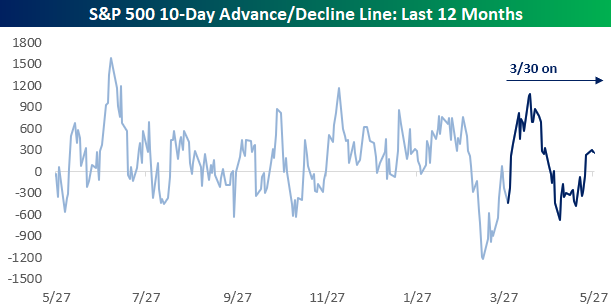
Regarding breadth, the S&P 500’s cumulative advance/decline line continues to diverge from price. On 4/20, the cumulative A/D line made a marginal new high, but ever since then, it’s been biased to the downside, even as the S&P 500 has rallied close to 6%.
At least there have been some signs that breadth is modestly improving. The chart below shows the S&P 500’s 10-day A/D line over the last year, with the period from 3/30 shown in dark blue. While breadth was positive in the early days of the rally, from late April through just before Memorial Day weekend, it was negative before moving modestly back into positive territory this week. Breadth could still use a lot of improvement, but you have to start somewhere!
Start a two-week trial to Bespoke Premium to continue reading today’s full Morning Lineup.
May 27, 2026
See what’s driving market performance around the world in today’s Morning Lineup. Bespoke’s Morning Lineup is the best way to start your trading day. Read it now by starting a two-week trial to Bespoke Premium. CLICK HERE to learn more and start your trial.
“Every victory is only the price of admission to a more difficult problem” – Henry Kissinger
Below is a snippet of commentary from today’s Morning Lineup. Start a two-week trial to Bespoke Premium to view the full report.
S&P 500 futures are modestly higher (+0.27%), while Nasdaq leads (+0.79%) as memory stocks surge again in pre-market trading. Crude oil is down over 4%, right around $90 per barrel, on hopes (again) of a resolution to the war in Iran and the closure of the Strait of Hormuz. The 10-year yield is down 3 bps to 4.46%, and gold is down another 1.2% to $4,450 per ounce.
It’s a quiet economic calendar this morning, with Richmond Fed the only report on the calendar, while several Fed officials are scheduled to speak. In Asia and Europe, markets were mixed, and the STOXX 600 is currently up 0.2%
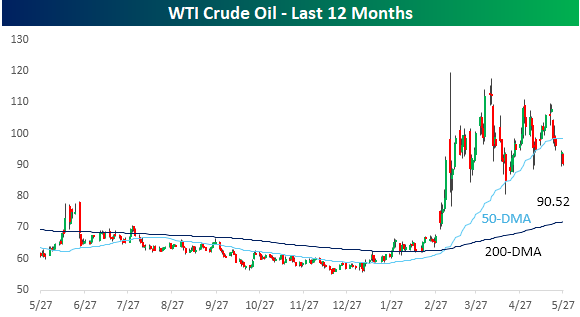
As mentioned above, WTI crude briefly dipped below $90 per barrel this morning and now trades just above that level. Prices have been moving in an increasingly narrow range as the markets await a resolution to the war in Iran and the closure of the Strait of Hormuz. US markets have already rallied so much above their pre-war levels, so it’s hard to imagine seeing the US market get a major lift unless prices see a major decline from here. However, if prices continue to drift lower, we would expect to see a broadening of the rally, perhaps even at the expense of the mega caps.
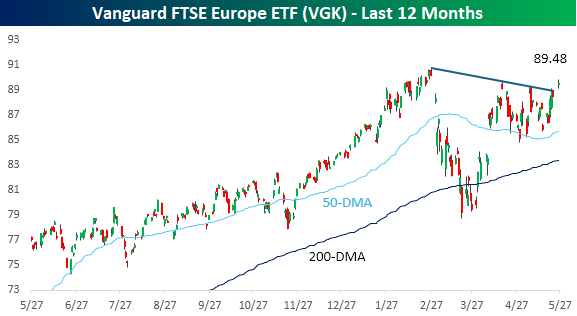
One area of the world more leveraged to oil prices is Europe. As shown below, the FTSE Europe ETF (VGK) has yet to take out its high from earlier in the year, but the drop in oil prices this morning has it getting closer. With this morning’s rally, the ETF is also breaking its downtrend from its earlier peak, leaving one less roadblock to clear on the road to new highs.
On a final note, here we go again. Whenever a new trend emerges in the market, you always find irrelevant companies looking to exploit the wave of euphoria by ‘rebranding’ their businesses to capitalize on the wave of investor interest. In the late 1990s, we saw it with dot-com companies. Then, about 10 years ago, penny stocks started adding crypto to their name in hopes of getting a pop in their share prices.
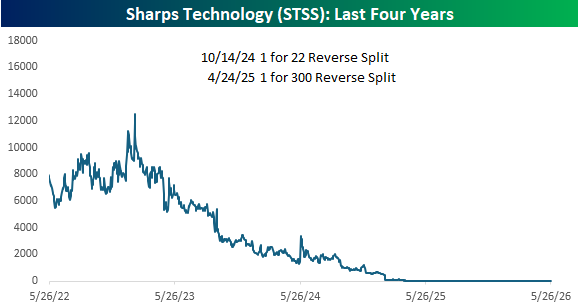
Recently, the “it” rebranding strategy is AI, and the latest example this morning is a company called Sharps Technology (SSTS). For years, Sharps Technology could generously be described as a medical device company in that they made medical syringes. In 2025, the company “pivoted” towards crypto, essentially becoming a Solana treasury company and holding as much as $250 million in the cryptocurrency on its balance sheet.
Judging by the company’s stock price, the pivot to crypto didn’t go as planned, as the price of STSS stock has been in a steady free-fall for several years now. On a reverse-split adjusted basis, the stock has gone from around $16,000 to $1.82 yesterday. It’s been like a memory stock, but only in reverse!
Often, a reverse stock split, even if it’s on a 1-2 basis, is a sign of trouble at a company. STSS has announced two reverse stock splits in the last four years. In October 2024, the company announced a 1 for 22 reverse split, and if that wasn’t bad enough, six months later, it announced a 1 for 300 split. If our math is correct, for every 6,600 shares you had in the summer of 2024, you have one now!
Since the crypto strategy hasn’t quite worked out for Sharps, today the company is going in a new direction and announced a new “vision to build the leading Agentic Finance Platform for the Global South.” The company will change its name to SkyAI and combine its “stablecoin rails with agentic AI to deliver financial access, education, and actionable intelligence to the billions of underbanked users across Africa, Latin America, and Southeast Asia.”
Whenever you see these types of stories, it immediately brings bubble talk into the conversation, and rightfully so. The one silver lining to all of this, at least at this point, is that the announcement has been largely ignored as shares of STSS are up merely six cents in pre-market trading.
Start a two-week trial to Bespoke Premium to continue reading today’s full Morning Lineup.
May 26, 2026
See what’s driving market performance around the world in today’s Morning Lineup. Bespoke’s Morning Lineup is the best way to start your trading day. Read it now by starting a two-week trial to Bespoke Premium. CLICK HERE to learn more and start your trial.
“You’re short on ears and long on mouth.” – John Wayne
Below is a snippet of commentary from today’s Morning Lineup. Start a two-week trial to Bespoke Premium to view the full report.
The headlines over the weekend regarding the status of the war in Iran have been conflicting, but markets are taking the optimistic side. S&P 500 and Nasdaq futures were both firmly higher to kick off the holiday-shortened week. The S&P 500 is on pace to open at a new record high with a gain of 0.70%, while Nasdaq futures are up my more than 1%. European and Asian markets were mostly lower overnight, but that’s because they were open yesterday and saw broad gains.
Outside of equities, the 10-year yield is down 9 basis points and back below 4.5%, while crude oil is down 4% to $92.66, although it was down more over the weekend.
Here in the US today, we’re largely done with earnings season, but on the economic calendar, we’ll get house price data at 9 AM easter, Consumer Confidence at 10 AM, and the Dallas Fed Manufacturing Index at 10:30.
After the long weekend, we wanted to provide a quick recap of market performance heading into the holiday. The S&P 500 was up less than 1% for the week, but breadth was positive as three sectors rallied more than 3%, and another three rallied more than 1%. The only sectors that traded lower were Communication Services and Materials, which were both down less than 1%.
In terms of where sectors are trading compared to their trading ranges, four finished the week at overbought levels, while every other sector was neutral. Utilities and Materials are also the only sectors that headed into the weekend below their 50-day moving averages, but Utilities at least moved out of extreme oversold territory.
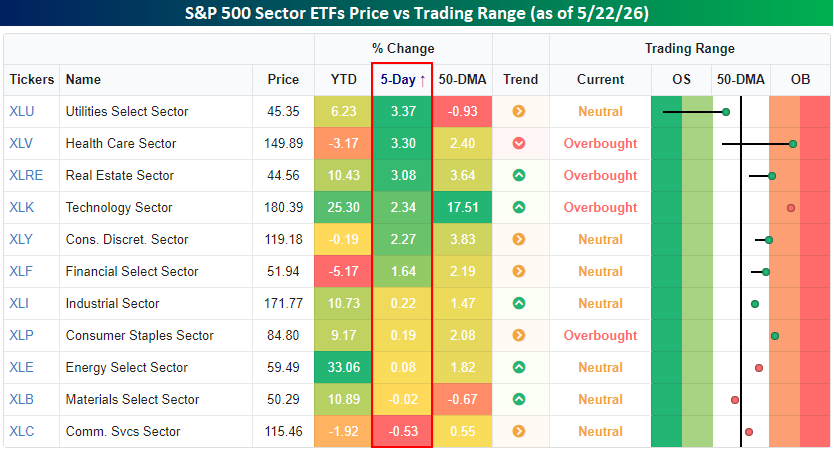
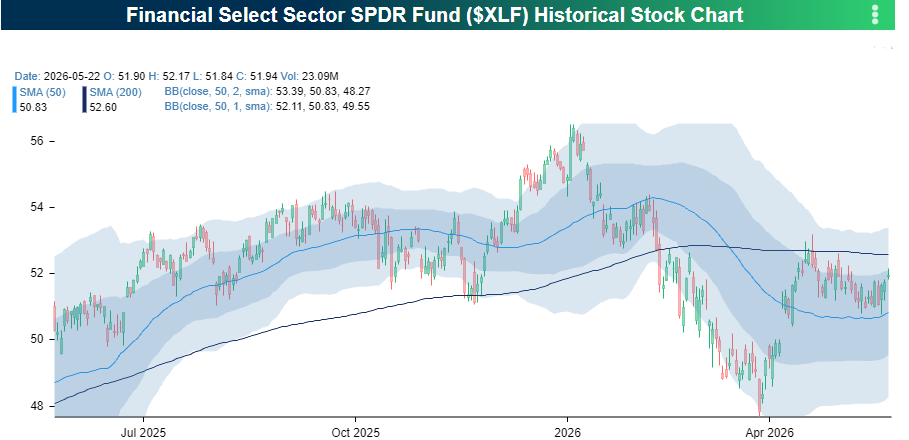
On a YTD basis, Financials has been the worst-performing sector with a decline of just over 5%. As shown in the chart below, the sector ETF finished the week right between its 50 and 200-DMAs. The 50-DMA, which has recently been acting as support, also coincides with longer-term support in the low 50s.
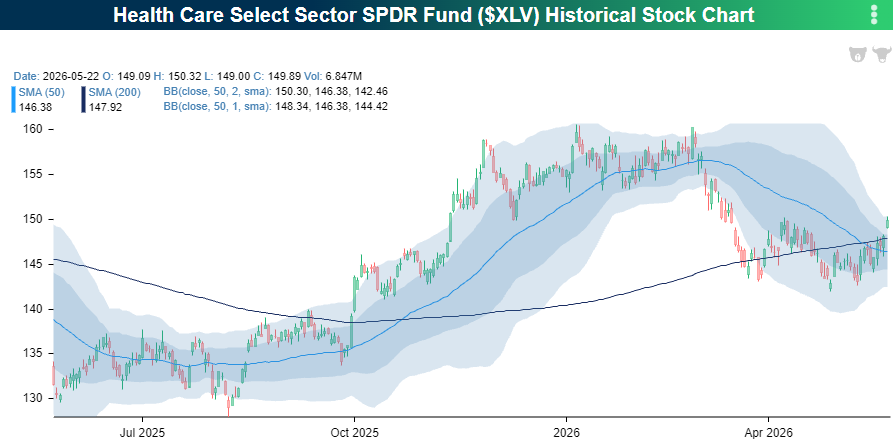
Health Care has been another laggard this year, but has recently shown some signs of life. After holding support in the low $140 range for the last few weeks, the sector broke out of a short-term trading range to close out the week and closed above both its 50 and 200-DMA for the first time in several weeks. Health Care has been out of favor for a long time now, but there’s a lot of runway for the sector between current levels and the high from earlier this year.
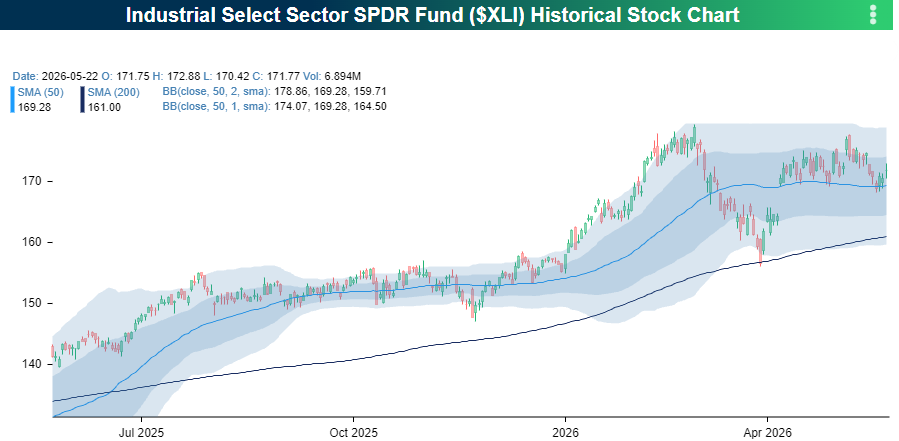
Finally, Industrials were a laggard last week, and along with other sectors, still have yet to trade to a new high. As shown in the chart below, though, the sector is getting close. XLI has traded in a sideways range for more than a month now, with downside support at the 50-DMA and upside resistance at the highs from earlier in the year. If the headlines are right and the Iran war is close to an end, the resistance may start to weaken.
Start a two-week trial to Bespoke Premium to continue reading today’s full Morning Lineup.