Jun 10, 2026
See what’s driving market performance around the world in today’s Morning Lineup. Bespoke’s Morning Lineup is the best way to start your trading day. Read it now by starting a two-week trial to Bespoke Premium. CLICK HERE to learn more and start your trial.
“I believe in the idea of the rainbow. And I’ve spent my entire life trying to get over it.” – Judy Garland

Below is a snippet of commentary from today’s Morning Lineup. Start a two-week trial to Bespoke Premium to view the full report.
US stocks are down and bond yields up ahead of the open after President Trump suggested on Truth Social that the US will resume bombings of Iran. Leading up to Trump’s comments, futures were already pointed lower, however, led by Tech.
It’s important to note that we’re seeing rotation within the market rather than out of the market. Yes, the broad indices are down because of Tech’s large weighting, but we’ve seen nice gains for sectors like Health Care, Real Estate, Consumer Staples, and Financials as Tech has been selling off.
Start a two-week trial to Bespoke Premium to continue reading today’s full Morning Lineup.
Jun 9, 2026
See what’s driving market performance around the world in today’s Morning Lineup. Bespoke’s Morning Lineup is the best way to start your trading day. Read it now by starting a two-week trial to Bespoke Premium. CLICK HERE to learn more and start your trial.
“It’s not supposed to be easy. Anyone who finds it easy is stupid.” – Charlie Munger
Below is a snippet of commentary from today’s Morning Lineup. Start a two-week trial to Bespoke Premium to view the full report.
Crude oil is back below $90 this morning after President Trump suggested that a deal with Iran could be reached in the next 2-3 days. Equities are rallying as well with SPY up 40 bps pre-market and QQQ up double that at 80 bps.
Semis, AI, and quantum names are dominating the list of pre-market winners as investors rotate back into the areas that got hit hardest late last week.
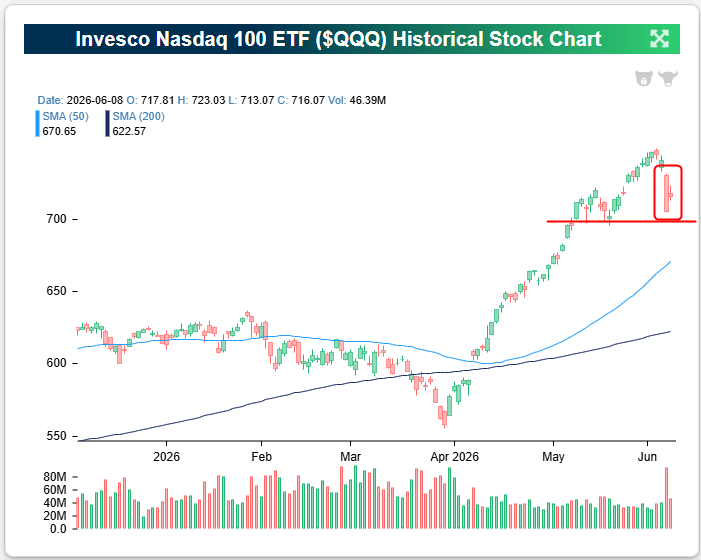
After a 4%+ drop on Friday, the Nasdaq 100 (QQQ) rallied back 1.5% yesterday to start the new trading week. As shown below, the intraday range yesterday looks tiny compared to the huge red bar seen Friday. QQQ still needs to gain 3.3% just to get back to its closing level last Thursday.
Start a two-week trial to Bespoke Premium to continue reading today’s full Morning Lineup.
Jun 8, 2026
See what’s driving market performance around the world in today’s Morning Lineup. Bespoke’s Morning Lineup is the best way to start your trading day. Read it now by starting a two-week trial to Bespoke Premium. CLICK HERE to learn more and start your trial.
“It takes less courage to criticize the decisions of others than to stand by your own.” – Attila the Hun (attributed)
Below is a snippet of commentary from today’s Morning Lineup. Start a two-week trial to Bespoke Premium to view the full report.
US equity futures are bouncing back to start the new trading week with the S&P 500 trading up roughly 0.7% pre-market, and the Tech-heavy Nasdaq 100 up about 1.3%.
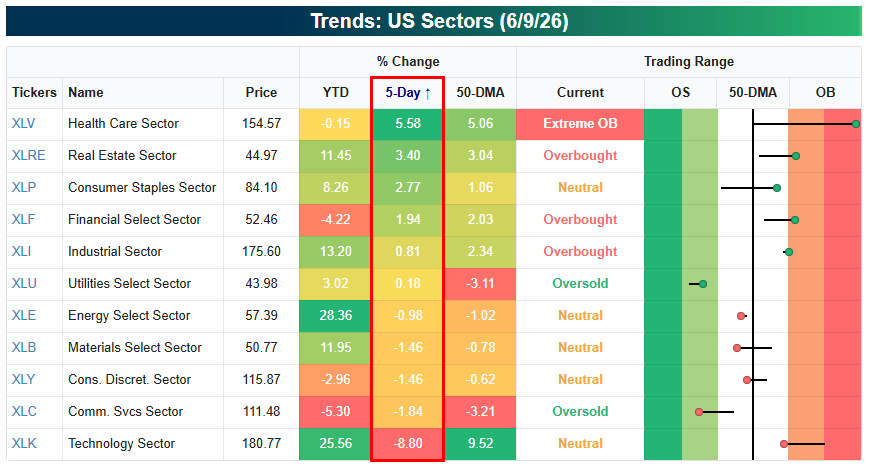
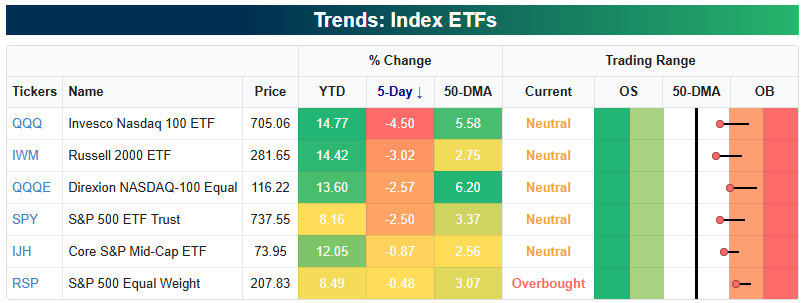
After a 33.7% rally from March 30th through last Tuesday’s close (6/2), traders finally rotated out of the QQQs late last week with a 5% drop from Wednesday through Friday. The S&P 500 ended a nine-week winning streak, and both the S&P and Nasdaq 100 moved out of overbought territory back to “neutral” levels.
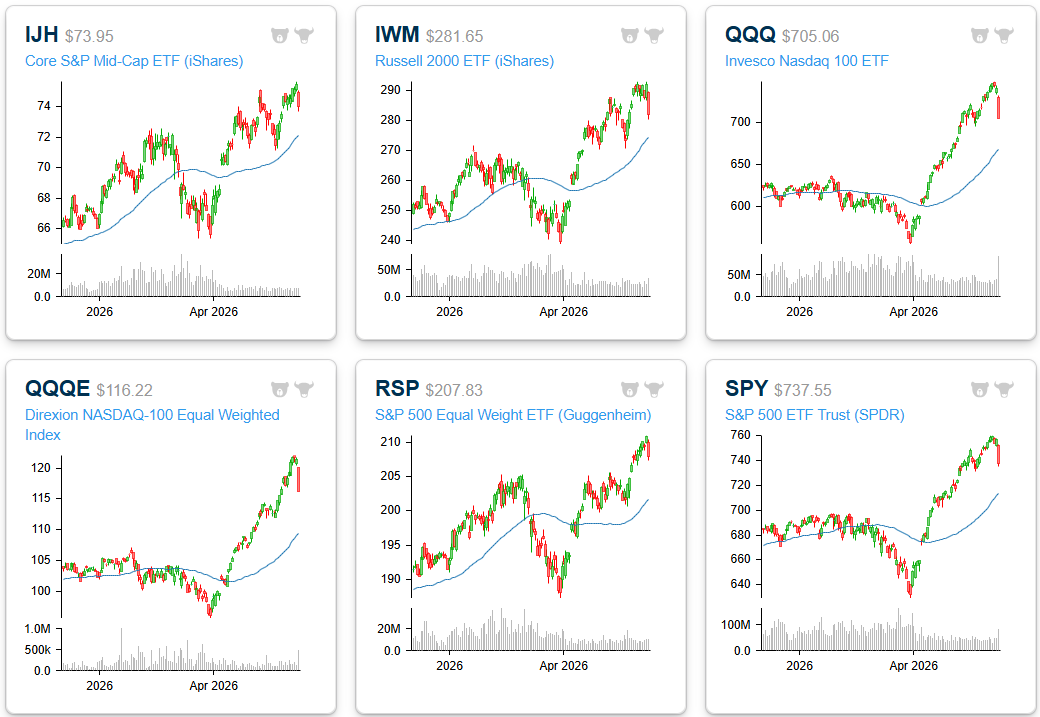
As shown below, even with the drop on Friday, there’s still quite a large gap between current levels and the 50-DMA for both QQQ and SPY.
You can see the pullback into neutral territory in the snapshot of key index ETFs from our Trend Analyzer:
Start a two-week trial to Bespoke Premium to continue reading today’s full Morning Lineup.
Jun 5, 2026
See what’s driving market performance around the world in today’s Morning Lineup. Bespoke’s Morning Lineup is the best way to start your trading day. Read it now by starting a two-week trial to Bespoke Premium. CLICK HERE to learn more and start your trial.
“Inspiration usually comes during work, rather than before it.” – Madeleine L’Engle
Below is a snippet of commentary from today’s Morning Lineup. Start a two-week trial to Bespoke Premium to view the full report.
It’s already been a busy week for employment-related news, and most of it has been good. This morning’s labor report will trump all the other reports and help dictate the direction of the markets heading into the weekend and whether the current streak of weekly gains extends to double digits. Wherever the report comes in, though, remember that it is only one snapshot of a much larger mosaic. Odds are it will be revised multiple times over the next several months (years).
Heading into the last session of the week, equity futures are mostly lower. The Nasdaq is indicated to gap down more than 1%, while S&P 500 futures point to a 0.5% decline, and the Dow is indicated slightly higher. If all of this sounds familiar, it’s because the setup was the same yesterday. There are not really any catalysts to blame for the weakness, except that investors are growing increasingly apprehensive about putting new money to work after the massive tech rally and a coming avalanche of supply.
Outside of equities, treasury yields are modestly lower, with the 10-year yielding just below 4.47%. Oil is slightly higher with WTI at $93.25 per barrel as prospects of a peace deal with Iran continue to dangle just over the horizon that we can never seem to reach. Gold is slightly lower, and Bitcoin is down another 2% and approaching $62K.
In Asia, markets closed out a mostly negative week on a down note, with the Nikkei and Hong Kong falling over 1% while South Korea plunged 5%. In Europe, markets are moving in the other direction. The STOXX 600 is up 0.3%, led higher by Spain, which is up 1%. The gains come despite Q1 GDP being revised from growth of 0.1% to a contraction of 0.2%. That was the first negative quarter for the region since 2021.
Besides the declines in Asian stocks overnight, the Japanese yen and South Korean won have been weak. Just weeks after the BoJ intervened in the market to defend the currency, the yen has resumed its slide, pushing towards a psychologically important level of 160 versus the dollar. In South Korea, the won has shown steady weakness against the dollar for over a year now (rising line in chart), and just last night traded at its weakest level versus the dollar since 2009.
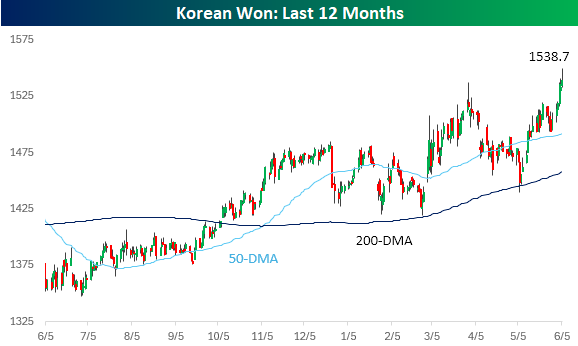
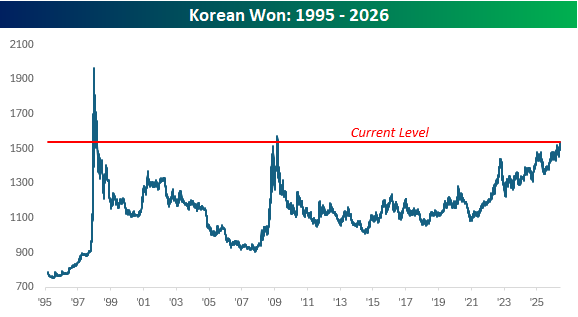
Many comparisons have been made between the current market environment and the late 1990s, and weakness in Asian currencies can just be added to the list. In 1997, we had the Asian currency crisis, which spawned a global market sell-off, so it’s only natural to raise an eyebrow when you see headlines about the South Korean won hitting multi-year lows versus the dollar.
A look at the long-term chart for the won, however, shows that at this point, the decline looks nothing like the weakness we saw in 1997 and 2008. In both of those periods, the weakness went parabolic, whereas the current period of weakness has been a steadier grind. If the slope of the line starts to steepen, though, put on your seatbelt.
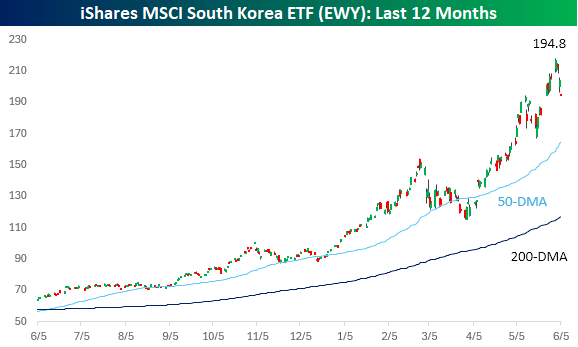
While the won has been weakening, the rate of decline hasn’t been nearly fast enough to offset the rabid gains in the South Korean equity market. Over the last year, the iShares MSCI South Korea ETF (EWY) has more than tripled, rising from around $60 to over $200 earlier this week, and just under $195 in pre-market trading today. At these levels, EWY is holding right at the levels it was after its gap higher in late May after the Memorial Day weekend. If these levels can hold, the recent pullback will look benign, but even after this pullback, prices remain extremely elevated.
Start a two-week trial to Bespoke Premium to continue reading today’s full Morning Lineup.
Jun 4, 2026
See what’s driving market performance around the world in today’s Morning Lineup. Bespoke’s Morning Lineup is the best way to start your trading day. Read it now by starting a two-week trial to Bespoke Premium. CLICK HERE to learn more and start your trial.
“A good first impression can work wonders.” – J.K. Rowling
Below is a snippet of commentary from today’s Morning Lineup. Start a two-week trial to Bespoke Premium to view the full report.
Markets are getting a bit of a reality check this morning as Nasdaq futures are down over 1%, while S&P 500 futures look at a more modest decline of 0.4%. The weakness comes despite crude oil prices trading down over 3% whle the 10-year yield trades down to 4.45%. Gold prices are rallying as investors take more of a risk-off approach, and Bitcoin is down another 3% to less than $64K.
Asian stocks were lower across the board overnight, following the lead of US equities on Wednesday and the follow-through into the overnight session. The Nikkei was down 1.4%, while South Korea fell 1.8%. European stocks have much less exposure to Technology and are therefore experiencing a mixed picture rather than trading broadly lower. The STOXX is down 0.2% with the UK leading the way lower (-0.7%). On the upside, France is up 0.8% while Spain and Germany are both up over 0.5%.
In the US today, along with jobless claims at 8:30, we also got Non-Farm Productivity and Unit Labor Costs. Initial claims were higher than expected, while Non Farm Productivity and Unit Labor costs both came in light. Later today, we’ll also hear from a few Fed speakers.
The news of Alphabet’s (GOOGL) equity offering earlier this week reinforced the idea that AI investment will remain strong for quarters to come, but equity prices have rallied sharply and reflected much of that, so all it takes is one company to at least temporarily wreck the party. Yesterday, the party pooper was Broadcom (AVGO). While the company reported better than expected EPS, inline revenues, and raised guidance, the magnitude of the beats and the guidance raise wasn’t enough given the run in the stock over the last year.
As a result, the stock is trading down 15% in the pre-market, shaving more than $300 billion off its market cap and dragging the rest of the Technology sector down with it. The S&P 500 Technology sector is on pace to gap down over 2% at the open, while Nasdaq 100 futures are down 1.4%. If you own a tech stock that was up a lot over the last few days, you’re looking at some relatively steep losses this morning.
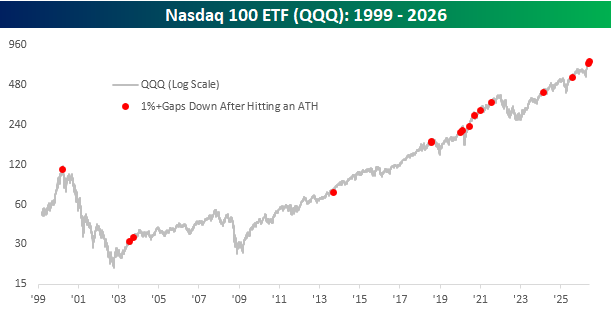
If current levels hold until the open, today will be the Nasdaq 100 ETF’s (QQQ) 9th downside gap of at least 1% this year and the 533rd since its inception in 1999. In other words, these types of declines are relatively common.
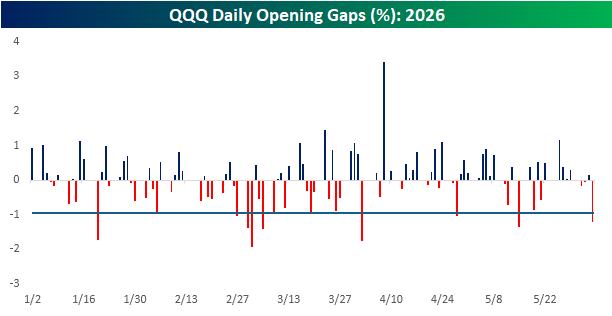
What makes this morning’s decline somewhat more unique is that it comes after QQQ traded at an all-time high on an intraday yesterday. Since the ETF’s inception in 1999, there have only been fifteen other occurrences when it gapped down 1%+ the day after hitting an all-time high. Ironically, though, this is the second occurrence in less than a month. Less than three weeks ago, QQQ gapped down 1.34% the day after hitting an all-time high the day before.
The chart below shows each of those occurrences going back to 1999. The first occurrence was in March 2000, coinciding with QQQ’s peak from the dot-com bubble. From there, QQQ fell more than 50% over the next year and ultimately declined more than 80%. First impressions tend to linger, so investors around at the time have nightmares about that type of setup. Besides the March 2000 occurrence, most of the other times that we saw QQQ gap down 1%+ after hitting an all-time high occurred in the middle of longer-term bull markets rather than at the end.
Start a two-week trial to Bespoke Premium to continue reading today’s full Morning Lineup.
Jun 3, 2026
See what’s driving market performance around the world in today’s Morning Lineup. Bespoke’s Morning Lineup is the best way to start your trading day. Read it now by starting a two-week trial to Bespoke Premium. CLICK HERE to learn more and start your trial.
“I never learned anything while i was talking.” – Larry King
Below is a snippet of commentary from today’s Morning Lineup. Start a two-week trial to Bespoke Premium to view the full report.
We’ve seen a mixed picture in equity futures this morning, with the S&P 500 indicated to open less than 10 bps lower while the Nasdaq looks to open 0.2% higher as strength in tech stocks continues to drive the market higher. Treasury yields are slightly higher, with the 10-year up 2 bps to 4.48% while the 30-year yield once again flirts with 5%. Oil prices are 2% higher as the US and Iran traded military strikes overnight, threatening to upend any hopes for a resolution in the war. Gold prices are down almost 1% while Bitcoin is basically unchanged.
Asian markets were mixed again overnight. The Nikkei surged 2.5% to a record high, fueled by technology stocks. Stocks in Hong Kong moved in the opposite direction, falling 1.6%, while China was up slightly and South Korea was closed for a holiday. Service sector PMI indices for May were released and generally were in line with or better than expected.
European stocks have been moving in more unison this morning, and the direction is lower. The STOXX 600 is down 0.5% with a 1.1% decline in Germany leading the way lower, while Spain bucks the negative tide with a rally of 0.3%. The weakness comes despite stronger-than-expected PMIs for the services sector, as renewed tensions between the US and Iran and new proposed tariffs from the US take on a greater significance.
In the US this morning, we’ll also get updated PMI readings for the Services sector along with Factory Orders and Durable Goods, but all that will come after the 8:15 release of the ADP Employment report, which just hit the tapes and came in stronger than expected at 122K versus forecasts for an increase of 120K.
There’s been some incredible streaks unfolding over the last several weeks. Heading into the start of tomorrow’s Memorial Tournament, the world’s number one golfer, Scottie Scheffler, had finished within the top 25 of all 11 tournaments he played in this season, extending his streak dating back to August 2024 to 32. In the modern era (since 1983), Tiger Woods holds the title for most consecutive top 25 finishes with 38 in a streak that stretched from the 1999 Buick Invitational to the 2001 Phoenix Open.
In the NBA, the New York Knicks have won 11 straight playoff games heading into the start of today’s NBA Finals. The only two other teams to win more straight playoff games in a single postseason were the Golden State Warriors (15) in 2017 and the San Antonio Spurs (12) in 1999. Both teams ultimately won the championship, with the Warriors beating the Cavaliers in five games and the Spurs beating the Knicks in 5.
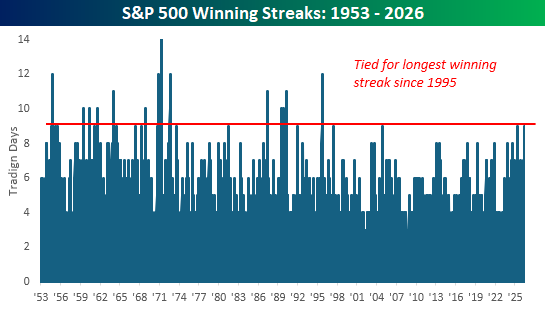
Within the market, we’ve also seen some incredible streaks. In Monday’s Chart of the Day, we highlighted the back-to-back monthly gains of more than 5%, and then on Tuesday, we provided an analysis of the S&P 500’s streak of 21 straight days of closing more than 5% above its 50-DMA. Some other notable streaks worth noting involve the number nine. Heading into this week, the S&P 500 was up for nine straight weeks, and yesterday, the index closed higher for the 9th day in a row!
The chart below shows prior daily winning streaks for the S&P 500, and with yesterday’s gain, the current streak ranks as tied for the longest since 1995. That streak in 1995 lasted 12 trading days and was tied for the second-longest since at least late 1952, when the five-trading-day workweek in its current form started. The longest streak on record was 14 days ending in April 1971.
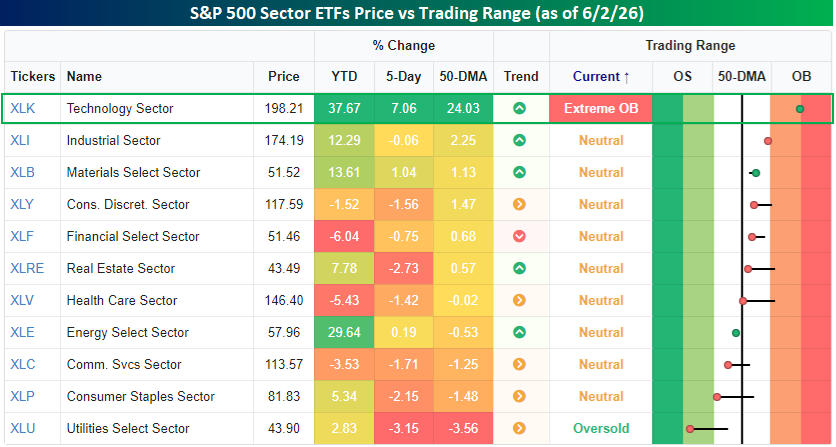
We’ve extensively covered the Technology sector’s outperformance since the March lows. Heading into today’s trading, it’s clearly been a tech and everyone else market. As shown in the snapshot below from our Trend Analyzer, Technology is the only sector trading in “extreme” overbought territory, let alone merely even overbought territory. Further, in the last five trading days, the sector is up over 7%, outperforming the next closest sector by more than seven full-percentage points! Tech doesn’t necessarily have to go down from here, but it’s highly unlikely to keep up this degree of outperformance in the near term.
Start a two-week trial to Bespoke Premium to continue reading today’s full Morning Lineup.