Nov 18, 2025
See what’s driving market performance around the world in today’s Morning Lineup. Bespoke’s Morning Lineup is the best way to start your trading day. Read it now by starting a two-week trial to Bespoke Premium. CLICK HERE to learn more and start your trial.
“Bitcoin is like anything else: it’s worth what people are willing to pay for it.” – Stanley Druckenmiller

Below is a snippet of commentary from today’s Morning Lineup. Start a two-week trial to Bespoke Premium to view the full report.
In the world of spreadsheets, any financial model can tell you with precision what a stock or asset should be worth, but in the real world, just as the S&P 500 rarely has an ‘average’ annual return, stocks and other assets rarely trade at the price where they should trade. It doesn’t take long in the market to learn that sentiment is often just as important as fundamentals, and the last few weeks show that sentiment about what things are worth in many areas of the financial market has been shifting.
S&P 500 and Nasdaq futures are down about 0.5% with the Dow slightly weaker as a 3.4% decline in Home Depot (HD) following earnings drags on that index. The risk-off sentiment has treasury yields moving modestly lower, with the 10-year yield down to 4.10%. Crude oil is little changed but below $60 per barrel, gold is down over 1%, and Bitcoin is modestly lower after briefly breaking below $90,000 overnight (more on that below).
Asian stocks traded sharply lower in the aftermath of selling in the US yesterday. Japan and South Korea both fell over 3%, while Hong Kong was down closer to 2%, and China got off ‘easy’ with a fall of just 0.8%. The declines in Japan’s Nikkei and South Korea’s KOSPI now have those indices down over 6% from their respective highs, but Japan is still up over 22% YTD and South Korea is up over 60%, so they’re still handily outperforming the S&P 500.
Europe is also taking a defensive tone this morning as major indices in the region are all down between 1% and 2%. There’s been no real catalyst behind the move besides the overall risk-off tone across global markets.
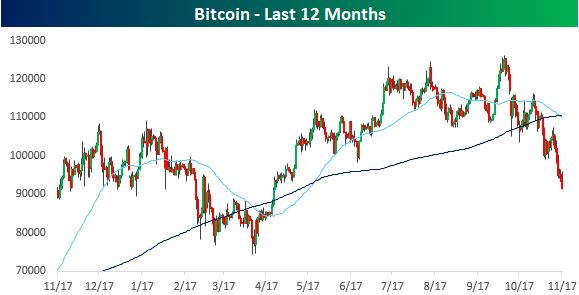
What people are willing to pay for Bitcoin today is a lot lower now than it was six weeks ago. After hitting record highs in early October, Bitcoin prices have been in free-fall, dropping more than 27% from their highs and to their lowest level since the tariff-tantrum in April. From a technical perspective, the 50-DMA has now crossed down through the 200-DMA, indicating a shift in the trend for crypto.
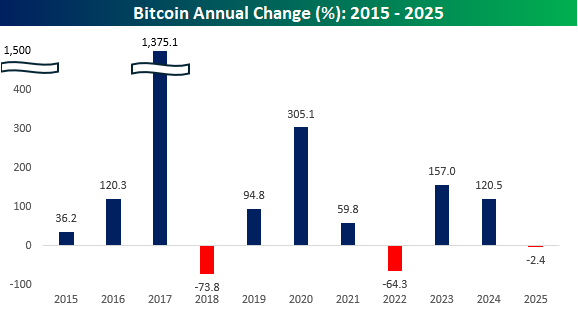
More notable about the recent weakness is that prices are now on pace for just the third down year since 2015. It’s been a painful six weeks, but if there’s any consolation, “HODLers” can take some comfort that this year’s decline is nowhere nearly as steep as the 64.3% decline in 2022 and the 73.8% decline in 2018.
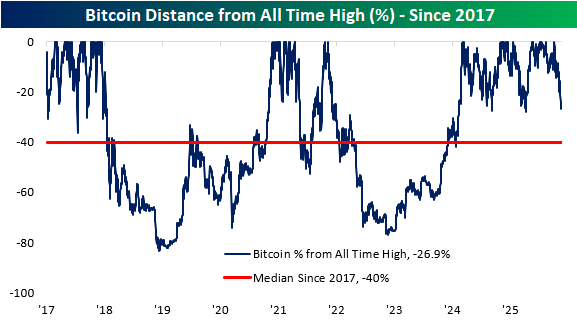
With a decline of around 27% from its recent high, Bitcoin’s decline has been contained, at least relatively speaking. The chart below shows Bitcoin’s historical drawdowns from record highs, and the current decline has been tame compared to the historical norms. Since 2017, on any given day, Bitcoin’s median decline from an all-time high has been 40%.
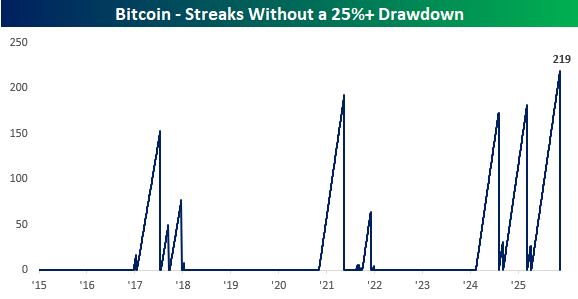
What’s notable about the recent decline is that, over the weekend, Bitcoin ended a streak of 219 days without trading in a 25% drawdown. That was the longest streak since at least 2015.
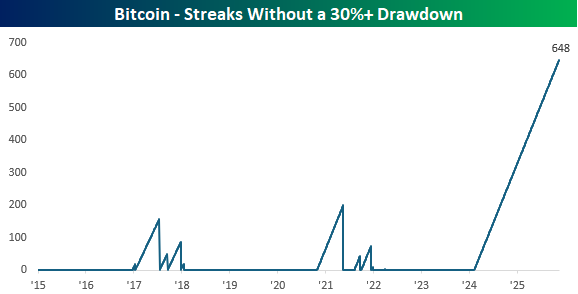
While Bitcoin’s just-ended streak without a 25% decline was historic, one could argue it’s even more overdue for a 30% decline. Through yesterday, Bitcoin has gone nearly 22 months without falling more than 30% from an all-time high, but it is getting close…
Nov 17, 2025
See what’s driving market performance around the world in today’s Morning Lineup. Bespoke’s Morning Lineup is the best way to start your trading day. Read it now by starting a two-week trial to Bespoke Premium. CLICK HERE to learn more and start your trial.
“There’s no such thing as simple. Simple is hard.” – Martin Scorsese
Below is a snippet of commentary from today’s Morning Lineup. Start a two-week trial to Bespoke Premium to view the full report.
It’s looking (for now) like another positive start to the week as S&P 500 and Nasdaq futures are indicated higher. We say for now, because the tone was much more positive before the sun came up on the East Coast. In fact, futures on the Dow have actually moved into negative territory while the Nasdaq’s gain has been whittled down to 0.25%. The primary driver of the Nasdaq’s gain is a 4% rally in Alphabet (GOOGL) following news that Berkshire Hathaway acquired 18 million shares during Q3.
After moving up as high as 4.15% on Friday, the 10-year yield is down over 3 bps to 4.11%, crude oil is flat and barely hanging on to $60 per barrel, gold is modestly lower, and Bitcoin is higher, reversing overnight weakness that took its YTD performance negative for the year.
The week started on a mixed note in Asia. South Korean stocks rallied close to 2% as Samsung and SK Hynix rallied, but Japan and China both traded lower on geopolitical concerns after China advised citizens not to travel to Japan following comments made by the new Japanese PM Takaichi, regarding Taiwan. JGB yields in Japan also moved higher as the 20-year yield hit its highest levels since 1999.
European stocks started off the week higher but have reversed lower since the open and are now down across the board as the STOXX 600 falls 0.5%, led lower by a 1% drop in Spanish stocks.
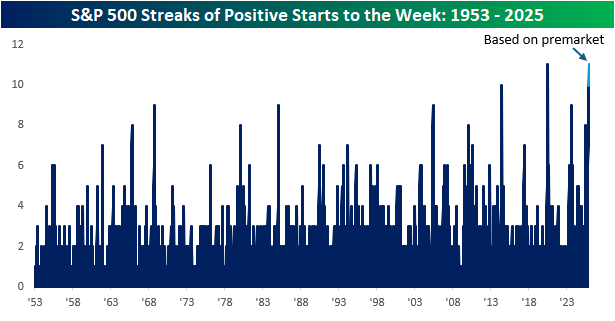
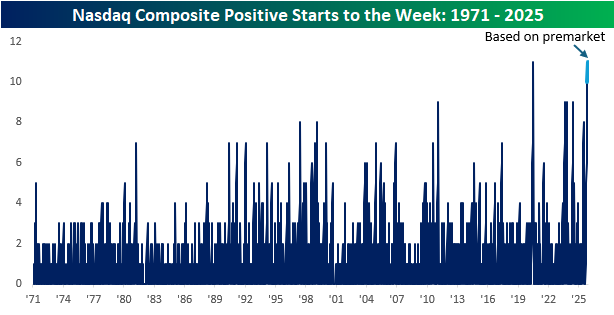
Futures don’t look as positive as they did earlier, but as of this writing, they’re still higher, and if that pace remains the case, it will be historic for both the S&P 500 and Nasdaq. Heading into this week, both indices have had positive returns on the first trading day of the week for ten straight weeks, which was one short of each index’s respective record streak from July 2020 coming out of the Covid crash lows.
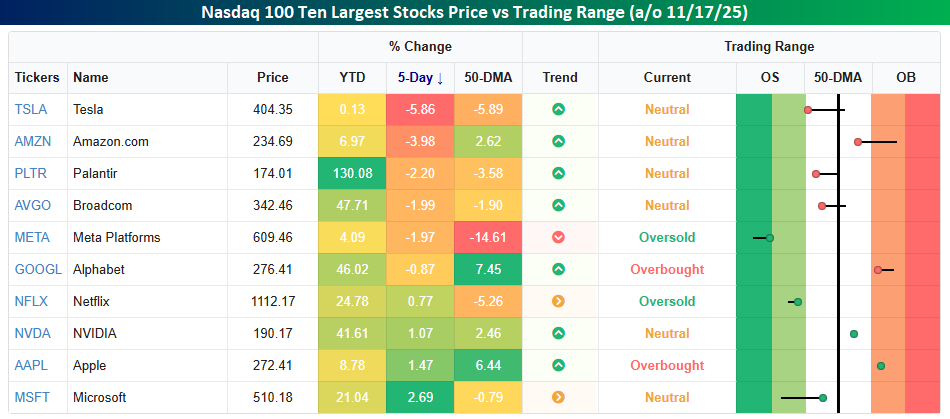
Within the Nasdaq, there’s been some bifurcation in returns lately. On a YTD basis, the ten largest stocks in the index are all still up, but the range of returns varies widely. Palantir (PLTR) easily leads the group with a gain of over 130%, but three others in the top ten are still up at least 40% YTD. Last week, though, returns were much more scattered. Led lower by Tesla’s (TSLA) decline of nearly 6%, five of the ten largest stocks in the index were basically down at least 2%. At the other end of the spectrum, Microsoft (MSFT), Apple (AAPL), and Nvidia (NVDA) were all up over 1%.
Relative to their respective 50-DMAs, the ten largest stocks are also all over the place. Meta (META) is an extreme as it closed out the week nearly 15% below its 50-DMA, but TSLA and Netflix (NFLX) are also more than 5% below their 50-DMAs as well. Meanwhile, two stocks in the S&P 500 – Alphabet (GGOGL) and AAAPL) – are more than 5% above their 50-DMAs.
Nov 14, 2025
See what’s driving market performance around the world in today’s Morning Lineup. Bespoke’s Morning Lineup is the best way to start your trading day. Read it now by starting a two-week trial to Bespoke Premium. CLICK HERE to learn more and start your trial.
“Beware of geeks bearing formulas.” – Warren Buffett
Below is a snippet of commentary from today’s Morning Lineup. Start a two-week trial to Bespoke Premium to view the full report.
Can we shut down the government again, already? After President Trump signed legislation into law on Wednesday night to reopen the government, stocks have done nothing but trade lower. On Thursday, the S&P 500 traded more than 1.5% lower, and this morning, futures are indicated to open down another 1% with the Nasdaq down even more (-1.6%). Oil prices are higher this morning following reports of a Ukrainian attack on a Russian port, but gold is lower, falling 2% to just over $4,100 per ounce. The most pain, however, is being felt in the crypto space, where Bitcoin is down another 3% to $95,000 and Ethereum is down 1.6% to $3,120. There’s no economic data on the calendar this morning, but we’ll hear from several Fed speakers who will likely shed further light on the direction of policy at the December meeting.
It was a bloodbath in Asian equity markets to close out the week as most major averages were down well over 1%, including South Korea, where, despite finalizing its trade deal with the US, the KOSPI fell 3.8% but still finished 1.5% higher on the week. Besides following through from yesterday’s weakness in the US, weak investment and industrial production data in China helped to drive the region’s decline.
European stocks are also closing out the week on a down note, but are still on pace to finish the week higher. The STOXX 600 is down over 1.5%, and every major country’s benchmark is down at least 1.5%. Eurozone GDP came in slightly higher than expected, while employment was in line with expectations.
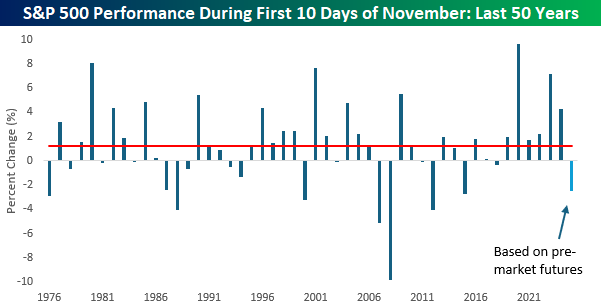
With S&P 500 futures trading down 1% in the pre-market, the S&P 500’s month-to-date decline will be right around 2.5% at the open today, and if that decline holds, it will be the weakest first 10 trading day start to November since 2017 (-2.7%), and after that, the worst was 4% in 2012. If there’s any consolation to the weakness, a weak start to November doesn’t necessarily mean bad things for the rest of the year. In the eight prior years over the last 50 that the S&P 500 traded down 2%+ in the first ten trading days of November, the median rest of year change was a gain of 2.2% with positive returns 75% of the time. For all other years, the median gain was 1.9% with positive returns 78% of the time.
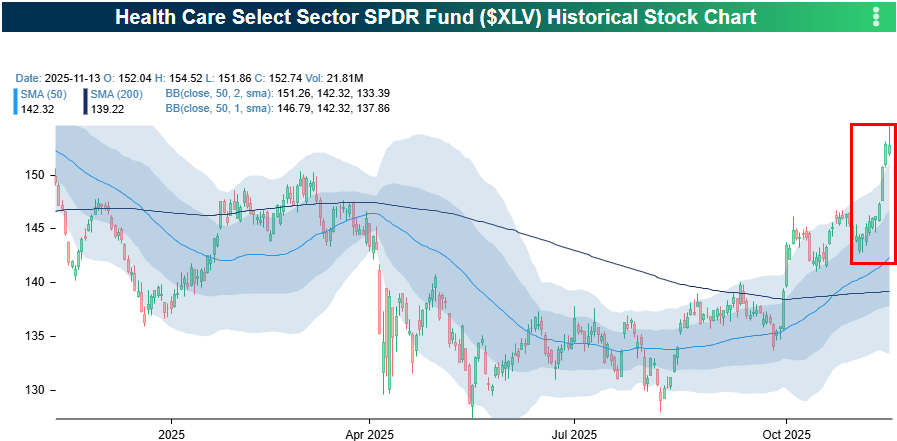
While the S&P 500 is down this week, one sector bucking the trend is Health Care. Through Thursday’s close, the sector was up 4.5%, which was more than twice the gain of the next closest sector (Materials). It’s been an impressive run lately for Health Care. After underperforming for most of the year, XLV has broken out to 52-week highs this week in what has been a buying frenzy. As shown on the right side of the chart, the sector has closed higher than it opened for 11 straight trading days!
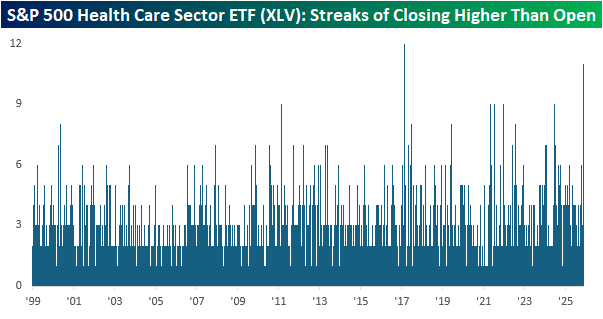
Over the past 11 days, the current streak of closes higher than the opening price in XLV ranks as the second longest in the ETF’s history. While there have been five other streaks of 9 days, the only streak longer than the current 11-day streak was a 12-day streak that ended in February 2017.
Nov 13, 2025
See what’s driving market performance around the world in today’s Morning Lineup. Bespoke’s Morning Lineup is the best way to start your trading day. Read it now by starting a two-week trial to Bespoke Premium. CLICK HERE to learn more and start your trial.
“We must go on, because we can’t turn back.” – Robert Louis Stevenson
Below is a snippet of commentary from today’s Morning Lineup. Start a two-week trial to Bespoke Premium to view the full report.
It’s over. After 43 days, the longest Federal Government shutdown has ended, and investors don’t know whether to smile or cry. While Washington was closed, the S&P 500 rallied 2.4% and the Nasdaq rallied 3.33%, but the Equal-weight S&P 500 was up just 0.1%, so maybe where you were invested depends on how you feel. Markets aren’t exactly sure how to react either, as equity futures trade modestly lower with the S&P 500 indicated to open down 0.1%. Treasury yields are modestly higher, which makes sense since all they do in Washington is spend money they don’t have. Meanwhile, crude oil is up fractionally after plunging below $60 per barrel yesterday, while gold and bitcoin rally.
In Asia overnight, major equity indices were higher across the board with gains of less than 1%. Loan data out of China was weaker than expected, while PPI in Japan rose less than expected, and employment data in Australia was better than expected.
In Europe, trading has been mixed. The STOXX 600 is down fractionally, led lower by Germany and the UK, while Italy, France, and Spain are all higher. Industrial Production in Europe missed by a lot in September as the year/year growth rate of 1.2% missed forecasts by nearly a full percentage point.
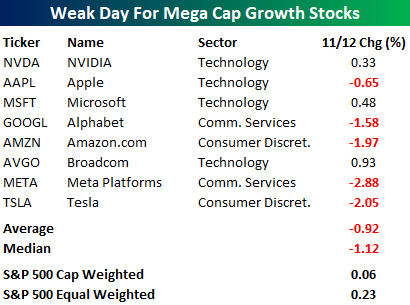
As the Dow rallied to a record high yesterday, the S&P 500 barely gained, and the Nasdaq finished down 0.26% as megacap growth stocks acted as a drag. Of the eight trillion-dollar market cap growth stocks, five finished down on the day, with four trading down over 1%. Their median decline was just over 1% compared to a gain of 0.06% for the cap-weighted S&P 500 and 0.23% for the equal-weighted index.
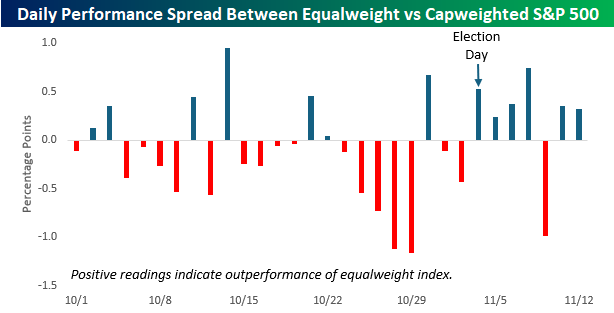
With no economic data to speak of, all anyone could talk about during the shutdown seemed to be the outperformance of the cap-weighted S&P 500 versus the equal-weight index. On 16 of the month’s 23 trading days, the equal-weight index underperformed the cap-weight index, and towards the later part of the month, the daily divergences were increasingly wide, with spreads of more than a full percentage point on 10/28 and 10/29. That certainly raised some eyebrows!
Just as the underperformance of the equal-weight index reached an extreme, though, the trend started to reverse, and so far this month, the equal-weight index has outperformed the cap-weighted index on six out of eight trading days. Since Election Day, when it became clearer that the shutdown was nearing an end, there has only been one day when the equal-weight index underperformed.
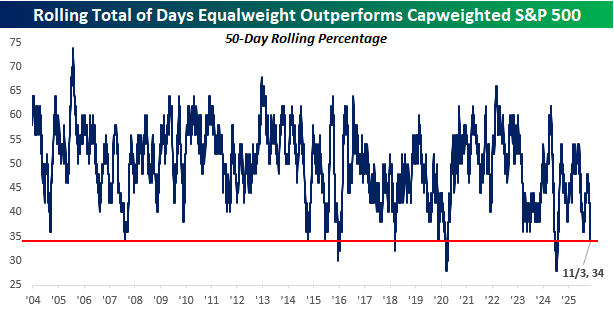
Even with the recent broadening of the market, the overall trend of the cap-weighted index outperforming has remained entrenched. The chart below shows the rolling 50-day percentage of days where the equal-weight S&P 500 outperformed the cap-weighted index. As of 11/3, the percentage dropped to 34% which was the lowest since last summer and a level that has only been breached to the downside a handful of other times in the last 20 years, with all of them occurring in the last ten years as markets have become more concentrated at the top.
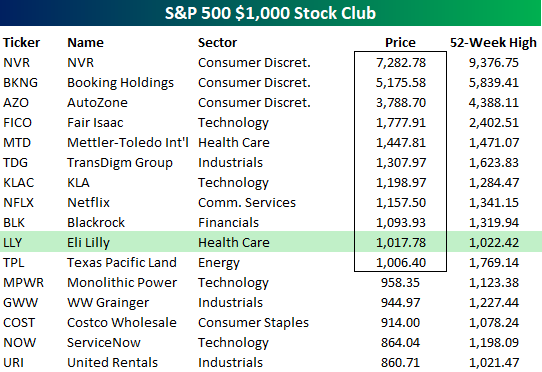
Another notable milestone was reached yesterday as the $1,000 stock price club gained another member when shares of Eli Lilly (LLY) rallied 3% to a record high of $1,017.78. At current prices, LLY is one of eleven companies in the S&P 500 with a four-digit share price, and one of 16 that have had a four-digit share price at some point in the last year. Homebuilder NVR (NVR) and travel company Booking Holdings (BKNG) both have share prices in excess of $5,000, and NVR even got within 6.3% of the five-digit club last November. Just like stock splits, share prices have no meaningful impact on the fundamentals of a company, and are more of a status symbol than anything else, but with the penny going away yesterday, we find it fitting that the $1,000 club got another member, and we only expect to see more in the years ahead. A thousand dollars isn’t what it used to be!
Nov 12, 2025
See what’s driving market performance around the world in today’s Morning Lineup. Bespoke’s Morning Lineup is the best way to start your trading day. Read it now by starting a two-week trial to Bespoke Premium. CLICK HERE to learn more and start your trial.
“Luck’s a revolving door, you just need to know when it’s your time to walk through.” – Stan Lee
Below is a snippet of commentary from today’s Morning Lineup. Start a two-week trial to Bespoke Premium to view the full report.
After two days of gains to start the week, futures are looking to make it a third as the S&P 500 trades up 0.4% while the Nasdaq jumps 0.6%. Treasury yields are lower after being closed for Veterans Day yesterday. Crude oil is down over 1% and back down to testing the $60 level, while gold and crypto trade higher with Bitcoin up over 2% and near $105K, while Ether surges 3.5% to just under $3,600.
Asian stocks were mostly higher overnight. South Korean stocks led the way as the ultimate high-beta country stock market rallied 1.1%, taking its week-to-date gain to 5%. It’s now less than 1.7% from its record closing high just over a week ago. The Nikkei was up 0.4% while China’s Shanghai Composite was down modestly (-0.1%) despite comments from the PBoC that it would maintain its appropriately loose monetary policy stance.
The rally in Asia made its way into Europe this morning, and the STOXX 600 is already up 0.7% in early trading. Most major benchmarks are more than 1% higher, while the UK’s modest decline sticks out like a sore thumb. German CPI rose 0.3% which was right in line with expectations and up from a rate of 0.2% in September, while the UK weakness has been driven by homebuilders after a warning from Taylor Wimpey.
Throughout the shutdown, there was a view that once Election Day passed, we would start to see some movement towards a resolution on the government shutdown. The idea was that Democrats wanted to use the shutdown as an election issue, so once the election passed, some members would cross the aisle. Sure enough, a week after Election Day, the Senate passed the resolution to fund the government, setting the stage for federal workers to get back to work.
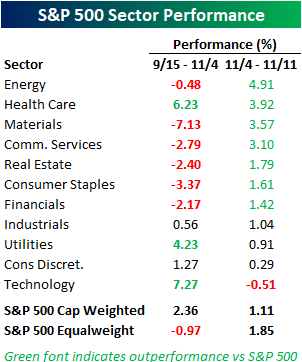
Election Day also served as a catalyst for the market to broaden out. The chart below shows sector performance from mid-September (when the odds of a shutdown on betting markets first exceeded 50%) through Election Day and then in the week since Election Day. During the shutdown period from 9/15 through 11/4, it was a narrow market rally as just three sectors outperformed the S&P 500, led higher by Technology, Health Care, and Utilities. Since Election Day, though, seven out of eleven sectors have outperformed the index as the market broadened out. As a result, the equal-weighted index has performed much better than the cap-weighted index, whereas it seriously lagged the cap-weighted index during the shutdown period.
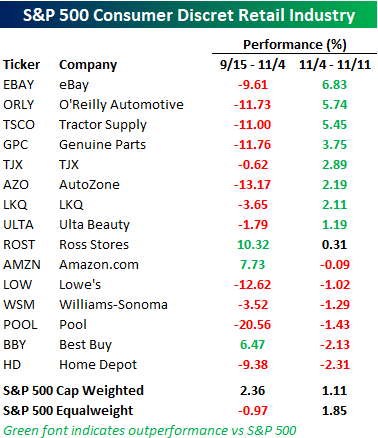
Stocks tied to the consumer have also rebounded. The table below shows the performance of stocks in the S&P 500 Consumer Discretionary and Retail Group during both the “shutdown period” and over the last week. During the shutdown period, just three of the 15 stocks in the group were up as investors avoided the group, as a large block of US consumers weren’t getting paid, and consumers overall retrenched given the uncertainty. On an average basis, they fell 5.7% compared to a gain of 2.36% for the S&P 500, which was driven higher by a handful of mega-cap names. Since Election Day, though, there has been a reversal in the performance of stocks tied to the consumer. 9 of the 15 stocks in the group have seen positive returns over the last week, and 8 of them have outperformed the S&P 500.
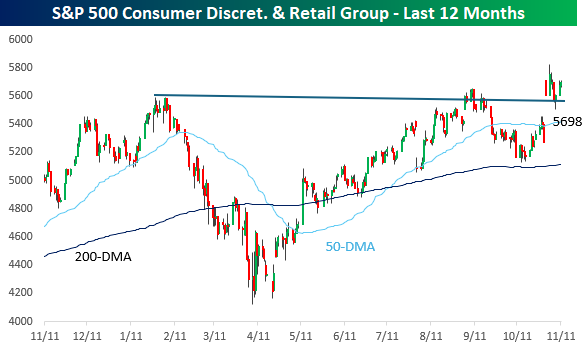
The group’s chart also looks positive. After hitting a marginal new high just before the shutdown, the group pulled back sharply towards its 200-DMA. After that successful test in mid-October, the group has erased all its initial shutdown declines and broken out to new highs and above resistance, forming what some technicians would describe as a positive cup and handle formation. We’ll drink to that!
Nov 11, 2025
See what’s driving market performance around the world in today’s Morning Lineup. Bespoke’s Morning Lineup is the best way to start your trading day. Read it now by starting a two-week trial to Bespoke Premium. CLICK HERE to learn more and start your trial.
“The test of success is not what you do when you are on top. Success is how high you bounce when you hit the bottom.” – George S. Patton
Below is a snippet of commentary from today’s Morning Lineup. Start a two-week trial to Bespoke Premium to view the full report.
Futures are in hangover mode after yesterday’s big rally to start the week, which put a dent in a good chunk of last week’s decline. At this point, S&P 500 futures indicate just a modest decline of 0.2% at the open, while the Nasdaq is down twice that. The Treasury market is closed for Veterans Day, but both crude oil and gold are up about 0.8% while cryptocurrencies are lower. In Europe, the STOXX 600 is up another 0.8%, while Asian stocks were mixed.
Judging by the metrics of General Patton’s quote above, the bounce of last April’s low was one of the most successful of all time, and even the bounce off last week’s test of the 50-DMA has, initially at least, been successful. On this Veterans Day, we want to thank anyone who has served in the US Armed Forces for their service. Everyone in the country appreciates their service.
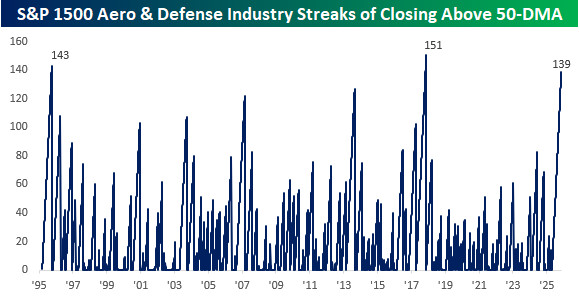
Given the Veterans Day holiday, we wanted to look at how aerospace and defense stocks have performed so far this year. From last November through early April, the group traded mostly sideways, so while it didn’t rally with the broader market to close out 2024, it didn’t feel much of the effects of the tariff-tantrum in March and April. Since those April lows, though, the sector has taken off and not looked back. Like the S&P 500, the group tested its 50-DMA last Friday but managed to bounce and stay above that level.
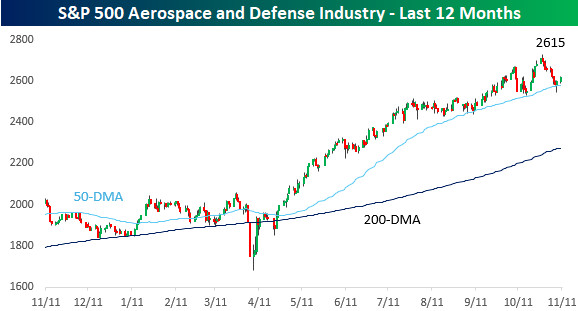
With the successful test of the 50-DMA, the Aerospace and Defense industry has closed above its 50-DMA for 139 trading days. That’s the longest streak since a record 151 trading days in 2017 and ranks as the third-longest in the last 30 years.