Mar 24, 2026
See what’s driving market performance around the world in today’s Morning Lineup. Bespoke’s Morning Lineup is the best way to start your trading day. Read it now by starting a two-week trial to Bespoke Premium. CLICK HERE to learn more and start your trial.
“I don’t trust society to protect us, I have no intention of placing my fate in the hands of men whose only qualification is that they managed to con a block of people to vote for them.” – Mario Puzo, The Godfather

Below is a snippet of commentary from today’s Morning Lineup. Start a two-week trial to Bespoke Premium to view the full report.
Paul Hickey will be on Making Money With Charles Payne today on Fox Business between 2 PM and 3 PM to discuss markets and the latest events in Iran. Check it out if you can!
Equity futures have been ping-ponging between gains and losses since the close yesterday, and they’re now on the red side of the table. Futures on the S&P 500 and Nasdaq are both down 0.1%. The 10-year yield has moved back to 4.36%, gaining 3 basis points. Oil prices moved back above $90 as investors try to figure out how things will play out in Iran. Good luck with that! Gold and other precious metals have seen muted moves this morning, with gains or losses of 1%, while Bitcoin has a fractional gain of 0.5%, taking it back above $71K.
It’s a relatively busy day for data this morning with Non-Farm Productivity and Unit Labor Costs at 8:30, but both reports are stale given the war situation. Investors will probably focus more attention on flash PMIs for March from S&P at 9:45 and the Richmond Fed at 10 AM. All of these reports will take a backseat to whatever geopolitical headlines or “truths” hit the tape.
European stocks were still open for trading yesterday when President Trump made his comments regarding Iran. Therefore, they had the opportunity to adjust, but this morning they’re adding modestly to those gains with the STOXX 600 up 0.3%. Flash PMI readings for March were also released. While manufacturing indices were better than expected, service sector PMIs generally missed.
Asian stocks played catch-up and followed the US lead overnight with gains across the board. Japan was up 1.4% while China rallied nearly 2%, and the Kospi gained 2.7%. The gains weren’t steady, though. In South Korea, for example, the KOSPI started the day with a gain of more than 4% but gave back all those gains early in the session and briefly traded lower before rebounding in the second half of the session. Inflation data in the region was on the light side as Japanese CPI and South Korean PPI for February both rose less than expected. While the lower inflation data was welcome, flash PMIs for Australia and India were both lighter than expected.
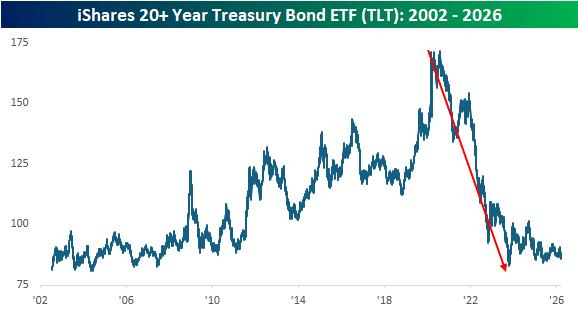
After falling more than 50% in price terms from its closing high in August 2020 to its low in October 2023, long-term US Treasuries, as proxied by the iShares 20+ Year US Treasury ETF (TLT), remain in the back half of a lost decade. As shown in the chart below, while prices remain near their multi-year lows, they have stopped going down, and with the long end of the curve yielding close to 5%, a flat market in price terms isn’t so bad.
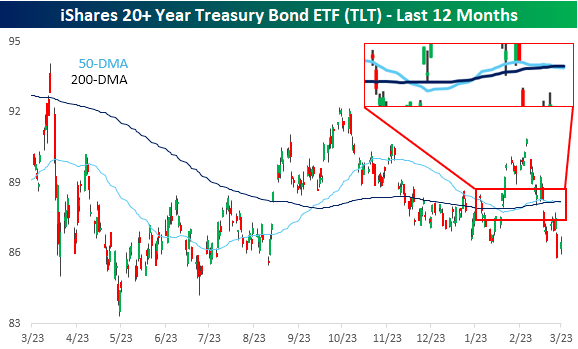
Looking at a one-year chart of TLT shows an interesting pattern. We’ve discussed the nowhere direction of the equity markets and some notable stocks like Nvidia (NVDA) extensively over the last several weeks, but the treasury market has also been comatose. Look at TLT’s 50 and 200-day moving averages (zoomed in on the inlay). Over the last several weeks, the two have moved in lockstep.
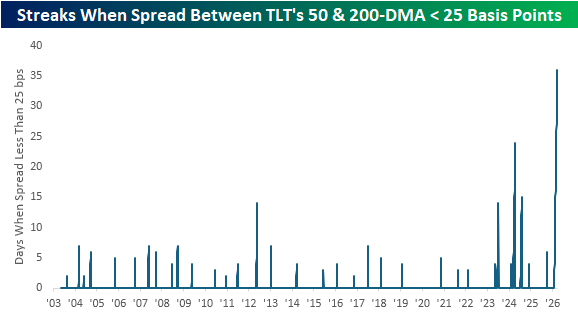
The two moving averages have been moving in such unison that yesterday was the 36th straight trading day the spread between the two was less than 25 basis points. Looking back at the ETF’s history over the last 20+ years, this current streak ranks as the longest in its history. It’s longer than the next closest one by more than two weeks! With the current spread between the two at less than 4 bps, it doesn’t appear likely to widen out to more than 25 bps any time soon!
Mar 23, 2026
See what’s driving market performance around the world in today’s Morning Lineup. Bespoke’s Morning Lineup is the best way to start your trading day. Read it now by starting a two-week trial to Bespoke Premium. CLICK HERE to learn more and start your trial.
“Appear weak when you are strong, and strong when you are weak.” – Sun Tzu
Below is a snippet of commentary from today’s Morning Lineup. Start a two-week trial to Bespoke Premium to view the full report.
Asian stocks plunged overnight, Europe was lower, and US futures were in the red about an hour ago, but all it took was one Truth Social Post to erase those losses and push stock futures firmly into the green. The S&P 500 and Nasdaq are both on pace to gap up more than 1.5% at the open, and European stocks are up by about 1%. Treasury yields are modestly lower, but the 10-year yield is still at an uncomfortably high 4.39%. After trading higher earlier, crude oil is down 7% to just under $92 per barrel. Gold is still trading down by close to 4%, sitting at $4,400 per ounce. At the end of January, it was more than $1,000 higher!
After last week’s declines, the Nasdaq finished lower for the fourth week in a row and the ninth week in the last ten. For ten weeks, that’s the fewest positive weeks since June 2022 and before that, July 2002. In the Nasdaq’s entire history, there have only been eight other periods when the Nasdaq declined for nine or more weeks in ten weeks, and only one of those periods saw the Nasdaq go ten straight weeks with declines.
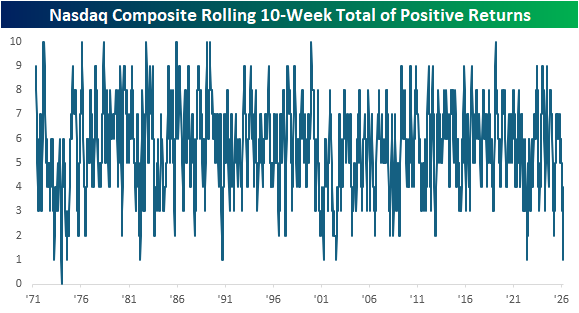
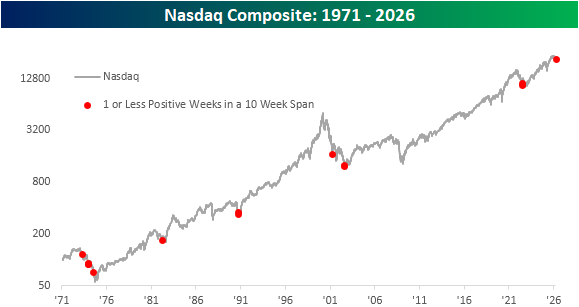
Below, we show when each of these prior periods occurred on a long-term chart of the Nasdaq. Outside of the period in the mid-1970s, these other occurrences all came in the later stages of market declines. That sounds like good news, but a counter to that is that the only other time the Nasdaq declined for nine weeks in a ten-week span and was still so close to 52-week highs was in that early 1970s period.
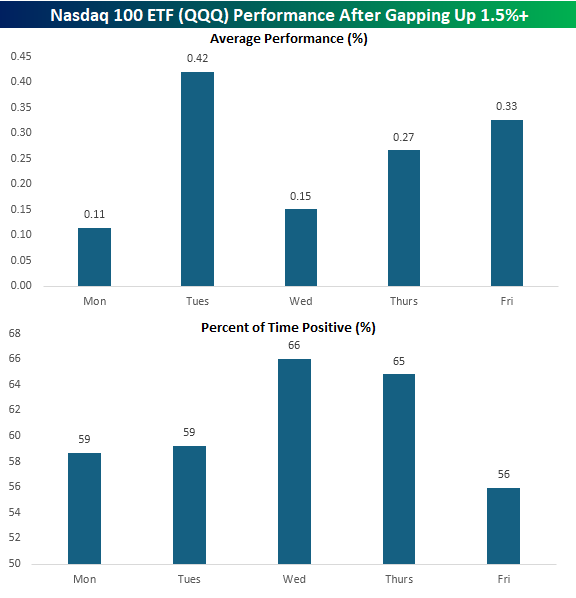
While it was looking like another negative start to the week earlier, futures took a sharply positive turn after the President’s Truth Social post saying that the US and Iran had engaged in conversations “regarding a complete and total resolution” of hostilities. As a result, the Nasdaq 100 ETF (QQQ) is on pace to gap up 1.5% at the open. If those gains hold through the open, it would be the first 1.5%+ upside gap for QQQ this year and the 266th since the ETF’s inception in 1999.
The chart below shows QQQ’s average performance from the open to close after gapping up 1.5%+ at the open based on the day of the week it occurred. Of the 46 that occurred on a Monday, QQQ’s average performance from the open to close was a gain of 0.11% with positive returns 59% of the time. While positive, that ranks as the worst performance from the open to close following a 1.5%+ upside gap of any other weekday.
Mar 20, 2026
See what’s driving market performance around the world in today’s Morning Lineup. Bespoke’s Morning Lineup is the best way to start your trading day. Read it now by starting a two-week trial to Bespoke Premium. CLICK HERE to learn more and start your trial.
“The longest way must have its close – the gloomiest night will wear on to a morning.” ― Harriet Beecher Stowe
Below is a snippet of commentary from today’s Morning Lineup. Start a two-week trial to Bespoke Premium to view the full report.
A negative week is on pace to finish with a negative session as the S&P 500 looks to finish lower for the fourth week in a row and the sixth down week in the last seven. S&P 500 and Nasdaq futures are both down about 0.5% but off their overnight lows. Where we close, though, will depend almost entirely on the price of oil, which is down 1% to $95.15 per barrel. Treasury yields are modestly higher, with the 10-year yield just under 4.3%, while gold is up 1.3% and Bitcoin is holding above $70K.
In Asia overnight, most major equity indices in the region were lower, although the KOSPI rallied 0.3% to finish up 5.4% for the week. In Europe, we’re seeing more muted performance to close out the week. The STOXX 600 is down 0.1%, which would put it down more than 2% for the week, but Spain has bucked the negative trend, rallying 1% today and putting it into positive territory for the week.
There’s no economic or major earnings data on the calendar today, so geopolitical headlines will dictate the market’s performance.
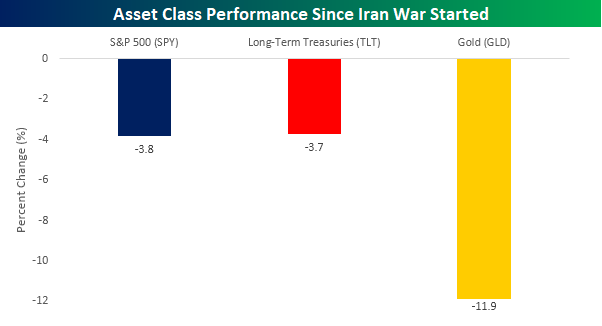
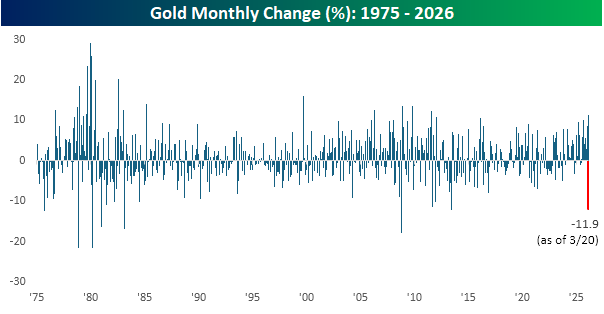
Heading into today’s session, the S&P 500 is down nearly 4% this month, which is unsurprising given the war in the Middle East. It’s only natural in times of geopolitical uncertainty for investors to move out of riskier assets into the safety of treasuries or even gold, the ultimate port in geopolitical storms. So, how are those two asset classes doing this month? Long-term treasuries, as proxied by the iShares 20+ Year Treasury ETF (TLT), are down 3.7%, which is basically in line with the S&P 500, while gold (GLD) is down more than triple either of the other two, with a decline of 11.9%. Just when you think you have it all figured out.
Gold’s double-digit percentage decline this month is on pace for the largest monthly decline in the commodity since June 2013 and, if it holds, would rank as the eighth largest one-month decline in gold since at least 1975. What’s even more interesting is that this month’s decline follows a double-digit percentage gain in February.
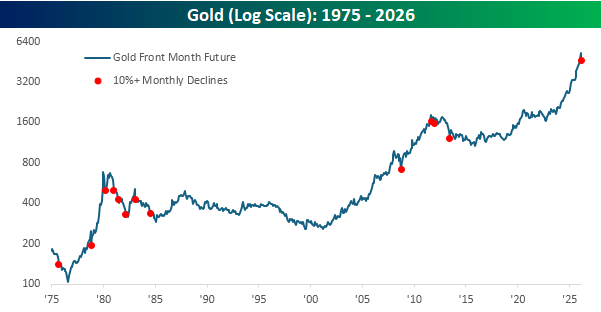
The chart below shows gold’s performance since 1975, and each red dot shows months when it declined 10% or more. Most of these declines occurred either early on or well into longer-term downtrends. There were some exceptions, though. The decline in October 2008 occurred right near the low for that period, and after the decline in November 1978, gold more than tripled over the next year.
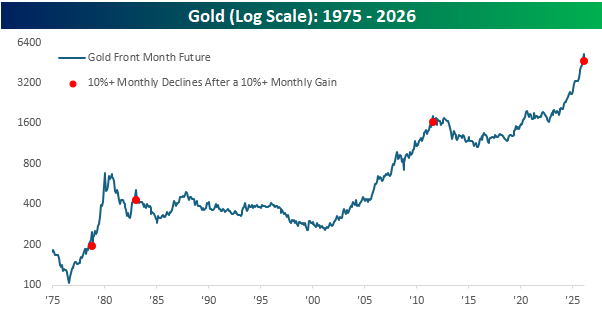
Looking at just the periods when gold declined by at least 10% following a double-digit percentage gain. Here, the sample size is much smaller, with just three other occurrences. The two most recent, in 2011 and 1983, were followed by years of weakness, while the one other occurrence in 1978 was the one period where gold quickly tripled.
Mar 19, 2026
See what’s driving market performance around the world in today’s Morning Lineup. Bespoke’s Morning Lineup is the best way to start your trading day. Read it now by starting a two-week trial to Bespoke Premium. CLICK HERE to learn more and start your trial.
“If you don’t understand what the professor is saying, don’t dismiss the possibility that he might be wrong.” – Paul Volcker
Below is a snippet of commentary from today’s Morning Lineup. Start a two-week trial to Bespoke Premium to view the full report.
After a relatively strong start to the week, where it looked like the market would be able to look past the spike higher in energy prices, continued tensions in the Middle East and the stubbornly high level of crude oil prices have pushed the S&P 500 back into the red for the week, with further downside in store for today. S&P 500 futures are trading down 0.4%, which would put the S&P 500 below its 200-day moving average (DMA). The Nasdaq, which already closed below its 200-DMA yesterday, is expected to add to that breakdown with a decline of 0.5%.
International markets had a terrible night, with most major averages in the region down at least 2% and in most cases much more. That’s the same trend in Europe as well, with the STOXX 600 down over 2%, as is the case with most indices in the region.
As we’ve been pointing out all along, the declines are all about energy prices, and this morning, they’re not helping out as WTI trades up 2% to more than $98 per barrel, while Brent trades up by nearly 7% to $115 per barrel. The spread between Brent and WTI is now a monstrously high $16+ per barrel.
Treasury yields are moving higher as investors fear the inflationary impacts of rising energy prices, and the 10-year yield is now testing 4.3%. Gold prices are plunging more than 5% to under $4,700 per ounce, and Bitcoin is back below $70K.
The economic calendar is relatively busy this morning with jobless claims and Philly Fed at 8:30, while New Home Sales and Wholesale Inventories will hit the tape at 10 AM. Jobless claims came in lower than expected on an initial basis but slightly higher than expected on a continuing basis, while the Philly Fed was actually better than expected. With everything going on in the Middle East, though, the data is basically meaningless.
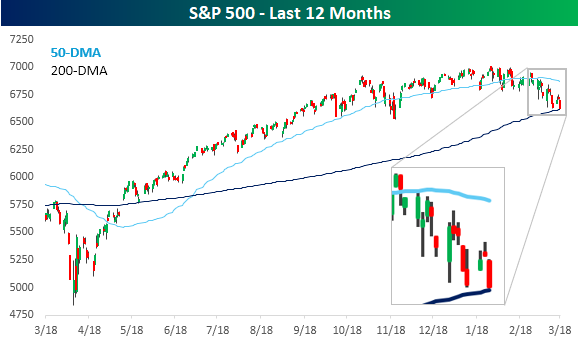
As the quote of the day notes, in many aspects of life, change has a way of happening slowly and then all at once. For months, the S&P 500 has been trading in a sideways range, consolidating the gains from the April lows. Then, all of the sudden we have a day like yesterday where the S&P 500 sells off a not necessarily dramatic 1.4%, but then all of the sudden, we’re looking at an S&P 500 whose 50-day moving average (DMA) has just started to slope downward just as the index is on the verge of trading below its 200-DMA for the first time since last spring. Steady uptrend to sideways range and now a potential downtrend? Change happens slowly until it doesn’t.
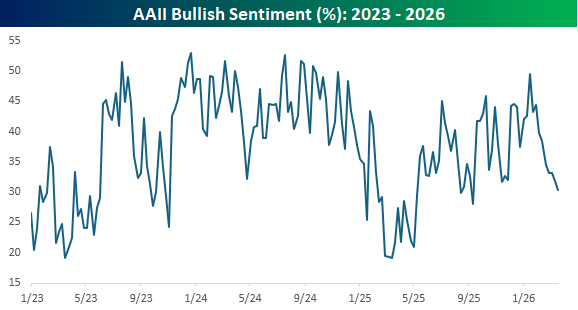
With the S&P 500 slowly (and now more suddenly) trending lower, investor sentiment has also been on the decline. In the latest survey from the American Association of Individual Investors (AAII), bullish sentiment declined from an already low level of 31.9% to 30.4%, which is the lowest level since last September, as the uptrend in sentiment since the lows early last year has been firmly broken.
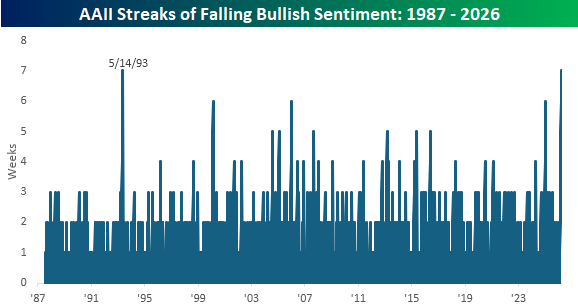
With this week’s decline, bullish sentiment has now declined for a record seven straight weeks. That’s now tied with the seven-week streak from May 1993 for the longest weekly losing streak in the survey’s history. Behind these two streaks, there were three others (Feb 2000, Jan 06, and Jan 2025) that lasted six weeks. Based on how the market traded yesterday, if we don’t see an improvement in the next couple of days, we would expect that this current streak could move into first place all on its own.
Mar 18, 2026
See what’s driving market performance around the world in today’s Morning Lineup. Bespoke’s Morning Lineup is the best way to start your trading day. Read it now by starting a two-week trial to Bespoke Premium. CLICK HERE to learn more and start your trial.
“If you don’t understand what the professor is saying, don’t dismiss the possibility that he might be wrong.” – Paul Volcker
Below is a snippet of commentary from today’s Morning Lineup. Start a two-week trial to Bespoke Premium to view the full report.
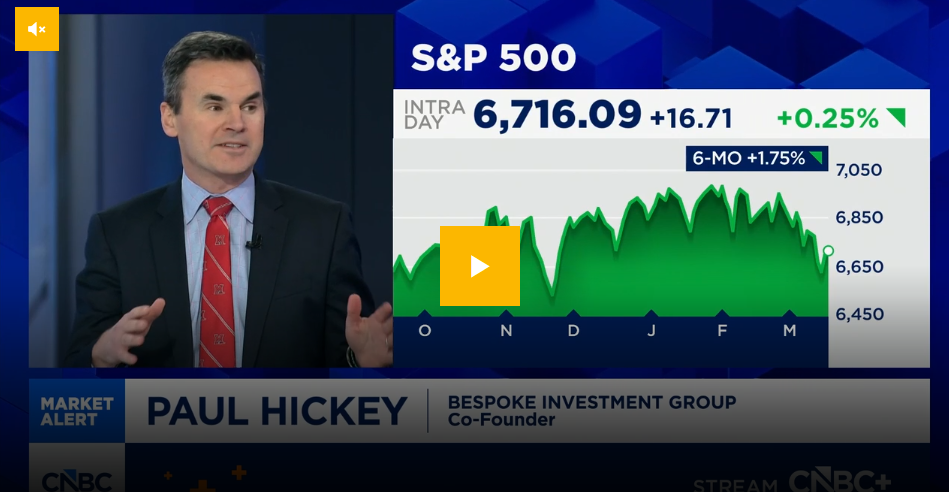
Paul Hickey appeared on CNBC Overtime yesterday to discuss the sideways trending market and volatility underneath the surface. To view the segment, click on the image below.
Futures are still green, but they have given up most of their earlier gains as we approach the opening bell. It appears some of the weakness may be tied to reports of a strike on some Iranian energy facilities. Conversely, oil prices are lower but have erased most of their earlier losses. Treasury yields are basically unchanged, gold is down close to 2%, while Bitcoin is down over 2% and back below $73K.
Equities in Asia had a very strong session overnight, with the Nikkei up 2.9%, while South Korea surged 5.0%. Other major indices in the region were also green but by less than 1%. Catalysts behind the move include a lack of continued upside in oil prices, stronger-than-expected export orders in Japan, and positive comments from Samsung related to AI chip demand being strong.
European stocks have also started the day on a positive note, with the STOXX 600 up 0.6%, led higher by Spain, Italy, and France, which are all up over 1%. Besides lower oil prices, February CPI also rose less than expected (0.6% vs 0.7%). Tomorrow, we’ll also get policy decisions from the ECB, BoE, and SNB.
The economic calendar is busy this morning with PPI at 8:30, followed by Factory Orders and Durable Goods at 10 AM Eastern. After that, attention will shift to the FOMC, where Powell & Co are widely expected to leave rates unchanged at 2 PM. Investors will be focused on the press conference and summary of economic projections, but with all the uncertainty around oil supplies, take them with a grain of salt. The PPI just hit the tape and the numbers were much higher than expected, so that has pushed futures into negative territory.
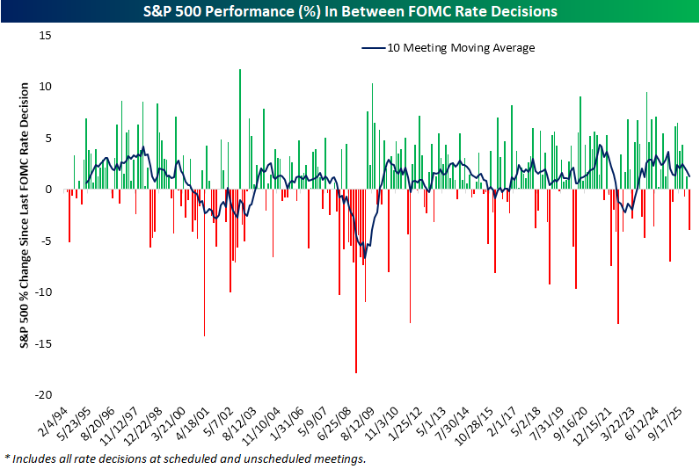
In our FOMC meeting preview report sent out yesterday, we highlighted some of the key trends surrounding Fed days. The report included an overview of the market’s performance leading up to meetings and how it performs on the day of the announcement, how the market performs based on what the FOMC does (or doesn’t do), as well as how it performs on an intraday basis based on different scenarios.
One of the charts included showed the performance of the S&P 500 between FOMC meetings, and heading into today’s announcement, the S&P 500 is down about 4% since its last meeting in January. As shown, that ranks as the worst inter-meeting performance in a year and also ranks in the 15th percentile of all inter-meeting periods since 1994, when the Fed first started announcing its rate decisions on the day of its meetings. It gets worse than the last six weeks, but not much worse!
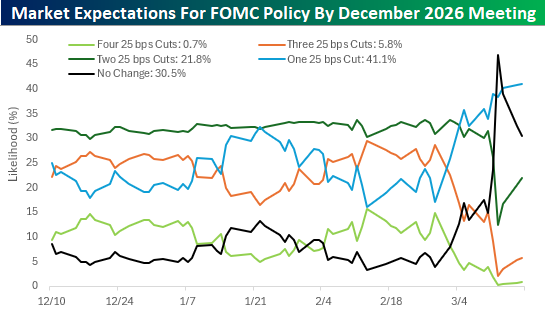
The market is currently pricing in a greater than 99% likelihood of no change in rates by the Fed today, and with the war in Iran taking center stage, there is not likely to be nearly as much attention put on Powell’s penultimate press conference this afternoon. When it comes to policy, though, there have been some major shifts in market expectations for policy between now and the last meeting for 2026 in December.
The chart below shows the change in expectations for various policy levels since the Fed last cut rates in December. While the market is currently pricing in an almost one in three chance of no change in rates between now and December, less than three weeks ago, the market was pricing in a less than 5% chance of no change in rates. Instead, the odds were heavily on cuts with a 41% chance of two cuts, a 29% chance of three cuts, a 15% chance of four cuts, and just a 17% chance of only one cut. Today, the trend has completely reversed. There’s now a greater than 70% likelihood of one cut or less, and barely more than a one in four chance of two or more cuts.
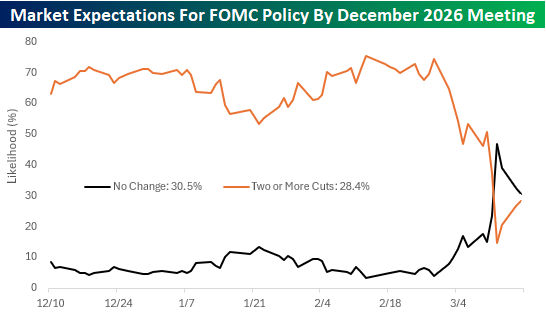
To show the shift more clearly, the chart below shows the change in market pricing for no change in rates versus two or more cuts. For three months, market expectations were pretty steady, but then that quickly changed at the end of February with one word – Iran.
Mar 17, 2026
See what’s driving market performance around the world in today’s Morning Lineup. Bespoke’s Morning Lineup is the best way to start your trading day. Read it now by starting a two-week trial to Bespoke Premium. CLICK HERE to learn more and start your trial.
“Competitive golf is played mainly on a five-and-a-half-inch course… the space between your ears.” – Bobby Jones
Below is a snippet of commentary from today’s Morning Lineup. Start a two-week trial to Bespoke Premium to view the full report.
As hard as the bears have been working to push futures lower overnight and this morning, the luck of the Irish won’t quit and has pushed futures on the S&P 500 and the Dow into the green. The Nasdaq isn’t quite there, but it is well off its overnight lows. Treasuries are modestly higher, pushing yields slightly lower, while crude oil rebounds more than 2% to $95 per barrel. Gold prices are fractionally higher, and Bitcoin is basically flat.
It’s a quiet day for economic data today, with Pending Home Sales and Leading Indicators the only two reports on the calendar, and both will be released at 10 AM.
In international markets, Asian stocks were mixed overnight, while Europe is mostly higher, with the STOXX 600 up 0.5%. Those gains come despite ZEW Economic Sentiment Indices coming in significantly weaker than expected, as concerns over the war in Iran weigh on sentiment.
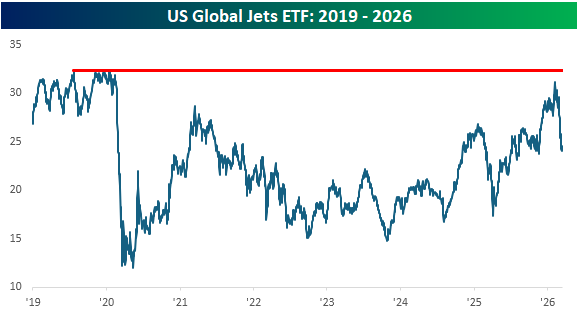
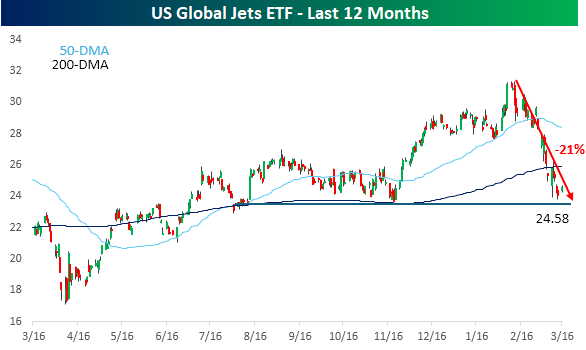
Can it get any worse for airline stocks? After already dealing with the government shutdown where TSA agents aren’t getting paid, the war with Iran has caused jet fuel prices to double and raised the threats of terrorism, which, at the margin, causes travel plans to decline. Since its peak in early February, the US Global Jets ETF (JETS) has plunged more than 20%, effectively erasing the gains from late last year after it broke out of a multi-month trading range. At $24.58, the ETF closed yesterday right near support at the low end of that prior range.
With all the headwinds facing the sector, it’s not looking like the Q1 earnings season is a period that airlines are looking forward to. Despite that backdrop, it was surprising to see comments from Delta CEO Ed Bastian this morning where he said that despite the negative impact of rising energy prices on company margins, the weakness has been completely offset by exceptionally strong demand. In his interview on CNBC, Bastian noted that “We’ve seen eight of the top 10 sales days in our history this quarter, and five of those just within the last two weeks, within just the last week of March”. With demand like that, we can only imagine what the company’s quarterly results would have looked like had there not been a war!
Looking at the airline stocks from a longer-term perspective, the timing of the Iran war couldn’t have been worse. At its recent peak in February, the JETS ETF traded above $31 and was within a dollar of its pre-Covid highs. It’s been a long slog for the sector, but after more than six years, it’s almost back to even.