Apr 1, 2026
See what’s driving market performance around the world in today’s Morning Lineup. Bespoke’s Morning Lineup is the best way to start your trading day. Read it now by starting a two-week trial to Bespoke Premium. CLICK HERE to learn more and start your trial.
“I felt that if I stayed with them I would probably end up being the richest man in the cemetery.” – Ron Wayne, Co-Founder, Apple (AAPL)

Below is a snippet of commentary from today’s Morning Lineup. Start a two-week trial to Bespoke Premium to view the full report.
Wait, is this some upside follow-through the market is seeing this morning? Equity futures are firmly higher this morning as the S&P 500 is indicated to open 0.9% higher, while the Nasdaq is up over 1%. Treasury yields are lower, with the 10-year yield down below 4.3%, while crude oil is down 3% to $98.5 per barrel. Brent crude, more sensitive to Iran events, is also down 2.5% to $101.4. That price is way below the levels it was quoted at yesterday, but that’s because the contract rolled overnight. Gold prices are up 2.5% to more than $2,760 per ounce, and Bitcoin is up over 1%. If these levels can hold into the end of the trading day, bulls will likely start to feel a bit more emboldened.
What a night the markets had in Asia. Markets in the region were sharply higher with the Nikkei surging 5.2%, and if you think that was impressive, look at the 8.4% rally in South Korea! Besides rebounding on the overall global relief rally on signs of a potential withdrawal from Iran, officials in South Korea noted that the country has ample supplies of helium and ethylene to last through the first half of the year. PMI Manufacturing reports for the region all remained in contraction territory, suggesting that the region’s economy is withstanding the impacts of the Iran war for now.
European markets were mostly closed when markets surged higher yesterday afternoon, so they played catch-up today. The STOXX 600 is up over 2%, as is the case with every regional market, including Italy and Spain, which are both up over 3%. Here again, PMI Manufacturing indices for the region were mostly positive, with Spain being the only notable laggard as it dipped into contraction territory.
Turning back to the US, it’s a busy morning for economic data with ADP Employment (higher than expected: 62K vs 40K forecast), Retail Sales (better than expected), Manufacturing PMIs, and Business Inventories all on the calendar. Besides those releases, we’ll also hear from a few Fed speakers and get auto sales for March throughout the day.
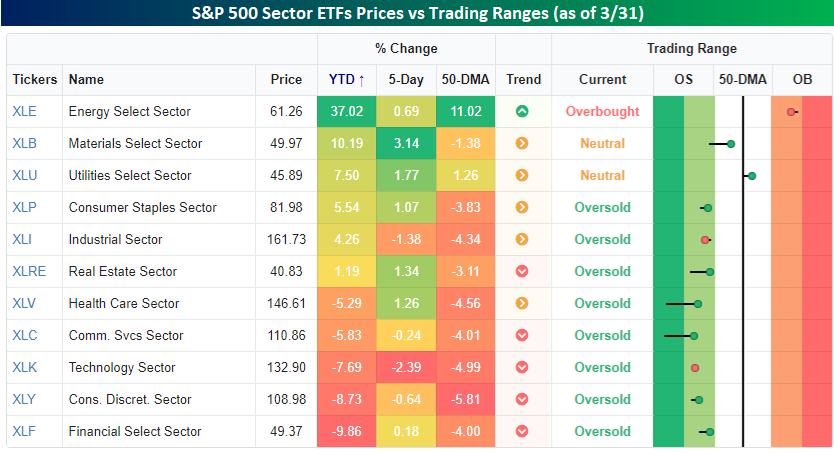
2026 is now behind us, and already it’s been an eventful year for the world and the markets. Our focus here is on markets, so we’ll start with what’s going on in the US, and specifically the S&P 500. The snapshot below from our Trend Analyzer shows the performance of the eleven different sector ETFs during Q1 and where they closed relative to their trading ranges.
Starting with performance, it has been one of, if not the widest, performance gaps between the top and bottom performing sectors in Q1 that we can remember. Topping the list, Energy (XLE) has rallied more than 37% this year, while Financials (XLF) is down just under 10%. While the S&P 500 is down more than 4% this week, just over half of all sectors finished higher in Q1, while five declined. Interestingly or unfortunately, depending on your perspective, all the sectors that are lower YTD have declined at least 5%. At the other end of the spectrum, four of the six sectors that are higher YTD are up more than 5%. The only two sectors that haven’t rallied or declined more than 5% are Industrials (XLI) and Real Estate (XLRE). Talk about the haves versus the have-nots!
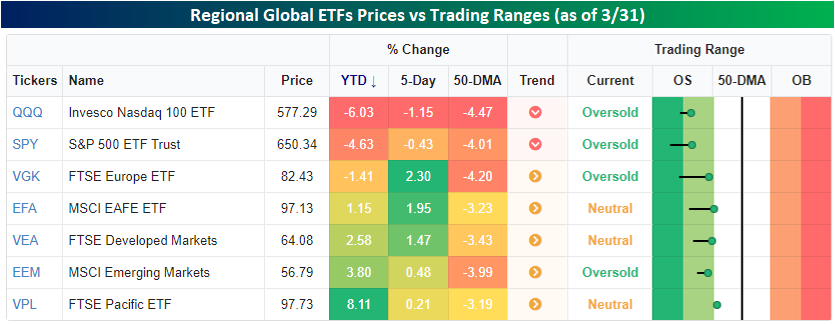
Looking out across the world, US stocks have outperformed their global peers since the war started at the end of February, but on a YTD basis, global stocks have still outperformed. As shown below, the Nasdaq 100 (QQQ) and S&P 500 (SPY) finished the first quarter down 6.03% and 4.63%, respectively, while most other regional ETFs are all higher, except Europe (VGK), which is down just 1.41%. Regardless of the paths they have taken in the first three months of the year, they all finished Q1 in either oversold territory or just barely outside of it.
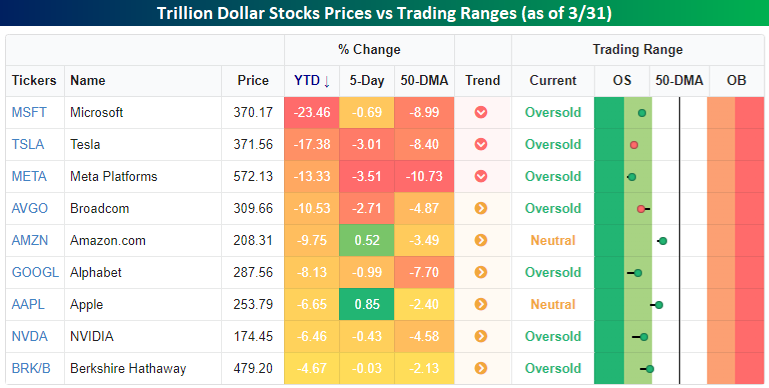
Finally, a newsflash. Remember the days when the mega-caps traded as a monolith in terms of their outperformance relative to the rest of the world? In 2025, the correlation between the trillion-dollar stocks started to break down as they went their separate ways. In Q1, the mega-caps returned to more of a positive correlation in that they all underperformed the S&P 500 in the quarter. While the degree of underperformance varied widely, the fact that all nine of these stocks, which account for nearly 40% of the entire index, suggests that the other 491 have done just fine. In fact, they finished the quarter with an average gain of 1.02%!
Mar 31, 2026
See what’s driving market performance around the world in today’s Morning Lineup. Bespoke’s Morning Lineup is the best way to start your trading day. Read it now by starting a two-week trial to Bespoke Premium. CLICK HERE to learn more and start your trial.
“I try not to worry about things I can’t do anything about.” – Christopher Walken
Below is a snippet of commentary from today’s Morning Lineup. Start a two-week trial to Bespoke Premium to view the full report.
Sometimes the headlines make you scratch your head. This morning, equity futures are sharply higher with the rally attributed to a Wall Street Journal report that “Trump Tells Aides He’s Willing to End War Without Reopening Hormuz”. As we highlight below, stocks have been following the lead of oil prices at an unprecedented rate over the last several weeks, and if the US just walked away from the Middle East with the Strait still blockaded, energy markets would likely remain incredibly supply-constrained, keeping prices high. The longer prices are high and supplies are limited, the worse it’s going to be for the global economy and ultimately stock prices.
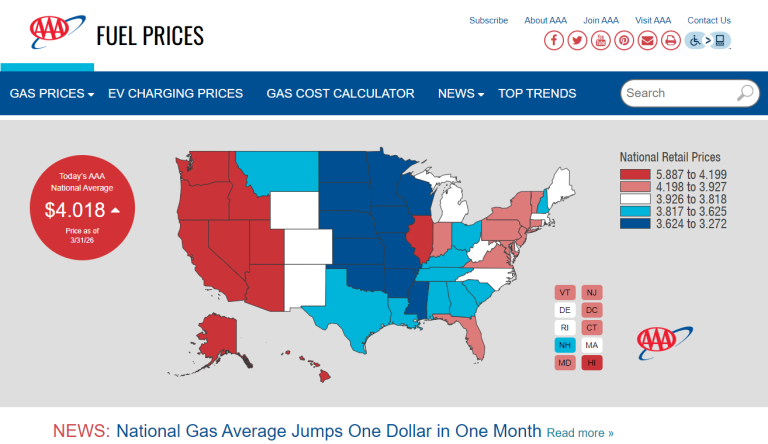
Just today, the national average price of a gallon of gas is above $4 for the first time since 2022, and as shown in the image below, it has increased by more than a dollar in just the last month.
Regardless of the reason, equity futures are up about 1% this morning, treasury yields are lower, and crude oil is slightly higher. Again, higher oil prices in this environment are negative for equity prices, and the gains we are seeing in futures may be nothing more than rebalancing ahead of quarter-end. Gold prices are up over 1%, and Bitcoin has seen a fractional gain.
We’re still in the ‘shoulder season’ for earnings, but it’s a busy day for economic data. At 9:45, we’ll get the Chicago PMI for March, followed by Consumer Confidence and JOLTS at 10 AM. The Chicago PMI and Consumer Confidence reports are both for March, so they will give some of the first reads on how the war has impacted economic and consumer sentiment.
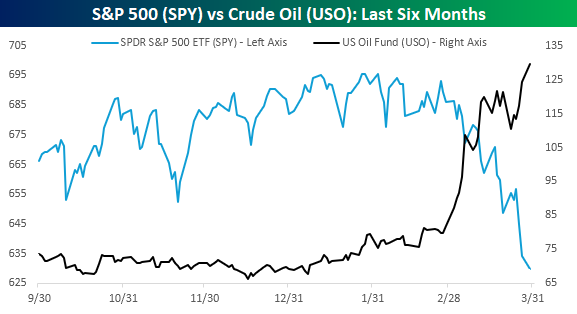
If you want to know the direction of the equity market these days, look at crude oil and go with the opposite. It’s become cliché, but it also hasn’t been truer at any point in at least the last 20 years. Just look at the performance of the SPDR S&P 500 ETF (SPY) compared to the US Oil Fund (USO) over the last six months. The two series have mirrored each other.
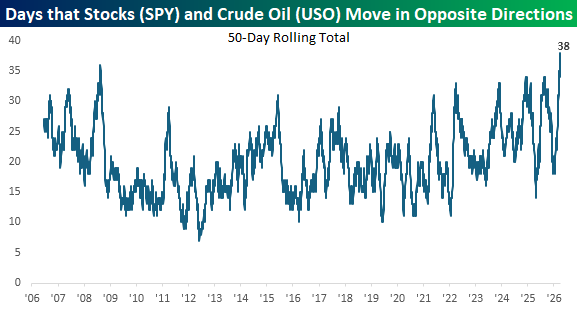
USO launched in 2006, and we compared the daily direction of the ETF and SPY for every trading day since its inception. The chart below shows the rolling 50-day total of the number of days that the two ETFs moved in opposite directions on the day. In the most recent 50-trading-day period, when USO zigged, SPY zagged 38 times, or 76% of all trading days. In the ETF’s history, its daily moves have never been more inversely correlated to the direction of SPY. The only other time the number of occurrences even approached current levels was back in August 2008. Ironically, that was also part of the price spike when crude oil first crossed $100, ultimately peaking above $147.
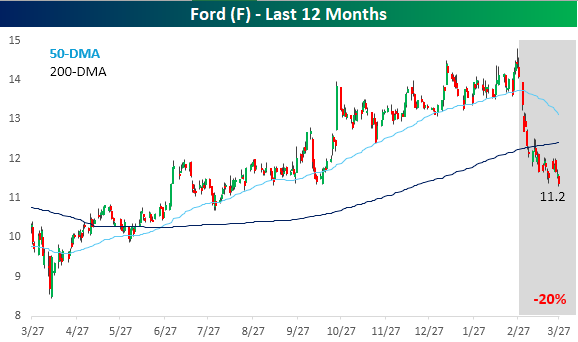
One sector that has felt the pain of higher oil prices is the traditional auto OEMS. Just moving alphabetically down the list, shares of Ford (F) had performed exceptionally well leading up to the war, with shares in a steady uptrend and trading at 52-week highs on the eve of the first missiles being fired. Since then, it’s down 20%.
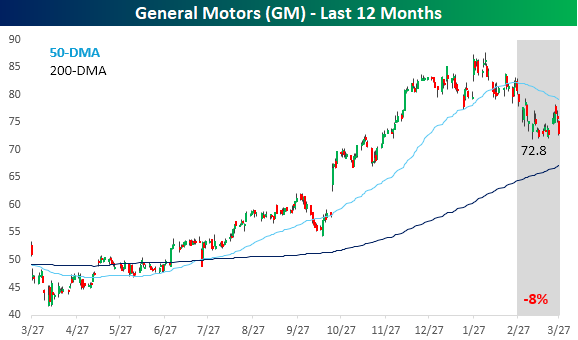
General Motors (GM) performance leading to the war was also very strong, and even though it wasn’t’ right at 52-week highs, shares were up more than 70% in the prior year. Shares have declined more than 17% from their peak and are down 8% since the war started.
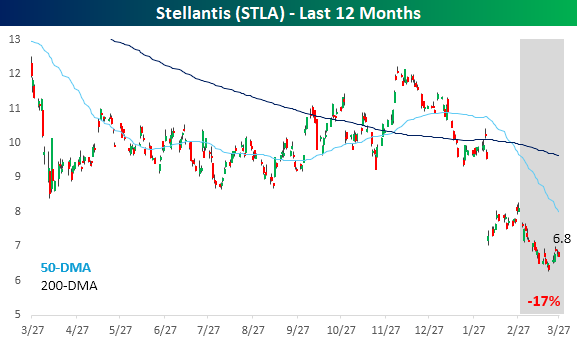
Unlike F and GM, Stellantis (STLA) was already weak leading up to the war and down sharply from its 52-week highs. Since then, it’s only got worse as shares are down 17% this month.
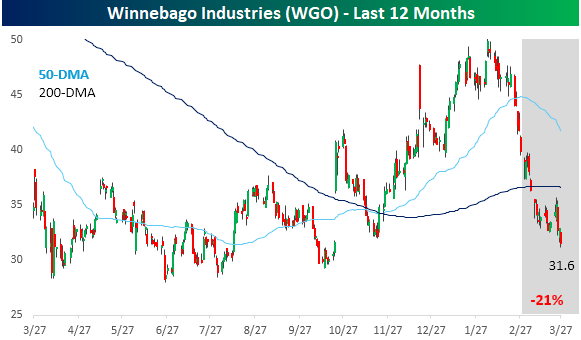
When you think of car stocks, Winnebago (WGO) may not be the first stock that comes to mind, but boy, is it ever exposed to higher gas prices. Right before the war, the stock was right at 52-week highs, perhaps on optimism that many Americans would take road trips to celebrate America turning 250. A month later, with gas prices at $4 per gallon nationwide, and suddenly that 10-mile-per-gallon gas guzzler doesn’t seem nearly as good an idea.
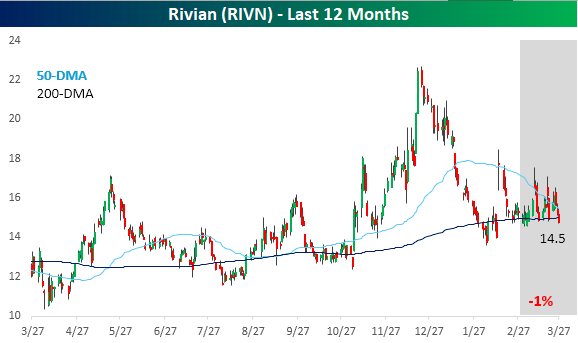
While traditional car companies with a focus on internal combustion engines have had a rough March, what about EV companies? Well, RIVN hasn’t rallied this month, but in this market, a decline of 1% is basically a win.
Until gas prices at the very least stop going up as quickly as they have, it’s going to be hard for these traditional auto stocks to get out of their own way.
Mar 30, 2026
See what’s driving market performance around the world in today’s Morning Lineup. Bespoke’s Morning Lineup is the best way to start your trading day. Read it now by starting a two-week trial to Bespoke Premium. CLICK HERE to learn more and start your trial.
“The circumstances of the world are so variable that an irrevocable purpose or opinion is almost synonymous with a foolish one.” William H. Seward
Below is a snippet of commentary from today’s Morning Lineup. Start a two-week trial to Bespoke Premium to view the full report.
After a rough finish to the week for bulls last Thursday and Friday, futures are looking to rally this morning after the President posted that “The United States of America is in serious discussions with A NEW, AND MORE REASONABLE, REGIME to end our Military Operations in Iran. Great progress has been made.”
As optimistic as those statements are, the President has made a habit of making positive early-week comments to try and soothe the market. It’s become so predictable that the Speaker of Iran’s Parliament posted on X last night that “ Pre-market so-called “news” or “Truth” is often just a setup for profit-taking. Basically, it’s a reverse indicator. Do the opposite: If they pump it, short it. If they dump it, go long.” So that’s where we are now.
Regardless of the investment advice from Iran, futures remain positive with the S&P 500 and Nasdaq both indicated to open up 0.6%, even as crude oil is higher (but off the overnight peak). Treasury yields are also sharply lower as the 10-year yield dips down to 4.37% from 4.44% last Friday. Gold prices are also 1.4% higher, and both moves could be taken as a sign that investors are becoming more aware of potential recessionary risks if the war drags on.
In economic data today, the Dallas Fed Manufacturing is the only report on the calendar, and economists expect a modest rebound from last month’s modestly positive report.
US futures may be higher this morning, but it was a rough night in Asia, with the only green shoot being China, where the Shanghai Composite eked out a 0.2% gain. Other indices in the region were all down roughly 1% or more, with the steepest declines coming in South Korea (-3.0%) and Japan (-2.8%). The yen briefly slumped to its lowest level versus the dollar in nearly two years, but rebounded to finish off its lows of the day after BoJ officials hinted that intervention could be on the way.
European equities are in a more jovial mood this morning as the STOXX 600 trades up 0.4% in the early going, while the FTSE 100 leads the region with a gain of 0.9%, but the rally has been broad with every major benchmark in positive territory, at least for now.
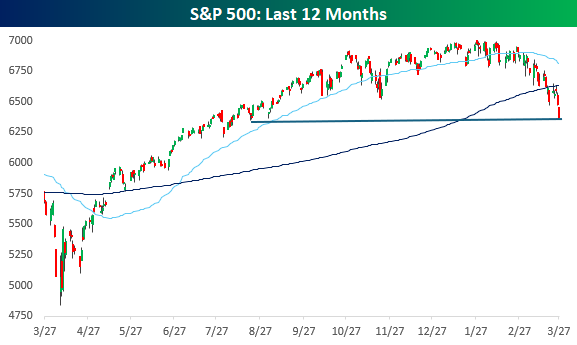
The S&P 500 traded down another 2.1% last week, extending its weekly losing streak to five and taking the total decline over this period to 7.8%. After breaking below its 200-day moving average the week before last, the intensity of selling picked up steam last week, taking the S&P 500 down to the lowest level since August 7. For anyone who argued that the market had gotten ahead of itself and needed a rest late last year, you got what you wanted. Despite all the weakness, though, the S&P 500 is still more than 30% above its intraday tariff-tantrum low from last April.
The current five-week losing streak in the S&P 500 ranks as the first such streak for the index in nearly four years (May 2022) and the 30th such streak since 1953, when the five-day trading week in its current form started in late 1952. With a decline of 7.8% during the last five weeks, the current decline has been less than the average of 8.4% for all streaks since 1952. The deepest decline was 17.5% in June 1962, while the mildest was in July 2004 when the S&P 500 declined just 3.1%.
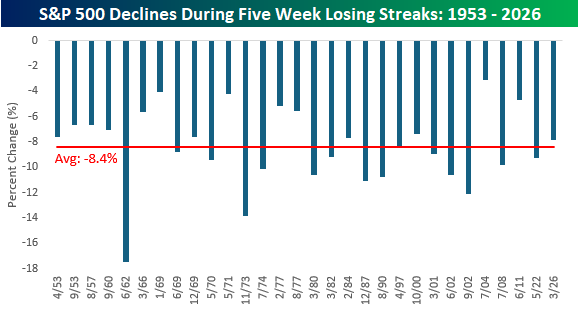
The long-term chart of the S&P 500 below shows when each prior streak occurred with a red dot. It’s interesting to see in the chart how these streaks were relatively common for much of the period from the early 1950s up through the Financial Crisis. Since the end of 2008, though, there have only been two other streaks in the last 17 years. Finally, in terms of whether these types of streaks represent buying opportunities or not, a look at the chart shows an inconclusive picture. Some of these streaks marked short-term lows for the market, but several others occurred right in the middle of longer-term downtrends.

Mar 27, 2026
See what’s driving market performance around the world in today’s Morning Lineup. Bespoke’s Morning Lineup is the best way to start your trading day. Read it now by starting a two-week trial to Bespoke Premium. CLICK HERE to learn more and start your trial.
“If my answers frighten you then you should cease asking scary questions.” – Quentin Tarantino
Below is a snippet of commentary from today’s Morning Lineup. Start a two-week trial to Bespoke Premium to view the full report.
It’s another one of those days where futures drift lower throughout the morning as traders follow the new daily routine of getting up, brushing their teeth, and clicking “Sell”. At 5 AM on the East Coast, when most of us were still asleep, futures were flat to marginally higher, but they have steadily lost steam all morning, and the S&P 500 is on pace to gap down 0.4%, while the Nasdaq is down 0.6%. Barring a major reversal during the trading day, the Nasdaq is poised for its 10th down week in the last 11. That consistency to the downside has only been seen in a handful of other periods throughout the index’s history.
Treasury yields are higher, with the 10-year yield up 4 bps to 4.46%, and WTI crude oil is up another 2.5% to just under $97 per barrel. That increase comes after President Trump said he would extend the deadline for Iran to open the Strait of Hormuz by 10-days because talks were “going very well”. While that looks bullish on the surface, it’s been taken as either a sign that the President is just buying more time to launch a ground invasion, or that talks are not going anywhere and the President is just stalling. The reality is that only a handful of people really do know, so investors are using the uncertainty as an excuse to sit things out.
On a more positive note, it looks like the government shutdown will end today, which should alleviate some of the pressure at US airports. Isn’t it ironic that after more than 40 days without paying TSA employees and subjecting people across the country to airport delays, Congress finally reached an agreement just in time for their two-week vacation? The idea that members of Congress are ‘public servants’ is starting to feel like the ultimate oxymoron; unless, of course, the public they’re serving is just each other.
In Asia overnight, most major equity benchmarks were lower on the session, although Hong Kong and China managed fractional gains. Outside of Australia, though, every other equity market was down for the week. In Europe, it’s much weaker with the STOXX 600 down 1.4%, putting it into the red for the week, and most individual country indices are down at least 1% on the day.
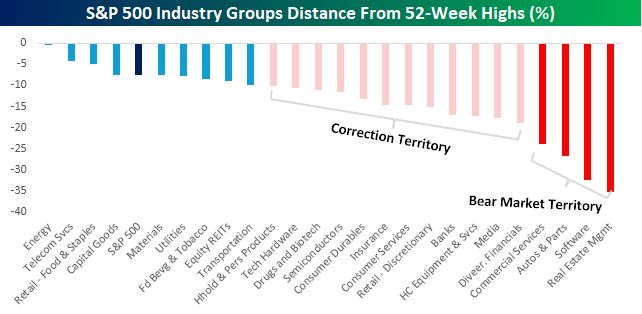
With yesterday’s decline, the S&P 500 is now down 7.5% from its intraday high earlier this year, putting it increasingly closer to correction territory. Of the 25 industry groups within the index, 16 closed at least 10% below their respective 52-week highs (on an intraday basis), and four of those are down at least 20%, putting them in bear market territory based on the 20% definition. Leading the way down, Real Estate Management has lost more than 35% of its value, but the most painful of the declines, given its weighting in the index, is Software, which is down by nearly a third.
On the positive, or less negative side, three groups closed within 5% of their respective highs yesterday, with the most obvious being Energy.
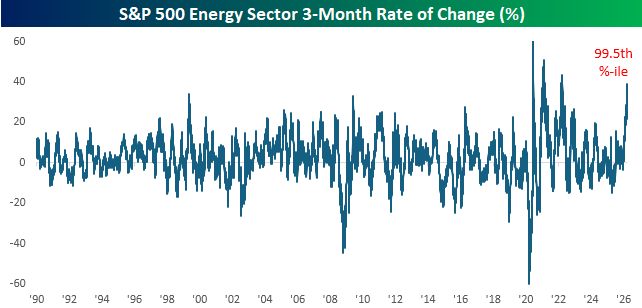
The rally in the Energy sector has reached historic proportions in the last few weeks. Over the last three months, the sector has rallied more than 38%, which ranks in the 99.5th percentile compared to all other periods since 1990. As shown in the chart below, the only times it experienced a larger rally were coming out of Covid and early in the Russia-Ukraine war.
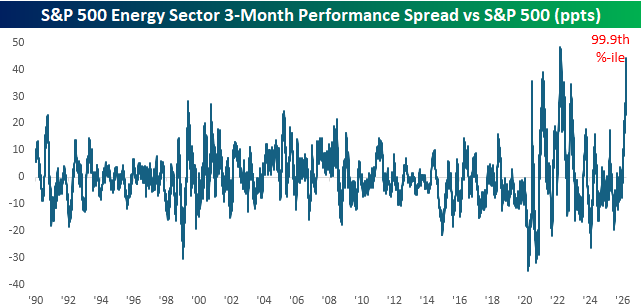
What’s even more impressive about the sector’s rally is that it came as the overall market declined. With the S&P 500 down over 6% in the last three months, the 44.4 percentage point performance spread between the two has only been wider for a brief period in March 2022. Outperformance of this magnitude on the part of the Energy sector is nearly unprecedented.
Mar 26, 2026
See what’s driving market performance around the world in today’s Morning Lineup. Bespoke’s Morning Lineup is the best way to start your trading day. Read it now by starting a two-week trial to Bespoke Premium. CLICK HERE to learn more and start your trial.
“When we have computers that can do more and more jobs, it’s going to change how we think about work. There’s no way around that. You can’t wish it away.” – Larry Page
Below is a snippet of commentary from today’s Morning Lineup. Start a two-week trial to Bespoke Premium to view the full report.
There’s no joy in Marketville this morning as investors step up to the place for the opening bell. Nasdaq futures are down nearly 1% while the S&P 500 faces a gap down of 0.75% at the open. Treasury yields are higher across the curve, WTO and Brent crude oil are both up over 4%, gold is down 2.5%, and Bitcoin is down over 2%. Fun morning for the bulls!
With the five-day deadline imposed by the President, Monday fast approaching, and no signs of a diplomatic breakthrough, investors have no incentive to make a stand, and that doesn’t even take into account the government shutdown snarling air traffic. Maybe the only good news is jobless claims. Initial claims came in right inline with expectations, while continuing claims were well below forecasts, falling to a nearly two-year low.
In Asia, stocks reflected the pessimism as the Nikkei fell 0.3%, China declined 1.1%, and South Korea dropped the most, falling 3.2%. European stocks are doing no better. The STOXX 600 is down 1.0% halfway into the session, led lower by Germany and the UK, which are both down over 1.25%. ECB council member and Bundesbank President Joachim Nagel even noted that a rate hike in April is “certainly an option”.
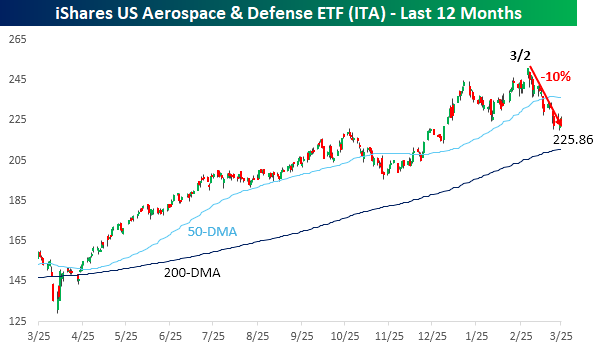
We’re now a month into the war in Iran, where every day’s news has shown images of precise strikes against the Iranian military. With all those weapons, it must be great for the defense contractors, right? Ironically, while aerospace and defense stocks performed well over the last year, they’ve seen a sell-the-news reaction since the war started. As shown in the chart of the iShares Aerospace & Defense ETF (ITA) below, the sector peaked on the first trading day after the first missiles were launched and has declined 10% since. That’s worse than the S&P 500!
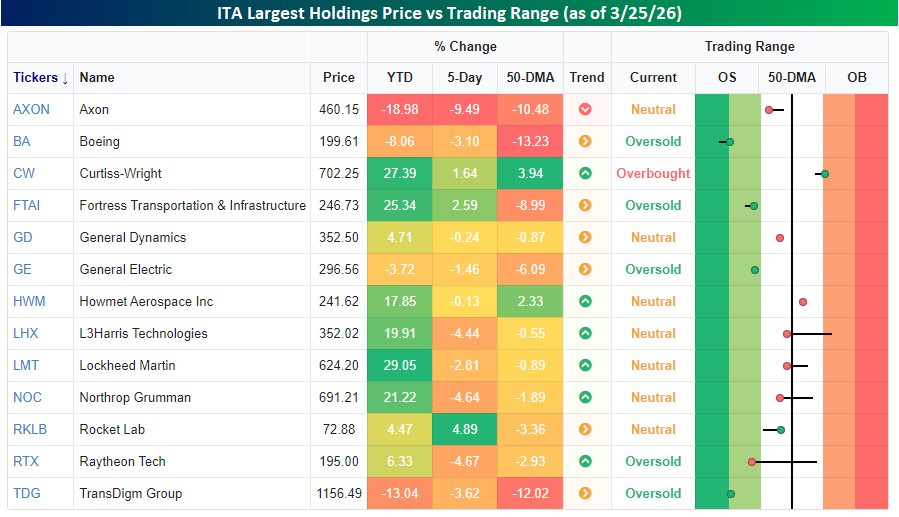
Looking through a list of ITA’s 13 largest holdings (all greater than 2% weighting), performance this year has mostly been positive. Nine of the thirteen stocks are up YTD, with an average YTD gain of just under 9%. Like the ETF, though, most of the largest holdings are below their 50-DMAs. In total, their average 50-DMA spread is -4.2%, and they’re down an average of 2% in the last five trading days.
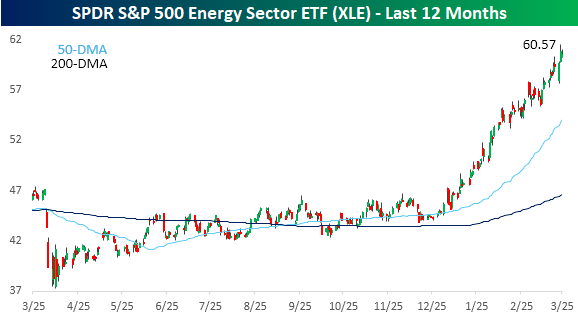
While defense stocks have struggled this month, Energy stocks have been on fire. The SPDR S&P 500 ETF (XLE) started to go parabolic at the turn of the calendar and hasn’t looked back since.
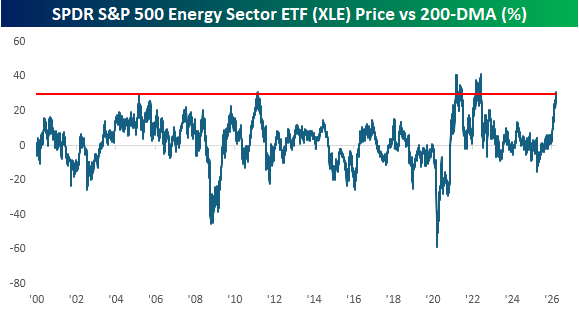
The rally in the sector has been so strong that the spread between XLE’s price and 200-DMA exceeded 30% this week. Since the ETF’s inception in 1999, there have only been a few other periods where the spread exceeded 30%. The most recent was early in the Russia-Ukraine war, and before that, the only other occurrences were in the first half of 2021 as the economy reopened from Covid and then briefly in early 2011 when oil prices spiked due to the Arab Spring and a civil war in Libya.
Mar 25, 2026
See what’s driving market performance around the world in today’s Morning Lineup. Bespoke’s Morning Lineup is the best way to start your trading day. Read it now by starting a two-week trial to Bespoke Premium. CLICK HERE to learn more and start your trial.
“It’s the rough side of the mountain that’s the easiest to climb; the smooth side doesn’t have anything for you to hang on to.” – Aretha Franklin
Below is a snippet of commentary from today’s Morning Lineup. Start a two-week trial to Bespoke Premium to view the full report.
Paul Hickey appeared on Fox Business yesterday. To view the segment, click on the image below.
Global equity markets are in rally mode this morning after reports of potential negotiations between the US and Iran to end the war. Asian markets surged overnight, and that flowed into the European open and US futures this morning. Some of the air has come out of the balloon as we type this, though, on reports that Iranian officials have rejected the US terms delivered via Pakistan. There’s really no way to know at this point what the facts are regarding the state of negotiations, as neither side has any real incentive to conduct talks via the press, so expect more whipsaw action as things continue to progress. The bottom line is that while Iran still holds some cards, the chips are stacked heavily against them.
Outside of equities, the 10-year yield is down 5 bps, crude oil is down 5%, gold is up nearly 4%, and Bitcoin is up 2.5% to more than $71K.
In economic data, the only report on the calendar was Import Prices, which came in at more than double expectations (1.3% m/m vs 0.6%). If you’re looking for lower rates or a dovish Fed, these are not pretty numbers.
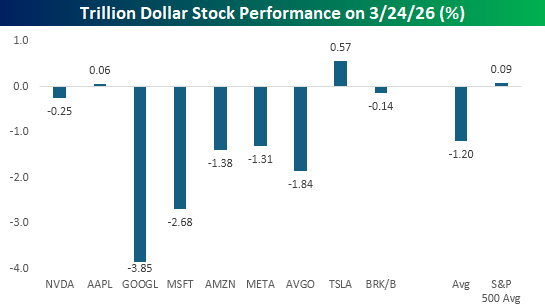
The S&P 500 finished down 0.37% yesterday, but most of the losses were focused in the trillion-dollar stock club, where the damage was much more concentrated. While the ‘average’ stock in the S&P 500 traded slightly higher yesterday, seven of the nine stocks in the trillion-dollar club traded lower, with an average of 1.2%. Stocks like Alphabet (GOOGL) and Microsoft (MSFT) were notably weak with declines of more than 2.5%, and both closed at multi-month lows. Other mega-caps like Broadcom (AVGO), Amazon.com (AMZN), and Meta Platforms (META) all fell more than 1%. The only mega-caps to buck the trillion-dollar market cap weight were Tesla (TSLA) and Apple (AAPL), which saw modest gains.
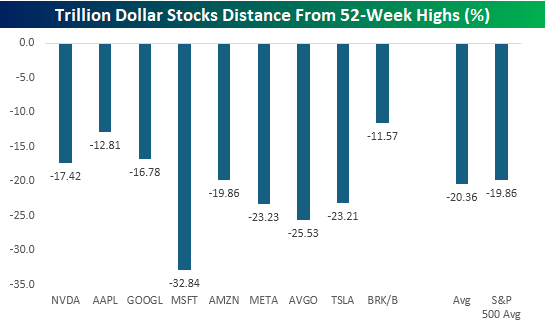
While the trillion-dollar stocks have been market leaders, they’re no longer the cool-kids table in the lunchroom. For months, they stood out above the rest of the market as the most popular in terms of where they were trading relative to 52-week highs, but now they no longer stand out. MSFT, AVGO, META, and TSLA are all down more than 20% from their respective 52-week highs, and the average drawdown from their peaks is just over 20%. That’s flirting with bear market territory and slightly more than the average 19.9% drawdown for all 500 stocks in the S&P 500.
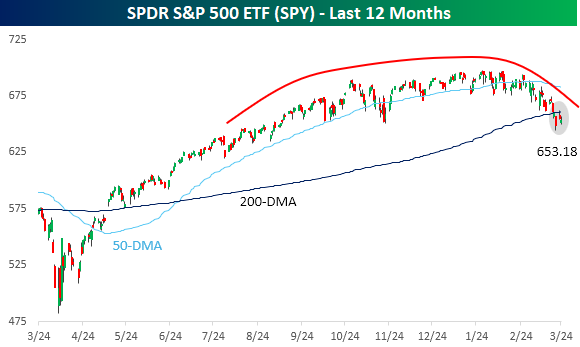
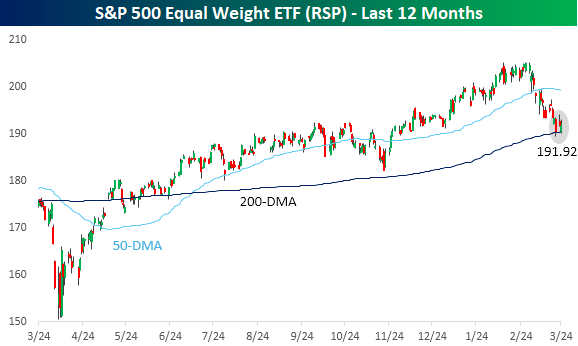
The cap-weighted S&P 500 (SPY) closed down just over 4% for the year yesterday, while the equal-weight version (RSP) is still slightly higher on the year (+0.2%), and their charts have two key differences.
First, as we’re all aware, the cap-weighted S&P 500 has been stuck in a sideways range for several months, forming a gradually curving, rounded top which accelerated when the war started at the turn of the month. The topping process for RSP was much sharper. From the start of the year right up until late February, RSP was steadily making new highs. Once the war broke out, though, the rally was stopped in its tracks, erasing two months’ worth of gains in less than a month.
Second, with RSP still holding on to gains for the year, it has also stayed above its 200-DMA. The same can’t be said for the S&P 500, which broke that level last Thursday. For now, bulls can rationalize SPY’s break of the 200-DMA by pointing to RSP still hanging on to that level. If both indices break that long-term average, though, bulls will have one less arrow in their quiver.