Jan 20, 2016
In today’s Chart of the Day, we take a look at the S&P 500’s drop below its October 2014 Ebola lows and what that means for the index going forward. We also provide commentary on how to handle tough times like this in the market.
To continue reading our Chart of the Day, enter your info below and start a free Bespoke research trial. During your trial, you’ll also receive access to our model stock portfolios, daily market alerts, and weekly Bespoke Report newsletter.
[thrive_leads id=’59052′]
Jan 19, 2016
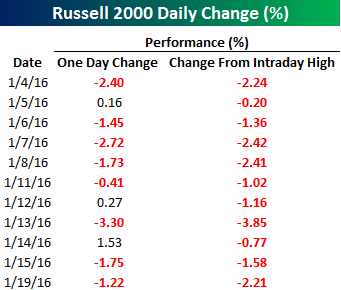 After opening the day higher, the Russell 2000 closed the day down more than 2% from its intraday high today. This marks the fifth time in 11 trading days this year that the index has finished the day more than 2% off of its intraday high, and the ninth time in the last eleven trading days that the small cap index has finished the day off at least 1% from its intraday high. Over those same eleven trading days, the Russell has only finished the day in the green three times. Needless to say, this kind of relentless selling pressure just kills investor sentiment.
In today’s Chart of the Day, we look at the recent intraday selling pressure in the Russell 2000 and how it relates to other periods of intense selling in the last twenty years. To say the least, the results are interesting.
To continue reading our Chart of the Day, enter your info below and start a free Bespoke research trial. During your trial, you’ll also receive access to our model stock portfolios, daily market alerts, and weekly Bespoke Report newsletter.
[thrive_leads id=’59052′]
Jan 15, 2016
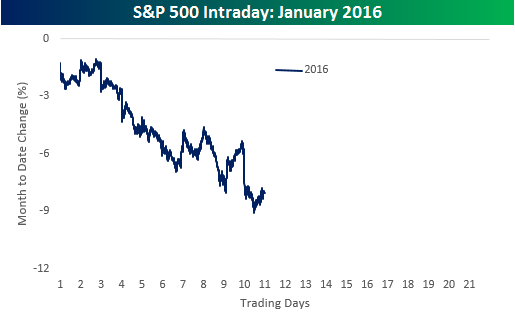
In today’s Chart of the Day, we look at the S&P 500’s poor start to 2016 in comparison to other years where the index dropped more than 5% in the first ten trading days of the year. We then also compared the intraday performance this year to other years since 1983 where the S&P 500 had a similar decline.
To continue reading our Chart of the Day, enter your info below and start a free Bespoke research trial. During your trial, you’ll also receive access to our model stock portfolios, daily market alerts, and weekly Bespoke Report newsletter.
[thrive_leads id=’59052′]
Jan 14, 2016
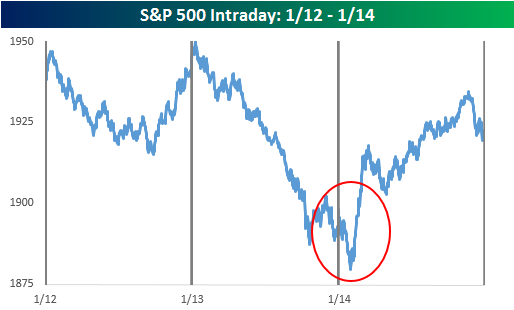
In today’s Chart of the Day, we look at Thursday’s intraday trading and compare it to characteristics of prior market bottoms to see if there are any similarities.
To continue reading our Chart of the Day, enter your info below and start a free Bespoke research trial. During your trial, you’ll also receive access to our model stock portfolios, daily market alerts, and weekly Bespoke Report newsletter.
[thrive_leads id=’59052′]
Jan 13, 2016
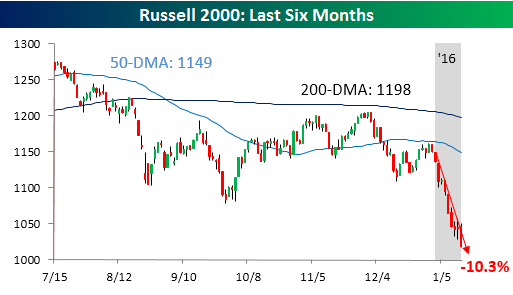
In today’s Chart of the Day, we highlight historical bear markets for the Russell 2000 which just officially entered bear market territory today. After running into resistance at its 50-day moving average at the end of 2015, the Russell 2000 has been in complete liquidation mode for all of 2016. As a case in point, there has only been one day so far in 2016 where the index closed higher than its opening level. As a result of this weakness, the index is now down more than 10% in 2016. If you think deflation has been solely confined to commodity prices, think again.
To continue reading our Chart of the Day, enter your info below and start a free Bespoke research trial. During your trial, you’ll also receive access to our model stock portfolios, daily market alerts, and weekly Bespoke Report newsletter.
[thrive_leads id=’59052′]
Jan 12, 2016
In today’s Chart of the Day, we highlight the performance of equities before and after prior Fed rate hikes that followed a prolonged period of no moves by the central bank.
To continue reading our Chart of the Day, enter your info below and start a free Bespoke research trial. During your trial, you’ll also receive access to our model stock portfolios, daily market alerts, and weekly Bespoke Report newsletter.
[thrive_leads id=’59052′]