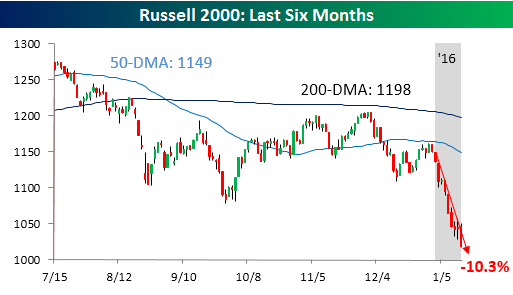
In today’s Chart of the Day, we highlight historical bear markets for the Russell 2000 which just officially entered bear market territory today. After running into resistance at its 50-day moving average at the end of 2015, the Russell 2000 has been in complete liquidation mode for all of 2016. As a case in point, there has only been one day so far in 2016 where the index closed higher than its opening level. As a result of this weakness, the index is now down more than 10% in 2016. If you think deflation has been solely confined to commodity prices, think again.
To continue reading our Chart of the Day, enter your info below and start a free Bespoke research trial. During your trial, you’ll also receive access to our model stock portfolios, daily market alerts, and weekly Bespoke Report newsletter.
[thrive_leads id=’59052′]
