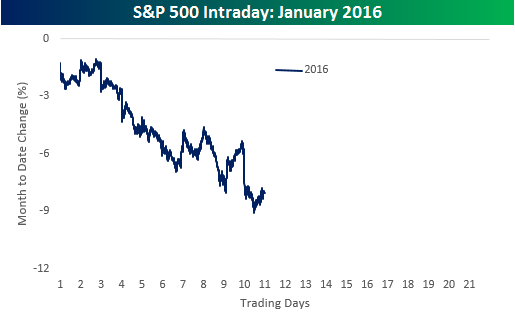
In today’s Chart of the Day, we look at the S&P 500’s poor start to 2016 in comparison to other years where the index dropped more than 5% in the first ten trading days of the year. We then also compared the intraday performance this year to other years since 1983 where the S&P 500 had a similar decline.
To continue reading our Chart of the Day, enter your info below and start a free Bespoke research trial. During your trial, you’ll also receive access to our model stock portfolios, daily market alerts, and weekly Bespoke Report newsletter.
[thrive_leads id=’59052′]
