Jan 28, 2016
In today’s Chart of the Day we take a closer look at margin debt and how the S&P 500 has historically performed following prior declines of 10% from an all-time peak.
To continue reading our Chart of the Day, enter your info below and start a free Bespoke research trial. During your trial, you’ll also receive access to our model stock portfolios, daily market alerts, and weekly Bespoke Report newsletter.
[thrive_leads id=’59052′]
Jan 27, 2016
In today’s Chart of the Day we take a closer look at Apple (AAPL) now that it has pulled back 30% from its all-time highs — losing nearly $250 billion in market cap.
To continue reading our Chart of the Day, enter your info below and start a free Bespoke research trial. During your trial, you’ll also receive access to our model stock portfolios, daily market alerts, and weekly Bespoke Report newsletter.
[thrive_leads id=’59052′]
Jan 26, 2016
In today’s Chart of the Day we take a look at a stock that’s in a solid long-term uptrend and trading at an attractive entry point.
To continue reading our Chart of the Day, enter your info below and start a free Bespoke research trial. During your trial, you’ll also receive access to our model stock portfolios, daily market alerts, and weekly Bespoke Report newsletter.
[thrive_leads id=’59052′]
Jan 25, 2016
In today’s Chart of the Day for 1/25/16 looking at years where the S&P 500 was down more than 5% through 1/25 as well as an update of our report from 1/15/16 comparing 2016 to 2008 and 2009.
To continue reading our Chart of the Day, enter your info below and start a free Bespoke research trial. During your trial, you’ll also receive access to our model stock portfolios, daily market alerts, and weekly Bespoke Report newsletter.
[thrive_leads id=’59052′]
Jan 22, 2016
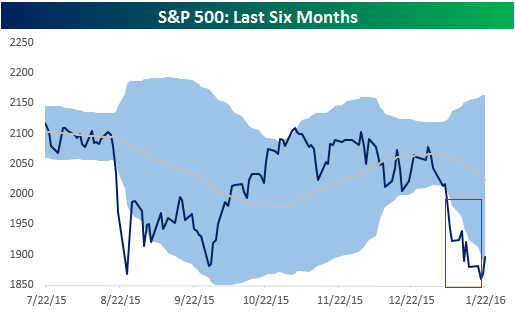 Through yesterday’s close, the S&P 500 closed more than two standard deviations below its 50-day moving average for eleven straight days. While just one day of closing more than two standard deviations below the 50-DMA is noteworthy enough, eleven is practically unheard of! Thankfully, it is looking like today’s rally will help to end this miserable streak, but even if the closing bell rang right now, the S&P 500 would still be oversold (>1 standard deviation below 50-DMA).
In today’s Chart of the Day, we took a look at prior periods where the S&P 500 closed more than two standard deviations below its 50-DMA for at least ten trading days and then analyzed market performance following each of those periods.
To continue reading our Chart of the Day, enter your info below and start a free Bespoke research trial. During your trial, you’ll also receive access to our model stock portfolios, daily market alerts, and weekly Bespoke Report newsletter.
[thrive_leads id=’59052′]
Jan 21, 2016
In today’s Chart of the Day, we take a look at the recent tick higher in jobless claims and its historical relationship with movements in the S&P 500.
To continue reading our Chart of the Day, enter your info below and start a free Bespoke research trial. During your trial, you’ll also receive access to our model stock portfolios, daily market alerts, and weekly Bespoke Report newsletter.
[thrive_leads id=’59052′]