Feb 5, 2016
In today’s Chart of the Day, we compare dividend cut announcements in 2015 to other years since 2005.
To continue reading our Chart of the Day, enter your info below and start a free Bespoke research trial. During your trial, you’ll also receive access to our model stock portfolios, daily market alerts, and weekly Bespoke Report newsletter.
[thrive_leads id=’59052′]
Feb 4, 2016
In today’s Chart of the Day, we highlight the stocks that analysts love and hate the most, and we also highlight the stocks that analysts have gotten the most bullish and bearish on over the last year.
To continue reading our Chart of the Day, enter your info below and start a free Bespoke research trial. During your trial, you’ll also receive access to our model stock portfolios, daily market alerts, and weekly Bespoke Report newsletter.
[thrive_leads id=’59052′]
Feb 3, 2016
In today’s Chart of the Day, we take a look at the monthly commodity surveys in the ISM reports and what this month’s levels portend for inflation going forward.
To continue reading our Chart of the Day, enter your info below and start a free Bespoke research trial. During your trial, you’ll also receive access to our model stock portfolios, daily market alerts, and weekly Bespoke Report newsletter.
[thrive_leads id=’59052′]
Feb 2, 2016
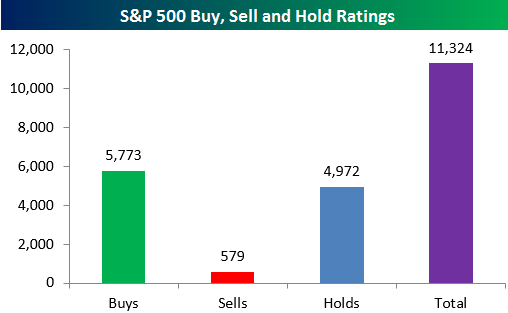
In today’s Chart of the Day, we take a look at the 11,000+ analyst ratings on S&P 500 stocks. As shown below, 5,773 of those ratings are Buy ratings, while just 579 are Sell ratings. Analysts are and always have been a bullish bunch. In today’s note, we break up the ratings by sector to identify areas of the market that analysts are currently the most bullish and bearish on. Whether you’re a contrarian or not, this is an interesting report.
To continue reading our Chart of the Day, enter your info below and start a free Bespoke research trial. During your trial, you’ll also receive access to our model stock portfolios, daily market alerts, and weekly Bespoke Report newsletter.
[thrive_leads id=’59052′]
Feb 1, 2016
In today’s Chart of the Day, we analyze similar historical circumstances for the ISM Manufacturing, which slipped below 50 for a fourth straight month this morning.
To continue reading our Chart of the Day, enter your info below and start a free Bespoke research trial. During your trial, you’ll also receive access to our model stock portfolios, daily market alerts, and weekly Bespoke Report newsletter.
[thrive_leads id=’59052′]
Jan 29, 2016
In today’s Chart of the Day, we take a look at the collapse in Biotech stocks over the last six months and compare it to the initial drop that both Tech and the Homebuilders experienced following their respective bubble peaks in 2000 and 2005.
To continue reading our Chart of the Day, enter your info below and start a free Bespoke research trial. During your trial, you’ll also receive access to our model stock portfolios, daily market alerts, and weekly Bespoke Report newsletter.
[thrive_leads id=’59052′]